Runtime Application Self-Protection Market Report Scope & Overview:
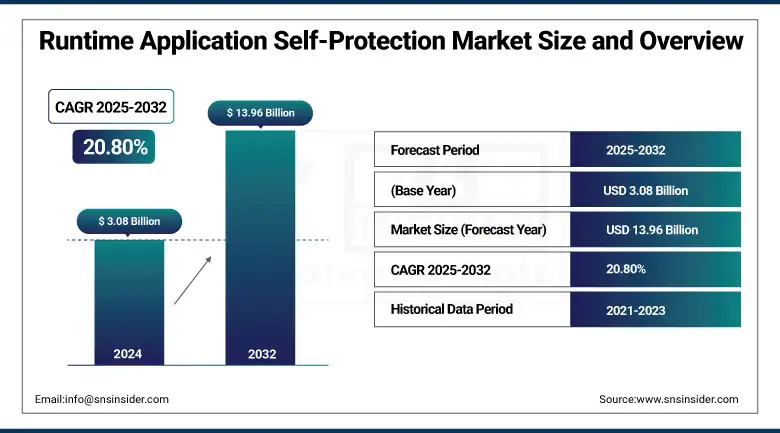
The Runtime Application Self-Protection Market size was valued at USD 3.08 billion in 2024 and is expected to reach USD 13.96 billion by 2032, expanding at a CAGR of 20.80% over the forecast period of 2025-2032.
The RASP (Runtime Application Self-Protection) market is growing rapidly as companies need real-time, application-layer security to mitigate the increasingly sophisticated cyber threats. RASP bakes security into the application code and provides real-time threat detection and defence. BFSI IT and telecom, healthcare, and retail are key marketable verticals, with data security and regulatory compliance as a new focus point. RASP provides context-aware, precise threat prevention with lower false positives than other traditional tools.” Key corporations, including Palo Alto Networks, Dynatrace, and Oracle, are revolutionising with AI and cloud combined. As zero trust and containerized environments grow, RASP is a crucial aspect of the modern cybersecurity framework.
To Get more information On Runtime Application Self-Protection Market - Request Free Sample Report
In 2023, more than 50% of data breaches will result from application-level vulnerabilities, which means that embedded security, including RASP, is a necessity. RASP-enabled businesses saw false positives reduced by 41%, with AI-based products proving 89% effective against zero-day threats.
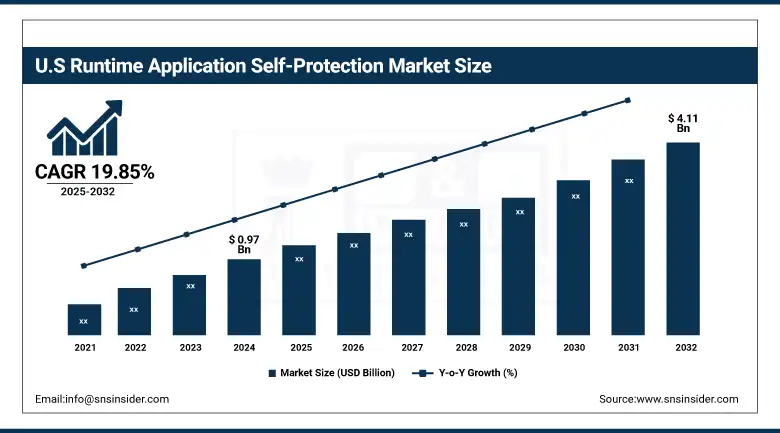
The U.S Runtime Application Self-Protection Market size reached USD 0.97 billion in 2024 and is expected to reach USD 4.11 billion in 2032 at a CAGR of 19.85% from 2025 to 2032.
The U.S. is dominant in terms of technology infrastructure, extensive adoption of cloud computing, and strict regulatory norms regarding cybersecurity. Factors such as higher levels of cyber threats, rising need for real-time application security, and the growing use of digital platforms across banks, healthcare institutions, retail, and IT are leading to the increased demand for botnet detection. Moreover, heavy investments in AI and machine learning for improved threat detection further drive the growth of the market. Availability of leading cybersecurity companies and the pace of innovation in adopting and deploying new security solutions also help to cement the leadership of RASP adoption and development in the U.S. market.
Runtime Application Self-Protection Market Dynamics
Drivers:
-
Rising Cybersecurity Threats and Increasing Adoption of Real-Time Application Security Solutions Drive Runtime Application Self-Protection Market Growth.
The increasing volume and sophistication of cyberattacks have forced organizations to focus on application security. RASP supplies threat prevention and detection in real time, within the application running environment, which is essential protection. Growing digitalization in various industries, along with rising compliance requirements, results in the adoption of RASP solutions. Businesses are spending billions of dollars on cutting-edge cybersecurity technologies in order to protect sensitive data and keep their business up and running seamlessly. The growing need for increased application-level security is a factor influencing the runtime application self-protection market growth since enterprises across the globe are constantly looking for safeguards against evolved cyberattacks.
Restraints:
-
High Implementation Costs and Complexity of Integrating Runtime Application Self-Protection Solutions Restrict Market Expansion.
Despite its benefits, the widespread adoption of RASP is limited by the high deployment costs and the complexity involved in integrating the technology. RASP implementation needs to have a fully developed infrastructure, which is expensive for small and medium-sized businesses. Furthermore, implementing RASP into legacy systems and applications can be complex without impacting application performance. These disadvantages of accessibility, particularly for cost-sensitive industries, to less penetration into the market. This, in addition to the costs of constant updates and maintenance, constitutes a barrier that limits the faster adoption of RASP in some domains.
Opportunities:
-
Emerging Cloud-Native and DevSecOps Trends Create New Growth Opportunities for Runtime Application Self-Protection Market.
The growing acceptance of cloud-native architectures and DevSecOps among large enterprises creates abundant growth prospects for the RASP market. With more and more applications being hosted in dynamic cloud environments, application security at runtime is crucial. RASP products are a strong fit for DevSecOps because they can be incorporated into the development process, as they allow organizations to deliver software quickly and safely. The increasing popularity of containerized applications and microservices thereby adds to the growing need for an adaptive security tool such as RASP. This emerging technology horizon presents enormous opportunities for RASP vendors to disrupt and address new markets that will further stimulate the growth trajectory.
Challenges:
-
Lack of Skilled Cybersecurity Professionals and Awareness Challenges the Effective Deployment of Runtime Application Self-Protection Solutions.
The lack of cybersecurity experts specializing in application security technologies is a major hurdle to the RASP market. Finding talent that can efficiently implement, configure, and maintain RASP tools is also a challenge for most organizations. Perhaps more broadly, there is some enterprise misunderstanding around the benefits of RASP and how it all works together in the first place, and why to invest in the first place. This technological shortfall, as well as the lack of education and training on new security technologies, hinders their use. Accordingly, market expansion is limited by these HR and knowledge obstacles, with an impact on broad deployment.
Runtime Application Self-Protection Market Segmentation Analysis
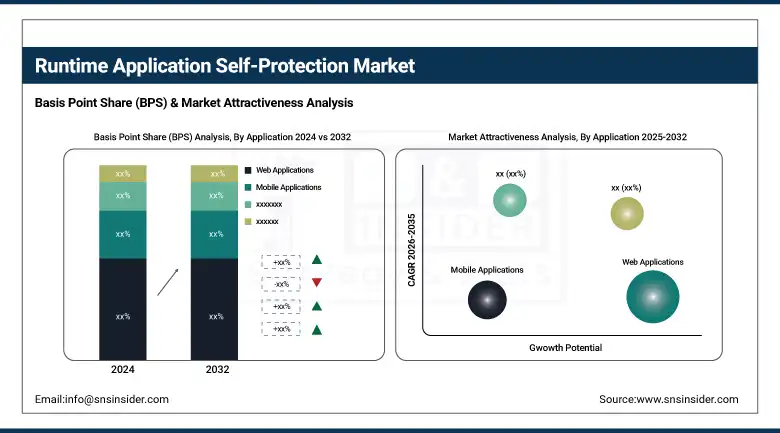
By Application
The Web Applications segment leads with a 35.16% revenue share in 2023, fuelled by the increasing use of web platforms in business. Players like Imperva and Veracode brought in more muscular RASP products meant to shield sophisticated apps on the fly. New features focus on automatic threat identification and response at runtime to help eliminate vulnerability to attacks like cross-site scripting and SQL injection. This category’s traction demonstrates a rising prioritization among the massive wave of businesses requiring robust in-app protection as they adopt web-first strategies, underlining the importance of RASP for securing dynamic web environments.
The API Security segment is the fastest-growing, with a CAGR of 22.12%, driven by the explosive growth of microservices and cloud-native architectures. “Startups like Salt Security and Data Theorem have taken their RASP-integrated API security solutions to the next level by providing API security tools that provide granular visibility into managed API transactions and can stop threats in real time at the API layer. Product features Innovations in the product have been aimed at discovering weird API traffic and securing sensitive data exchanges. This expansion ties in closely with the capabilities of RASP technology to incorporate security into the very fabric of application runtime, enabling to protection of APIs from menacing threats within complex, connected environments.
By Deployment Type
The Cloud-Based deployment segment commands a 45.32% revenue share, driven by cloud migration at scale and scalability needs. The foremost among them, such as Akamai and Check Point, provide cloud-native RASP solutions with deep security technologies that are designed to work alongside and complement cloud deployments, providing in-line, margin-less protection in real-time without affecting performance ratios in the least. New offerings provide multi-cloud support and human threat response. The primary use cases for a cloud-based deployment model reflect the changing nature of the market towards flexible, scalable modes of security that RASP is critical for securing applications that exist across diverse cloud architectures.
The Hybrid deployment segment is expanding at the highest CAGR of 22.72%, reflecting companies’ demand for on-premises and cloud workloads to coexist. This is starting to change, as companies including F5 Networks and Micro Focus have rolled out hybrid-compatible RASP offerings that allow for consistent application security, no matter where applications reside. Innovations are driven towards consolidated security management and interoperability with the current infrastructure. Surging hybrid usage underscores RASP’s flexibility in securing applications irrespective of where they are deployed, guaranteeing comprehensive security in heterogeneous IT environments.
By Technology
Machine Learning leads technology adoption with a 40.17% revenue share in 2023, the foundation of advanced threat detection and behavior analysis in RASP offerings. Smaller guns like Contrast Security and Waratek, on the other hand, have built RASP using ML to continuously learn from the application's behavior and spot anomalies and zero-day attacks. Product improvements involve predictive analytics and automated remediation for fewer false positives and faster responses. Machine learning within RASP represents a runtime application self-protection market industry goal to have security that is smarter and adaptive to defend against advanced attacks, in real-time.
Behavioral Analysis is the fastest-growing technology segment with a CAGR of 21.62%, due to its capability to identify slight runtime deviation caused by a potential cyber-attack. Players such as Prevoty (which is now a part of Imperva) and Cybereason have introduced RASP offerings that rely on real-time behavior analysis and threat context, for example. The new product implemented focuses on adding behavior-driven defense. This development highlights the importance of behavioral analysis in the evolution of the RASP frameworks, which allows the proactive detection of malicious activities that traditional signature-based methods are unaware of.
By End-User
The BFSI sector dominates with a 30.65% revenue share, and is fueled by compliance and the impetus to secure sensitive financial data. RASP leaders such as IBM and Synopsys are offering RASP for banking and insurance applications with features focusing on compliance as well as real-time fraud detection. Recent product developments have included compatibility with older systems, as well as additional encryption capabilities. Transparency of the BFSI industry over the RASP market is an indication of the importance of RASP solutions in securing high-value assets and also building trust in the digital finance sector in light of growing cyber threats.
The Healthcare segment is growing at the fastest CAGR of 22.31%, driven by rapid digitization of medical records and telehealth services. Healthcare-oriented RASP products have been released by runtime application self-protection market companies such as McAfee and Palo Alto Networks to secure health data and to ensure HIPAA compliance. Innovations are: monitoring of EHR applications in real-time and protection of IoT medical devices. The growth in this sector highlights RASP’s increasing position in healthcare cybersecurity and its ability to address distinct challenges related to privacy and regulatory headwinds across the rapidly developing digital health environment.
Runtime Application Self-Protection Market Regional Outlook
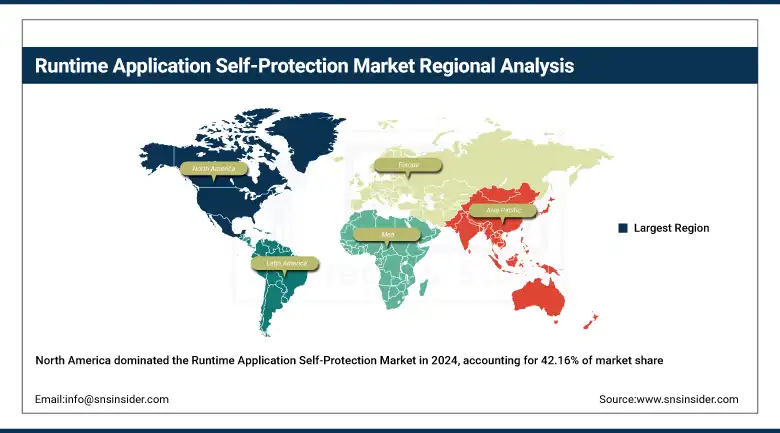
North America accounted for 42.16% of the Runtime Application Self-Protection market share in 2024, due to high awareness of cybersecurity, appetite to adopt early technologies, and the existence of many large RASP contributors. Sound investments toward application security in BFSI, IT, and healthcare sectors further add a stamp of authority over the market.
Get Customized Report as per Your Business Requirement - Enquiry Now
The United States is leading the market due to high cybersecurity infrastructure, ongoing R&D investment, stringent compliance regulations (HIPAA, PCI-DSS), and growing demand from organizations to protect applications in real-time.
Europe witnesses a consistent growth in the RASP market due to the growing regulatory pressure of GDPR and the growing risk of application layer attacks. Increasing the utilization of RASP across financial, automotive, and government sectors to combat growing cyber threats in the region is also making a significant contribution to the growth of the RASP market.
Germany dominates the European RASP market due to the presence of a developed industrial base, focus on data privacy, and high rate of digitalization in the enterprises that require runtime application-level protection.
The Asia-Pacific is the fastest-growing market, at a CAGR of 22.24%, due to the high adoption rate of cloud computing and high rate of cyberattacks and digital transformation across industries like e-commerce and healthcare. Increased spending on cybersecurity solutions is driving the growth of RASP implementations.
China is expected to witness high growth, as it is becoming increasingly digitalized, emerging number of APIs and web applications, increased mobile data, in line with government initiatives to make the nation smarter and more developed in terms of cybersecurity.
The MEA and Latin America regions are witnessing a rise in the demand for RASP solutions as organizations adopt modern IT infrastructure and deal with an increasing number of cyberattacks. Under the broader geographic banners, the UAE has taken the lead in MEA with outright smart city initiatives and cybersecurity investments, while Brazil tops in Latin America, due to its Robust Fintech startup base and upward demand for real-time app security solutions.
Key Players
The major key players of the Runtime Application Self-Protection Market are Contrast Security, Guardsquare, Pradeo, Promon, Palo Alto Networks, Dynatrace, Akamai Technologies, Oracle, Tanium, Check Point Software Technologies, and others.
Key Developments
-
April 2025 – Palo Alto Networks announced plans to acquire Protect AI, to advance AI security by assisting customers in detecting, controlling, and minimizing AI-related risks, further solidifying its position as a leader in leading-edge cybersecurity products.
-
May 2024 – Guardsquare won the Best Mobile App Security Solution award at the 12th Annual Global InfoSec Awards at the RSA Conference 2024, based on its excellence and leadership in mobile app protection.
| Report Attributes | Details |
|---|---|
| Market Size in 2024 | USD 3.08 Billion |
| Market Size by 2032 | USD 13.96 Billion |
| CAGR | CAGR of 20.80% From 2025 to 2032 |
| Base Year | 2024 |
| Forecast Period | 2025-2032 |
| Historical Data | 2021-2023 |
| Report Scope & Coverage | Market Size, Segments Analysis, Competitive Landscape, Regional Analysis, DROC & SWOT Analysis, Forecast Outlook |
| Key Segments | •By Application (Web Applications, Mobile Applications, Cloud Applications, API Security) •By Deployment Type (On-Premises, Cloud-Based, Hybrid) •By End User (BFSI, Healthcare, Retail, Government, Telecommunications) •By Technology (Machine Learning, Behavioral Analysis, Signature-Based Detection) |
| Regional Analysis/Coverage | North America (US, Canada, Mexico), Europe (Germany, France, UK, Italy, Spain, Poland, Turkey, Rest of Europe), Asia Pacific (China, India, Japan, South Korea, Singapore, Australia, Rest of Asia Pacific), Middle East & Africa (UAE, Saudi Arabia, Qatar, South Africa, Rest of Middle East & Africa), Latin America (Brazil, Argentina, Rest of Latin America) |
| Company Profiles | Contrast Security, Guardsquare, Pradeo, Promon, Palo Alto Networks, Dynatrace, Akamai Technologies, Oracle, Tanium, Check Point Software Technologies |
Frequently Asked Questions
Ans: North America dominated the Runtime Application Self-Protection Market in 2024, accounting for 42.16% of the market share.
Ans: The Cloud-Based deployment segment dominated the market with a 45.32% revenue share in 2023 and is expected to continue leading.
Ans: The major growth factor driving the market is the rising cybersecurity threats and increasing adoption of real-time application security solutions.
Ans: The Runtime Application Self-Protection Market size was valued at USD 3.08 billion in 2024.
Ans: The expected CAGR of the market from 2025 to 2032 is 20.80%.
Get in Touch
