image

Sand Control Solutions Market Report Scope & Overview:
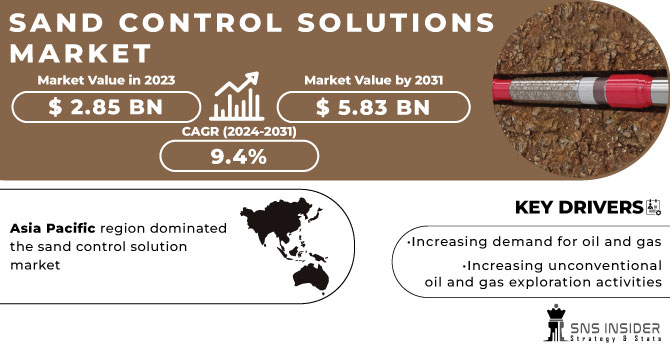
Sand Control Solutions Market size was valued at USD 2.5 billion in 2022 and is expected to grow to USD 5.01 billion by 2030 and grow at a CAGR of 9.1% over the forecast period of 2023-2030.

Sand control is a crucial process in the oil and gas industry that involves preventing sand and other solid particles from entering and damaging the wellbore. This process is essential for maintaining the integrity and productivity of the well. There are various methods of sand control, including gravel packing, sand screens, and chemical treatments. Gravel packing involves placing a layer of gravel around the wellbore to filter out sand and other particles. Sand screens are mesh-like structures that are placed around the wellbore to prevent sand from entering. Chemical treatments involve injecting chemicals into the well to solidify the sand and prevent it from flowing into the wellbore. Effective sand control is critical for maximizing the production of oil and gas wells. Without proper sand control, sand and other particles can clog the wellbore, reducing the flow of oil and gas and ultimately leading to decreased production and revenue. Therefore, it is essential to implement the appropriate sand control method for each well to ensure its long-term productivity and profitability.

Sand Control Solutions Market Revenue Analysis

The market for sand control solutions is a rapidly growing industry that provides innovative solutions for the oil and gas industry. The demand for sand control solutions has increased due to the rise in unconventional oil and gas exploration, which requires the use of hydraulic fracturing or "fracking" techniques. These techniques involve injecting high-pressure fluids into the well to fracture the rock and release the oil and gas. However, this process can also cause sand and other particles to enter the well, which can lead to clogging and reduced production. These solutions are designed to meet the specific needs of each well and can be customized to provide optimal performance and longevity. As the demand for oil and gas continues to grow, the sand control solutions market is expected to expand further. With advancements in technology and increased investment in research and development, the industry is poised for continued growth and innovation.

Market Dynamics

Drivers

  • Increasing demand for oil and gas

  • Increasing unconventional oil and gas exploration activities

The sand control solution market is being propelled by the rise in unconventional oil and gas exploration activities. Despite the ongoing global energy crisis, new oil and gas discoveries in 2022 have led to exploration reaching its highest value creation in over a decade, with a staggering $33 billion at base price. In fact, the average discovery in 2022 was over 150 million barrels of oil equivalent, which is more than double the average of the previous decade. This surge in exploration activities has created a significant demand for sand control solutions, which are essential for maintaining the integrity of oil and gas wells. As the demand for sand control solutions continues to grow, companies in the oil and gas industry are investing heavily in research and development to create more efficient and effective solutions. This has led to the development of new technologies and techniques that are helping to improve the efficiency and effectiveness of sand control solutions.

Restrain

  • High cost of sand control solutions

  • Fluctuation in the crude oil prices impacted the drilling activities

The sand control solution market is heavily dependent on the drilling industry, as it provides the necessary equipment and services to ensure the efficient extraction of oil and gas. However, the volatility of crude oil prices has led to a decrease in drilling activities, as companies are forced to cut costs and reduce their investments in exploration and production. This, in turn, has resulted in a decline in demand for sand control solutions, as there are fewer drilling projects that require such services.

Opportunities

  • Increasing demand for unconventional oil and gas resources, such as shale gas

  • Development of new and innovative sand control solutions that are environmentally friendly and cost-effective

Challenges

  • Environmental concerns associated with sand control solutions

Impact of COVID-19

Covid-19 impacted the sand control solution market negatively. The dual supply-demand shock and subsequent oil price crash have forced many explorers to reduce their 2020 planned capital expenditure budgets by between 10% and 50%. This has resulted in a multi-year low for exploration activities, with all major indicators for exploration activity levels seeing a significant decline in 2020. The number of international rigs has declined by 20%, and the number of new seismic contracts awarded has dropped by 45%. These figures are a clear indication of the impact of the pandemic on the industry. However, the pandemic has also resulted in a decrease in the demand for oil and gas, which has had a knock-on effect on the sand control solutions market.

Impact of Russia-Ukraine War:

In 2022, when Russia launched an attack on Ukraine, the global market saw a significant surge in crude oil prices. The cost per barrel rose from approximately $76 at the start of January to over $110 on March 4th. This sudden increase in crude oil prices had a ripple effect on the exploration activities of the oil and gas industry, which, in turn, impacted the sand control solution market. The rise in crude oil prices led to a decrease in exploration activities, as companies were forced to cut back on their budgets due to the increased costs. This, in turn, led to a decrease in demand for sand control solutions, as companies were not actively seeking new oil and gas reserves. The impact of the rise in crude oil prices on the sand control solution market was significant, as it led to a decrease in revenue for companies operating in this sector.

Impact of Recession:

According to the Energy Information Administration (EIA), a worldwide economic downturn is expected to decrease the demand for energy. As a result, the prices of WTI and natural gas at the Henry Hub are predicted to decline by 18.2% and 54.2%, respectively, until July 2023. This decrease in oil prices has led to a reduction in drilling activity, which, in turn, has resulted in a decrease in demand for sand control solutions. The EIA's forecast of a global economic downturn is a cause for concern for the energy industry. The decrease in demand for energy will have a significant impact on the prices of WTI and natural gas at the Henry Hub. The decline in oil prices has already led to a reduction in drilling activity, which has affected the demand for sand control solutions.

Market segmentation

By Type:

  • Gravel Pack

  • Frac Pack

  • Sand Screens

  • Inflow Control Devices

  • Others

By Well Type:

  • Horizontal Wells

  • Vertical Wells 

By Location:

  • Onshore

  • Offshore

By Application

  • Open Hole

  • Cased Hole

Sand Control Solutions Market Segmentation Analysis

Regional Analysis

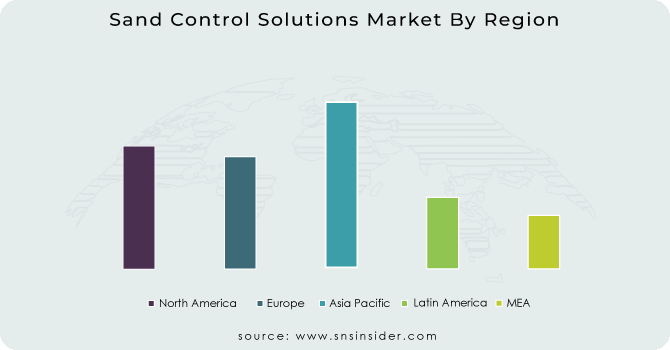
Asia Pacific region dominated the sand control solution market and is expected to lead this market in the future also. This can be attributed to several factors, including the region's vast oil and gas reserves, increasing demand for energy, and the presence of major oil and gas companies. Furthermore, the Asia Pacific region has a large number of offshore oil and gas fields, which require effective sand control solutions to prevent sand production and maintain good productivity. This has led to a surge in demand for sand control solutions in the region, driving the market growth. In addition, the Asia Pacific region has a highly skilled workforce and advanced technology, which has enabled the development of innovative sand control solutions. This has further strengthened the region's position in the market.

The North American region is projected to experience the highest CAGR in the sand control solution market during the forecast period. This can be attributed to the increasing demand for oil and gas production in the region, the growing number of shale gas reserves, and the implementation of advanced technologies in the oil and gas industry. Furthermore, the North American region has a well-established oil and gas industry, which has led to the development of advanced sand control solutions. In addition, the region has a favorable regulatory environment, which has encouraged the adoption of sand control solutions by oil and gas companies. This has further contributed to the growth of the sand control solution market in North America.

REGIONAL COVERAGE:

  • North America

    • USA

    • Canada

    • Mexico

  • Europe

    • Germany

    • UK

    • France

    • Italy

    • Spain

    • The Netherlands

    • Rest of Europe

  • Asia-Pacific

    • Japan

    • south Korea

    • China

    • India

    • Australia

    • Rest of Asia-Pacific

  • The Middle East & Africa

    • Israel

    • UAE

    • South Africa

    • Rest of the Middle East & Africa

  • Latin America

    • Brazil

    • Argentina

    • Rest of Latin America  

Key Players

The major key players are Schlumberger Limited, Halliburton Company, Baker Hughes, Weatherford International, Oil States International, Inc., Expro International Group, Tendeka, Mitchell Industries, China Oilfield Services, and other key players mentioned in the final report.

Baker Hughes-Company Financial Analysis

Company Landscape Analysis

Recent Development:

  • In June of 2023, Expro Group Holdings N.V., a leading energy services provider, announced a significant milestone in their partnership with TotalEnergies EP Uganda. The two companies have entered into a five-year Well Intervention and Integrity contract for the Tilenga project, which involves multiple wells. This exciting development is a testament to the expertise and dedication of both Expro and TotalEnergies EP Uganda in the field of energy services. With this contract, Expro will continue to provide top-notch well intervention and integrity services to ensure the success of the Tilenga project.

Sand Control Solutions Market Report Scope:
Report Attributes Details
Market Size in 2022  US$ 2.5 Bn
Market Size by 2030  US$  5.01 Bn
CAGR   CAGR of 9.1% From 2023 to 2030
Base Year 2022
Forecast Period  2023-2030
Historical Data  2020-2021
Report Scope & Coverage Market Size, Segments Analysis, Competitive  Landscape, Regional Analysis, DROC & SWOT Analysis, Forecast Outlook
Key Segments • By Type (Gravel Pack, Frac Pack, Sand Screens, Inflow Control Devices, and Others)
• By Well Type (Horizontal and Vertical)
• By Location (Onshore and Offshore)
• By Application (Open Hole and Cased Hole)
Regional Analysis/Coverage North America (USA, Canada, Mexico), Europe
(Germany, UK, France, Italy, Spain, Netherlands,
Rest of Europe), Asia-Pacific (Japan, South Korea,
China, India, Australia, Rest of Asia-Pacific), The
Middle East & Africa (Israel, UAE, South Africa,
Rest of Middle East & Africa), Latin America (Brazil, Argentina, Rest of Latin America)
Company Profiles Schlumberger Limited, Halliburton Company, Baker Hughes, Weatherford International, Oil States International, Inc., Expro International Group, Tendeka, Mitchell Industries, China Oilfield Services
Key Drivers • Increasing demand for oil and gas
• Increasing unconventional oil and gas exploration activities
Market Opportunities • Environmental concerns associated with sand control solutions


Frequently Asked Questions

Ans: The expected market size of the Sand Control Solutions Market is USD 5.01 billion in 2030.

Ans: The expected CAGR of the global Sand Control Solutions Market during the forecast period is 9.1%.

Ans: The major key players in the Sand Control Solutions Market are Schlumberger Limited, Halliburton Company, Baker Hughes, Weatherford International, Oil States International, Inc., Expro International Group, Tendeka, Mitchell Industries, and China Oilfield Services.

Ans: Asia Pacific contributes major to the Sand Control Solutions Market.

Ans: Increasing demand for oil and gas and increasing unconventional oil and gas exploration activities are the driving factors of the Sand Control Solutions Market.

Table of Contents

1. Introduction
1.1 Market Definition
1.2 Scope
1.3 Research Assumptions

2. Research Methodology

3. Market Dynamics
3.1 Drivers
3.2 Restraints
3.3 Opportunities
3.4 Challenges

4. Impact Analysis
4.1 COVID-19 Impact Analysis
4.2 Impact of Ukraine- Russia War
4.3 Impact of Ongoing Recession
4.3.1 Introduction
4.3.2 Impact on major economies
4.3.2.1 US
4.3.2.2 Canada
4.3.2.3 Germany
4.3.2.4 France
4.3.2.5 United Kingdom
4.3.2.6 China
4.3.2.7 Japan
4.3.2.8 South Korea
4.3.2.9 Rest of the World

5. Value Chain Analysis

6. Porter’s 5 forces model

7. PEST Analysis

8. Sand Control Solutions Market Segmentation, By Type
8.1 Gravel Pack
8.2 Frac Pack
8.3 Sand Screens
8.4 Inflow Control Devices
8.5 Others

9. Sand Control Solutions Market Segmentation, By Well Type
9.1 Horizontal Wells
9.2 Vertical Wells

10. Sand Control Solutions Market Segmentation, By Location
10.1 Onshore
10.2 Offshore

11. Sand Control Solutions Market Segmentation, By Application
11.1 Open Hole
11.2 Cased Hole

12. Regional Analysis
12.1 Introduction
12.2 North America
12.2.1 North America Sand Control Solutions Market by Country
12.2.2North America Sand Control Solutions Market by Type
12.2.3 North America Sand Control Solutions Market by Well Type
12.2.4 North America Sand Control Solutions Market by Location
12.2.5 North America Sand Control Solutions Market by Application
12.2.6 USA
12.2.6.1 USA Sand Control Solutions Market by Type
12.2.6.2 USA Sand Control Solutions Market by Well Type
12.2.6.3 USA Sand Control Solutions Market by Location
12.2.6.4 USA Sand Control Solutions Market by Application
12.2.7 Canada
12.2.7.1 Canada Sand Control Solutions Market by Type
12.2.7.2 Canada Sand Control Solutions Market by Well Type
12.2.7.3 Canada Sand Control Solutions Market by Location
12.2.7.4 Canada Sand Control Solutions Market by Application
12.2.8 Mexico
12.2.8.1 Mexico Sand Control Solutions Market by Type
12.2.8.2 Mexico Sand Control Solutions Market by Well Type
12.2.8.3 Mexico Sand Control Solutions Market by Location
12.2.8.4 Mexico Sand Control Solutions Market by Application
12.3 Europe
12.3.1 Europe Sand Control Solutions Market by country
12.3.2 Europe Sand Control Solutions Market by Type
12.3.3 Europe Sand Control Solutions Market by Well Type
12.3.4 Europe Sand Control Solutions Market by Location
12.3.5 Europe Sand Control Solutions Market by Application
12.3.6 Germany
12.3.6.1 Germany Sand Control Solutions Market by Type
12.3.6.2 Germany Sand Control Solutions Market by Well Type
12.3.6.3 Germany Sand Control Solutions Market by Location
12.3.6.4 Germany Sand Control Solutions Market by Application
12.3.7 UK
12.3.7.1 UK Sand Control Solutions Market by Type
12.3.7.2 UK Sand Control Solutions Market by Well Type
12.3.7.3 UK Sand Control Solutions Market by Location
12.3.7.4 UK Sand Control Solutions Market by Application
12.3.8 France
12.3.8.1 France Sand Control Solutions Market by Type
12.3.8.2 France Sand Control Solutions Market by Well Type
12.3.8.3 France Sand Control Solutions Market by Location
12.3.8.4 France Sand Control Solutions Market by Application
12.3.9 Italy
12.3.9.1 Italy Sand Control Solutions Market by Type
12.3.9.2 Italy Sand Control Solutions Market by Well Type
12.3.9.3 Italy Sand Control Solutions Market by Location
12.3.9.4 Italy Sand Control Solutions Market by Application
12.3.10 Spain
12.3.10.1 Spain Sand Control Solutions Market by Type
12.3.10.2 Spain Sand Control Solutions Market by Well Type
12.3.10.3 Spain Sand Control Solutions Market by Location
12.3.10.4 Spain Sand Control Solutions Market by Application
12.3.11 The Netherlands
12.3.11.1 Netherlands Sand Control Solutions Market by Type
12.3.11.2 Netherlands Sand Control Solutions Market by Well Type
12.3.11.3 Netherlands Sand Control Solutions Market by Location
12.3.11.4 Netherlands Sand Control Solutions Market by Application
12.3.12 Rest of Europe
12.3.12.1 Rest of Europe Sand Control Solutions Market by Type
12.3.12.2 Rest of Europe Sand Control Solutions Market by Well Type
12.3.12.3 Rest of Europe Sand Control Solutions Market by Location
12.3.12.4 Rest of Europe Sand Control Solutions Market by Application
12.4 Asia-Pacific
12.4.1 Asia Pacific Sand Control Solutions Market by country
12.4.2 Asia Pacific Sand Control Solutions Market by Type
12.4.3 Asia Pacific Sand Control Solutions Market by Well Type
12.4.4Asia Pacific Sand Control Solutions Market by Location
12.4.5Asia Pacific Sand Control Solutions Market by Application
12.4.6 Japan
12.4.6.1 Japan Sand Control Solutions Market by Type
12.4.6.2 Japan Sand Control Solutions Market by Well Type
12.4.6.3 Japan Sand Control Solutions Market by Location
12.4.6.4 Japan Sand Control Solutions Market by Application
12.4.7 South Korea
12.4.7.1 South Korea Sand Control Solutions Market by Type
12.4.7.2 South Korea Sand Control Solutions Market by Well Type
12.4.7.3 South Korea Sand Control Solutions Market by Location
12.4.7.4 South Korea Sand Control Solutions Market by Application
12.4.8 China
12.4.8.1 China Sand Control Solutions Market by Type
12.4.8.2 China Sand Control Solutions Market by Well Type
12.4.8.3 China Sand Control Solutions Market by Location
12.4.8.4 China Sand Control Solutions Market by Application
12.4.9 India
12.4.9.1 India Sand Control Solutions Market by Type
12.4.9.2 India Sand Control Solutions Market by Well Type
12.4.9.3 India Sand Control Solutions Market by Location
12.4.9.4 India Sand Control Solutions Market by Application
12.4.11 Australia
12.4.10.1 Australia Sand Control Solutions Market by Type
12.4.10.2 Australia Sand Control Solutions Market by Well Type
12.4.10.3 Australia Sand Control Solutions Market by Location
12.4.10.4 Australia Sand Control Solutions Market by Application
12.4.11 Rest of Asia-Pacific
12.4.11.1 APAC Sand Control Solutions Market by Type
12.4.11.2 APAC Sand Control Solutions Market by Well Type
12.4.11.3 APAC Sand Control Solutions Market by Location
12.4.11.4 APAC Sand Control Solutions Market by Application
12.5 The Middle East & Africa
12.5.1 The Middle East & Africa Sand Control Solutions Market by country
12.5.2 The Middle East & Africa Sand Control Solutions Market by Type
12.5.3 The Middle East & Africa Sand Control Solutions Market by Well Type
12.5.4The Middle East & Africa Sand Control Solutions Market by Location
12.5.5 The Middle East & Africa Sand Control Solutions Market by Application
12.5.6 Israel
12.5.6.1 Israel Sand Control Solutions Market by Type
12.5.6.2 Israel Sand Control Solutions Market by Well Type
12.5.6.3 Israel Sand Control Solutions Market by Location
12.5.6.4 Israel Sand Control Solutions Market by Application
12.5.7 UAE
12.5.7.1 UAE Sand Control Solutions Market by Type
12.5.7.2 UAE Sand Control Solutions Market by Well Type
12.5.7.3 UAE Sand Control Solutions Market by Location
12.5.7.4 UAE Sand Control Solutions Market by Application
12.5.8South Africa
12.5.8.1 South Africa Sand Control Solutions Market by Type
12.5.8.2 South Africa Sand Control Solutions Market by Well Type
12.5.8.3 South Africa Sand Control Solutions Market by Location
12.5.8.4 South Africa Sand Control Solutions Market by Application
12.5.9 Rest of Middle East & Africa
12.5.9.1 Rest of Middle East & Asia Sand Control Solutions Market by Type
12.5.9.2 Rest of Middle East & Asia Sand Control Solutions Market by Well Type
12.5.9.3 Rest of Middle East & Asia Sand Control Solutions Market by Location
12.5.9.4 Rest of Middle East & Asia Sand Control Solutions Market by Application
12.6 Latin America
12.6.1 Latin America Sand Control Solutions Market by Country
12.6.2 Latin America Sand Control Solutions Market by Type
12.6.3 Latin America Sand Control Solutions Market by Well Type
12.6.4 Latin America Sand Control Solutions Market by Location
12.6.5 Latin America Sand Control Solutions Market by Application
12.6.6 Brazil
12.6.6.1 Brazil Sand Control Solutions Market by Type
12.6.6.2 Brazil Africa Sand Control Solutions Market by Well Type
12.6.6.3 Brazil Sand Control Solutions Market by Location
12.6.6.4 Brazil Sand Control Solutions Market by Application
12.6.7 Argentina
12.6.7.1 Argentina Sand Control Solutions Market by Type
12.6.7.2 Argentina Sand Control Solutions Market by Well Type
12.6.7.3 Argentina Sand Control Solutions Market by Location
12.6.7.4 Argentina Sand Control Solutions Market by Application
12.6.8 Rest of Latin America
12.6.8.1 Rest of Latin America Sand Control Solutions Market by Type
12.6.8.2 Rest of Latin America Sand Control Solutions Market by Well Type
12.6.8.3 Rest of Latin America Sand Control Solutions Market by Location
12.6.8.4 Rest of Latin America Sand Control Solutions Market by Application

13 Company Profile
13.1 Schlumberger Limited
13.1.1 Market Overview
13.1.2 Financials
13.1.3 Product/Services/Offerings
13.1.4 SWOT Analysis
13.1.5 The SNS View
13.2 Halliburton Company
13.2.1 Market Overview
13.2.2 Financials
13.2.3 Product/Services/Offerings
13.2.4 SWOT Analysis
13.2.5 The SNS View
13.3 Baker Hughes
13.3.1 Market Overview
13.3.2 Financials
13.3.3 Product/Services/Offerings
13.3.4 SWOT Analysis
13.3.5 The SNS View
13.4 Weatherford International
13.4.1 Market Overview
13.4.2 Financials
13.4.3 Product/Services/Offerings
13.4.4 SWOT Analysis
13.4.5 The SNS View
13.5 Oil States International, Inc.
13.5.1 Market Overview
13.5.2 Financials
13.5.3 Product/Services/Offerings
13.5.4 SWOT Analysis
13.5.5 The SNS View
13.6 Expro International Group
13.6.1 Market Overview
13.6.2 Financials
13.6.3 Product/Services/Offerings
13.6.4 SWOT Analysis
13.6.5 The SNS View
13.7 Tendeka
13.7.1 Market Overview
13.7.2 Financials
13.7.3 Product/Services/Offerings
13.7.4 SWOT Analysis
13.7.5 The SNS View
13.8 Mitchell Industries
13.8.1 Market Overview
13.8.2 Financials
13.8.3 Product/Services/Offerings
13.8.4 SWOT Analysis
13.8.5 The SNS View
13.9 China Oilfield Services
13.9.1 Market Overview
13.9.2 Financials
13.9.3 Product/Services/Offerings
13.9.4 SWOT Analysis
13.9.5 The SNS View

14. Competitive Landscape
14.1 Competitive Benchmarking
14.2 Market Share Analysis
14.3 Recent Developments

15. USE Cases and Best Practices

16. Conclusion

An accurate research report requires proper strategizing as well as implementation. There are multiple factors involved in the completion of good and accurate research report and selecting the best methodology to compete the research is the toughest part. Since the research reports we provide play a crucial role in any company’s decision-making process, therefore we at SNS Insider always believe that we should choose the best method which gives us results closer to reality. This allows us to reach at a stage wherein we can provide our clients best and accurate investment to output ratio.

Each report that we prepare takes a timeframe of 350-400 business hours for production. Starting from the selection of titles through a couple of in-depth brain storming session to the final QC process before uploading our titles on our website we dedicate around 350 working hours. The titles are selected based on their current market cap and the foreseen CAGR and growth.


The 5 steps process:

Step 1: Secondary Research:

Secondary Research or Desk Research is as the name suggests is a research process wherein, we collect data through the readily available information. In this process we use various paid and unpaid databases which our team has access to and gather data through the same. This includes examining of listed companies’ annual reports, Journals, SEC filling etc. Apart from this our team has access to various associations across the globe across different industries. Lastly, we have exchange relationships with various university as well as individual libraries.

Secondary Research

Step 2: Primary Research

When we talk about primary research, it is a type of study in which the researchers collect relevant data samples directly, rather than relying on previously collected data.  This type of research is focused on gaining content specific facts that can be sued to solve specific problems. Since the collected data is fresh and first hand therefore it makes the study more accurate and genuine.

We at SNS Insider have divided Primary Research into 2 parts.

Part 1 wherein we interview the KOLs of major players as well as the upcoming ones across various geographic regions. This allows us to have their view over the market scenario and acts as an important tool to come closer to the accurate market numbers. As many as 45 paid and unpaid primary interviews are taken from both the demand and supply side of the industry to make sure we land at an accurate judgement and analysis of the market.

This step involves the triangulation of data wherein our team analyses the interview transcripts, online survey responses and observation of on filed participants. The below mentioned chart should give a better understanding of the part 1 of the primary interview.

Primary Research

Part 2: In this part of primary research the data collected via secondary research and the part 1 of the primary research is validated with the interviews from individual consultants and subject matter experts.

Consultants are those set of people who have at least 12 years of experience and expertise within the industry whereas Subject Matter Experts are those with at least 15 years of experience behind their back within the same space. The data with the help of two main processes i.e., FGDs (Focused Group Discussions) and IDs (Individual Discussions). This gives us a 3rd party nonbiased primary view of the market scenario making it a more dependable one while collation of the data pointers.

Step 3: Data Bank Validation

Once all the information is collected via primary and secondary sources, we run that information for data validation. At our intelligence centre our research heads track a lot of information related to the market which includes the quarterly reports, the daily stock prices, and other relevant information. Our data bank server gets updated every fortnight and that is how the information which we collected using our primary and secondary information is revalidated in real time.

Data Bank Validation

Step 4: QA/QC Process

After all the data collection and validation our team does a final level of quality check and quality assurance to get rid of any unwanted or undesired mistakes. This might include but not limited to getting rid of the any typos, duplication of numbers or missing of any important information. The people involved in this process include technical content writers, research heads and graphics people. Once this process is completed the title gets uploader on our platform for our clients to read it.

Step 5: Final QC/QA Process:

This is the last process and comes when the client has ordered the study. In this process a final QA/QC is done before the study is emailed to the client. Since we believe in giving our clients a good experience of our research studies, therefore, to make sure that we do not lack at our end in any way humanly possible we do a final round of quality check and then dispatch the study to the client.

Start a Conversation

Hi! Click one of our member below to chat on Phone