Security Inspection Market Report Scope & Overview:
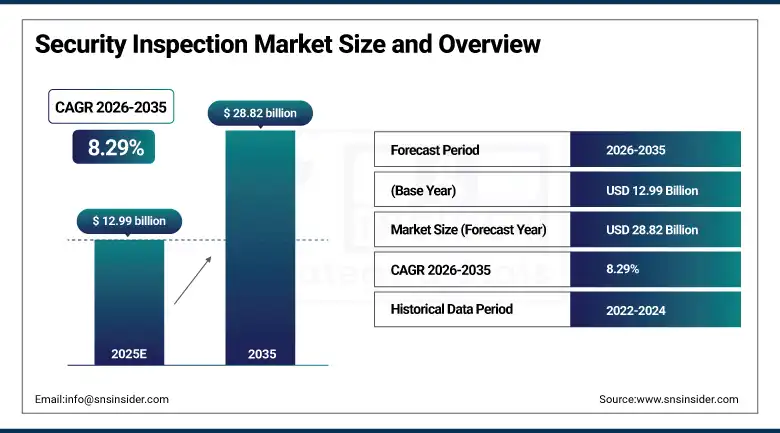
Security Inspection Market was valued at USD 12.99 billion in 2025 and is expected to reach USD 28.82 billion by 2035, growing at a CAGR of 8.29% from 2026-2035.
Security Inspection Market growth is propelled by increased security threats, terrorism dangers, and smuggling at the border level. The demand for screening technology in airport checkpoints, border control, and infrastructure will contribute significantly to market growth. International business activities and strict laws by the government will encourage the use of cargo and baggage screening systems. Innovation in X-ray imaging, CT scans, and artificial intelligence-based technologies will drive market growth in the transportation and public sector industries.
The International Air Transport Association (IATA) reported that global air passenger traffic reached over 94% of pre-pandemic levels in 2024, significantly increasing the need for advanced airport screening and security inspection systems.
Market Size and Forecast
-
Market Size in 2025: USD 12.99 Billion
-
Market Size by 2035: USD 28.82 Billion
-
CAGR: 8.29% from 2026 to 2035
-
Base Year: 2025
-
Forecast Period: 2026–2035
-
Historical Data: 2022–2024
To Get more information On Security Inspection Market - Request Free Sample Report
Security Inspection Market Trends
-
Rising concerns over public safety, terrorism threats, and illegal trafficking are driving the security inspection market.
-
Growing adoption across airports, seaports, border checkpoints, government facilities, and critical infrastructure is boosting market growth.
-
Expansion of transportation security and global trade is fueling deployment of advanced inspection systems.
-
Increasing focus on detection of explosives, weapons, narcotics, and contraband is shaping adoption trends.
-
Advancements in X-ray imaging, CT-based scanning, AI-enabled threat detection, and automated screening systems are enhancing accuracy and speed.
-
Rising regulatory requirements and compliance standards for security screening are supporting market expansion.
-
Collaborations between security agencies, technology providers, and equipment manufacturers are accelerating innovation and global adoption.
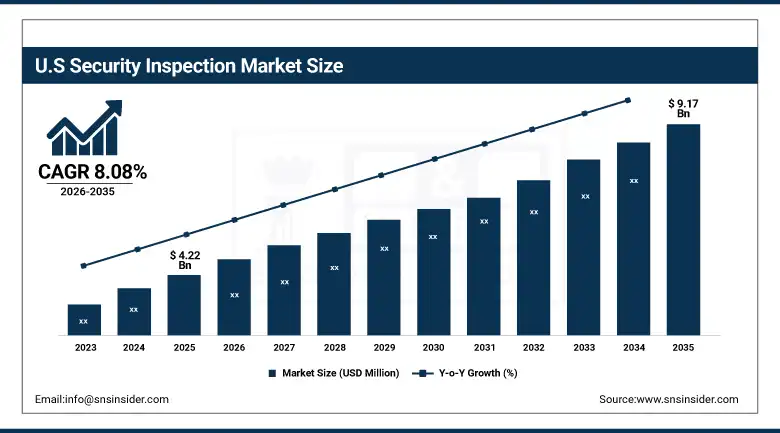
U.S. Security Inspection Market was valued at USD 4.22 billion in 2025 and is expected to reach USD 9.17 billion by 2035, growing at a CAGR of 8.08% from 2026-2035.
U.S. Security Inspection Market growth is driven by rising security threats, strict regulations, and increasing adoption of advanced screening technologies. Expanding airport modernization, border security investments, and growing international trade are further supporting demand. Continuous innovation in AI-based detection and imaging systems is also boosting market expansion.
Security Inspection Market Segment Highlights
-
By Product, Cargo and baggage inspection systems segment dominated the Security Inspection Market in 2025 with 41% share; Explosives and drugs trace detection systems segment fastest growing.
-
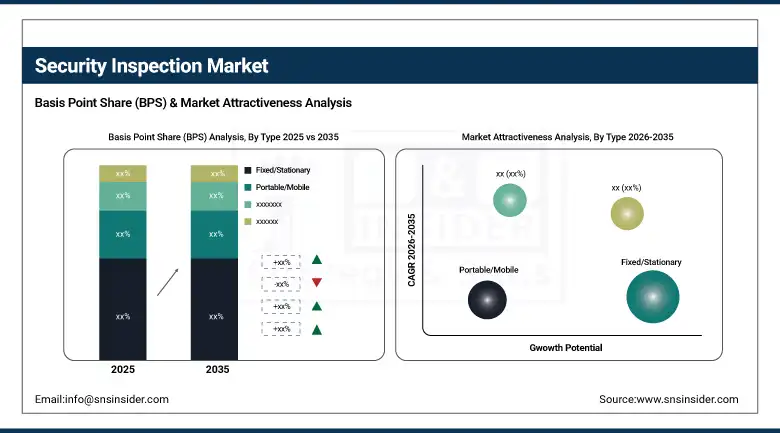
By Type, Fixed/Stationary systems segment dominated the Security Inspection Market in 2025 with 72% share; Portable/Mobile security inspection systems segment fastest growing.
-
By Technology, X-ray Imaging segment dominated the Security Inspection Market in 2025 with 63% share; Computed Tomography segment fastest growing.
-
By Application, Aviation segment dominated the Security Inspection Market in 2025 with 38% share; Border Security segment fastest growing.
Security Inspection Market Segment Analysis
By Product, Cargo and baggage inspection systems segment dominates the Security Inspection Market, Explosives and drugs trace detection systems segment expected to grow fastest
Cargo and baggage inspection systems dominated the Security Inspection Market during 2025 due to growth in global cargo volume, stringent aviation safety laws, and increase in passengers. Their widespread application lies in efficient detection of smuggled products, explosives, and other restricted goods. Regular upgrading of infrastructure within airports and deployment of new scanning technologies also helped to ensure higher demand, as they form the major part of screening procedures.
In June 2024, OSI Systems secured a USD 11 million order to supply mobile cargo and vehicle inspection systems, underscoring strong investment and demand in scalable, on-the-move scanning solutions.
Explosives and drugs trace detection systems are expected to grow at the highest CAGR due to threats posed by terrorism, drug trade, and homeland security concerns. Development of nanotechnology-based and portable detection systems that give instant results is being researched. There is already an increased use of trace detectors in aviation, border control and for public events up to 2035.
By Type, Fixed/Stationary systems segment dominates the Security Inspection Market, Portable/Mobile security inspection systems segment expected to grow fastest
The Fixed/Stationary system segment was majorly dominant in the Security Inspection Market in 2025 owing to the fact that it is installed in various places including airports, border check posts, critical infrastructure and high-risk locations requiring such security measures. The systems provide high throughput, high-end imagery and constant functionality during security screening. They can be deployed where there is very high traffic as far as passengers and cargo movements are concerned.
In March 2024, TSA began testing a fixed, self-service security checkpoint prototype at Harry Reid International Airport (Las Vegas). The system consolidates primary and secondary screening on a single conveyor lane, aiming to reduce manpower from five to two officers while maintaining throughput.
Portable/Mobile security inspection systems segment is fastest growing (CAGR) due to the increasing requirement for mobile deployment systems. The use of such systems can be seen in emergency situations, temporary security checks, and field inspections where there is no fixed infrastructure. Improvements in portable imaging techniques have contributed to this development. The increasing threats in the public event locations, borders, and remote places have boosted their demand.
By Technology, X-ray Imaging segment dominates the Security Inspection Market, Computed Tomography segment expected to grow fastest
The X-ray Imaging Segment held the highest share of the Security Inspection Market in 2025 due to its efficient, cost-effective, and established nature of use at airport terminals, customs, and important infrastructure. The reliability of X-ray devices to detect hidden threats in bags, freight and parcels along with their efficient processing capacity gives it an edge over other technologies. Continued advancements in image quality and automated threat detection increase its efficiency.
The Computed Tomography category will be the fastest-growing (CAGR) in the future as a result of superior capability in generating high-resolution 3D images that aid in identifying various types of threats. This technology facilitates detailed volumetric scanning to detect bombs, liquids, and hidden items. Growing deployment of computed tomography for screening of carry-on luggage in aviation security has resulted in market growth.
By Application, Aviation segment dominates the Security Inspection Market, Border Security segment expected to grow fastest
The Aviation sector was leading the Security Inspection Market in 2025 because of stringent aviation security regulations and the need to continuously screen high passenger traffic. The airports are keen to deploy advanced inspection systems to guarantee safety of passengers and efficient baggage inspection processes. The growth in air travel as well as upgrading of airports to meet modern requirements makes this market sector a key adopter of security inspection systems.
The Border Security sector was growing at the highest compound annual growth rate (CAGR). There were rising security threats such as terrorism, smuggling, and human trafficking across international borders. Governments have been allocating substantial budgets towards deployment of latest inspection systems to ensure national security and effective monitoring at border regions. Deployment of automated inspection systems has made border security more efficient. Growth in geopolitical conflicts and adoption of smart borders initiatives drive this market's growth.
Market Regional Analysis
|
Region |
Major Country |
Share within Region (%) |
|---|---|---|
|
North America |
United States |
91.4% |
|
Europe |
United Kingdom |
24.7% |
|
Asia Pacific |
Australia |
8.6% |
|
Middle East & Africa |
UAE |
15.8% |
|
Latin America |
Brazil |
50.4% |
North America Security Inspection Market Insights
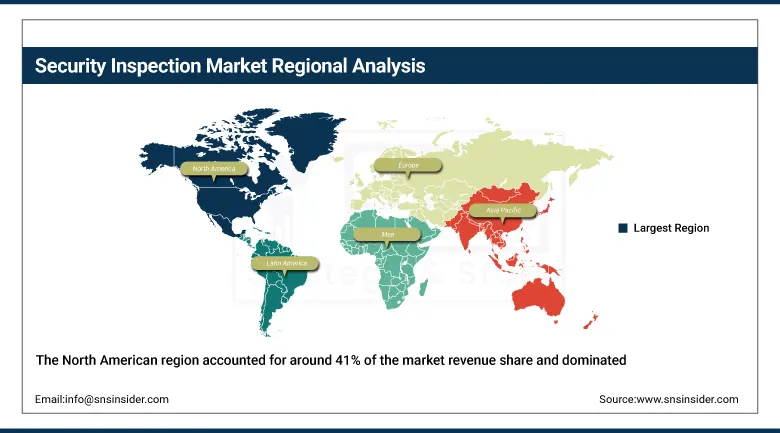
The North American region accounted for around 41% of the market revenue share and dominated the security inspection market in 2025. Some key factors contributing to the dominance include high adoption of advanced screening technologies in border points, airport security, and other crucial infrastructures. Additionally, considerable investment in transportation security, strict regulations by governments, and constant upgrading of airport facilities also fuel growth. Presence of major security technology manufacturers, and use of artificial intelligence-driven systems for inspection operations add up to the region’s supremacy in the market.
Get Customized Report as per Your Business Requirement - Enquiry Now
Asia Pacific Security Inspection Market Insights
The Asia-Pacific region will experience the highest CAGR in terms of demand for security inspection because of the fast development of infrastructure, growing aviation activity, and increased activities associated with cross-border trade. The increased government expenditure on the development of airport infrastructure, improvement of border security, and the development of smart cities will also support demand for security inspection. The increased use of high-tech inspection solutions like X-ray imaging, CT technology, and artificial intelligence detection software will boost demand in the security inspection market.
Europe Security Inspection Market Insights
Europe holds a significant share in the security inspection market, owing to stringent regulations, well-developed transportation facilities, and emphasis on public safety measures. Extensive use of screening technologies at different airports and border entry points as well as at critical infrastructures facilitates market growth. Rising application of intelligent detection systems, X-ray technology, and CT scan technology drives market demand. Regular updates to existing security systems and increasing threat levels such as terrorism and illegal trafficking activities are fueling market growth in Europe.
Middle East & Africa and Latin America Security Inspection Market Insights
The Middle East and Africa and Latin America are two emerging regions for the security inspection system. Both these markets are growing on account of increased investments towards building and upgrading airports and critical infrastructure facilities with security inspection systems like X-ray and AI-powered scanning equipment. Increased foreign trade activity, urbanization, and concerns regarding security threats are driving the adoption of such technologies. Market potential is strong, as both these markets have a lot of scope to grow in the future due to economic and security reasons.
Market Growth Drivers:
Rising Global Security Threats and Regulatory Mandates are Boosting Demand for Advanced Security Inspection Technologies Across Public and Private Sectors: R With the fast increase in activities such as terrorism, smuggling, and transnational crimes, there has become a necessity for security inspection systems to be installed in airports, seaports, governmental offices, and other public areas. Governments all over the world are implementing tough measures against use of high quality inspection systems that help detect explosives, weapons, and illegal drugs. There has been an upsurge in demand for highly efficient inspection systems like full body scanners, X-ray inspection systems, and trace detectors. The market is thus witnessing its growth due to the increased realization by organizations regarding the safety and protection of data. Global security measures and alliances, such as those set out by TSA and IATA, continue investing in state-of-the-art inspection systems for efficient upfront risk management.
Global Terrorism Index 2024 recorded a 22% increase in global terrorist deaths to 8,352 in 2023, and a rise in the average lethality per attack by 56%, underlining the need for sophisticated detection systems.
Market Restraints:
High Deployment and Integration Costs are Limiting Adoption among SMEs and Budget-Constrained Government Institutions: High installation and maintenance costs pose a major problem in particular for SMEs and the developing countries, where such inspection systems become a necessity. Although the use of 3D x-ray imaging, biometrics, and AI surveillance technologies is quite promising and modern, they involve substantial costs associated with deployment, training, and maintaining the systems. On top of that, integration with current security systems and IT infrastructure often requires specific measures, thereby adding to the TCO. Limited budget in many government organizations becomes another obstacle to wide deployment of inspection systems. The cost-sensitivity issue may affect the application of innovative inspection technologies across different settings.
Market Opportunities:
Adoption of AI, IoT, and Real-Time Analytics is Enabling Intelligent, Automated, and Scalable Security Inspection Solutions: Artificial intelligence (AI), internet of things (IoT) interface, and their associated real-time analytics present opportunities that are revolutionary in terms of security inspection. IoT helps in continuous data collection as well as remote monitoring, while artificial intelligence will ensure prediction as well as recognition of threats in advance. Together, these technologies help in ensuring that decisions made by the inspection system become faster and more accurate without having to involve human operators. At the same time, the use of real-time analytics helps in ensuring situational awareness, which will ensure that security officers can continuously monitor threats. As smart cities and infrastructures begin to depend more on digital environments, new markets emerge as well.
54% of companies had both AI and IoT in their infrastructure as of early 2024, and an additional 33% planned to implement them within two years.
Recent Developments:
-
2026: OSI Systems secured a USD 15 million order to supply cargo and vehicle inspection systems including X-ray scanning and non-intrusive detection technologies for government border security applications.
-
2026: Smiths Detection deployed a fully automated remote baggage screening system enabling cross-border airport inspection between international hubs, integrating AI-based image analysis and centralized security operations for enhanced efficiency.
-
2025: Leidos secured long-term TSA support contracts covering thousands of security screening units, ensuring maintenance and modernization of airport inspection systems including imaging and explosives detection platforms.
-
2024: Smiths Detection enhanced its HI-SCAN 6040 CTiX 3D X-ray scanner lineup with improved AI-based image analysis capabilities for cabin baggage screening, increasing detection accuracy for prohibited items in airport security checkpoints.
Security Inspection Market Key Players
-
Smiths Detection
-
OSI Systems, Inc.
-
Leidos Holdings, Inc.
-
Nuctech Company Limited
-
Analogic Corporation
-
Astrophysics Inc.
-
Teledyne FLIR LLC
-
L3Harris Technologies
-
CEIA S.p.A.
-
Westminster Group Plc
-
VOTI Detection Inc.
-
Adani Systems Inc.
-
Gilardoni S.p.A.
-
Bruker Corporation
-
Safran S.A.
-
Smiths Group plc
-
Unival Group GmbH
-
Kromek Group plc
-
VMI Security
-
Rohde & Schwarz
Security Inspection Market Report Scope:
| Report Attributes | Details |
|---|---|
| Market Size in 2025 | USD 12.99 Billion |
| Market Size by 2035 | USD 28.82 Billion |
| CAGR | CAGR of 8.29% From 2026 to 2035 |
| Base Year | 2025 |
| Forecast Period | 2026-2035 |
| Historical Data | 2022-2024 |
| Report Scope & Coverage | Market Size, Segments Analysis, Competitive Landscape, Regional Analysis, DROC & SWOT Analysis, Forecast Outlook |
| Key Segments | • By Product (Personnel Screening Systems, Checkpoint Screening Systems, Explosives and Drugs Trace Detection Systems, Liquid and Radioactive Substance Monitors, Cargo and Baggage Inspection Systems, Vehicle Inspection Systems) • By Type (Fixed/Stationary, Portable/Mobile) • By Technology (X-ray Imaging, Computed Tomography (CT), Metal Detection, Millimeter Wave Technology, Terahertz Imaging, Gamma-ray and Neutron Imaging) • By Application (Aviation, Border Security, Correctional Facilities and Law Enforcement, Critical Infrastructure Protection, Commercial Security) |
| Regional Analysis/Coverage | North America (US, Canada), Europe (Germany, UK, France, Italy, Spain, Russia, Poland, Rest of Europe), Asia Pacific (China, India, Japan, South Korea, Australia, ASEAN Countries, Rest of Asia Pacific), Middle East & Africa (UAE, Saudi Arabia, Qatar, South Africa, Rest of Middle East & Africa), Latin America (Brazil, Argentina, Mexico, Colombia, Rest of Latin America). |
| Company Profiles | Smiths Detection, OSI Systems, Inc. (Rapiscan Systems), Leidos Holdings, Inc., Nuctech Company Limited, Analogic Corporation, Astrophysics Inc., Teledyne FLIR LLC, L3Harris Technologies, CEIA S.p.A., Westminster Group Plc, VOTI Detection Inc., Adani Systems Inc., Gilardoni S.p.A., Bruker Corporation, Safran S.A. (Morpho Detection), Smiths Group plc, Unival Group GmbH, Kromek Group plc, VMI Security, Rohde & Schwarz |
Frequently Asked Questions
Ans: North America dominated the Security Inspection Market in 2025.
Ans: The Aviation segment dominated the Security Inspection Market in 2025.
Ans: Rising Global Security Threats and Regulatory Mandates are Boosting Demand for Advanced Security Inspection Technologies Across Public and Private Sectors.
Ans: The Security Inspection Market was valued at USD 12.99 billion in 2025.
Ans: The Security Inspection Market is expected to grow at a CAGR of 8.29% from 2026 to 2035.
Get in Touch
