Self-Adhesive Labels Market Report Scope & Overview:
Get Sample Copy of Self-Adhesive Labels Market - Request Sample Report
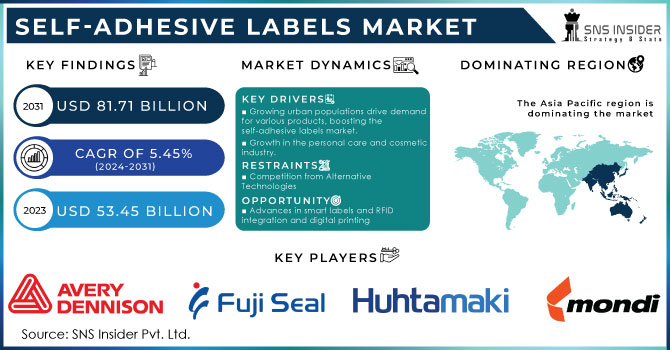
The Self-Adhesive Labels Market size was USD 53.45 billion in 2023 and is expected to Reach USD 81.71 billion by 2031 and grow at a CAGR of 5.45% over the forecast period of 2024-2031.
The aesthetic characteristics of some food and beverage packaging brands have been shown to be improved by using self-adhesive labels. In the sale of products packaging and labelling plays a significant role, since they help to attract consumers attention. For the marketing of a product, they are mainly used for promotion to potential consumers. The labelling specifies the ways in which packages or products may be used, transported, recycled and disposed of.
In addition, the market for food packaging is estimated to reach around US$362 billion at the end of this year and USD 663.65 billion in 2030. The demand for self-adhesive labels is therefore expected to increase over the next few years due to an increasing food packaging market.
The total sales of retail and food service stores in the US amounted to USD 78.27 billion as at January 2023, stated by the United States Department of Commerce. On the other hand, the figure stood at USD 74.98 billion in January 2022. According to the latest figures, this represents a significant rise of around 4.39% which is expected to continue.
The Asia Pacific region was dominant and is expected to experience significant growth during the forecast period. In 2022, China's total exports of personal care and cosmetic products amounted to EUR 5.63 billion, increasing to EUR 4.85 billion in 2021. Compared to the previous year, there has been a growth of 16.08%.
According to ZEVI, the Asian electric market reached EUR 3.11 trillion USD 3.674 trillion USD in 2021, an increase of 10%. In 2022, the market saw an increase of 13% and is estimated to be growing by 7% in 2023. The Chinese market is bigger than that of all industrialized countries, even more so than a common market in every industrialised country. Furthermore, in 2022, the Chinese electronics industry increased by 14% and is forecast to increase by 8% between now and 2023.
MARKET DYNAMICS
KEY DRIVERS:
-
The growing urban populations are stimulating demand for different products, leading to growth in the self-adhesive labels market
Urbanization has led to a greater demand for packaged goods, which emphasizes the role of packaging in labelling, dissemination of information and compliance with legislation, thus contributing to market growth. The total APAC population is projected to be around 5.2 billion by 2050. Out of which 60 % will be the urban population. This increase in standard of living is rising the demand for self-adhesive labels market.
-
Growth in the personal care and cosmetic industry.
RESTRAIN:
-
Competition from Alternative Technologies
Traditional self-adhesive labels are facing challenges due to the emergence of Digital Displays, Smart Packaging and Direct Printing.
OPPORTUNITY:
-
Advances in smart labels and RFID integration and digital printing
In order to provide enhanced monitoring, authentication and inventory management in industries such as logistics and retail, RFID technology should be integrated on labels. Use of digital printing technologies that allow for faster, more efficient label customization, shorter production runs and variable data print.
CHALLENGES:
-
Regulatory compliance complexity and cost pressures as a barrier to the self-adhesive label market
Labelers and their customers face a challenge in finding the way to navigate an increasingly diverse set of labelling rules within industries and regions. Small businesses may find it difficult to enter the market because of heavy costs associated with advances in Label Printing Technology, Materials and Regulatory Compliance.
IMPACT OF RUSSIAN UKRAINE WAR:
The Russia Ukraine war is expected to have a significant impact on the market for self-adhesive labels. Supply chains have been disrupted, prices for raw materials increased and market uncertainty has arisen due to the war. However, this growth will be slowed down by 1.5% as a result of the war. The war has disrupted the supply chains of self-adhesive labels in various ways. Firstly, for self-adhesive label material such as paper, plastic and glues, the biggest producers are Russia and Ukraine. The war has made them more costly, which is causing pressure for the manufacturers of labels. The main transit points of goods between Asia and Europe are Russia and Ukraine. A number of roads and railway lines have been closed throughout the region as a result of the war. It is now more costly to move goods by road or rail. In 2023, Central & Eastern Europe's advertising spending will decline by 22.8%. There's been a 5% increase in the price of plastics, due to the rise in prices of crude oil and petroleum as well as natural gas and energy. The price of paper went up by 10% because of the war.
IMPACT OF ONGOING RECESSION:
The downturn is expected to have an adverse impact on the market for self-adhesive labels. The recession is forcing companies to reduce costs, which could have a negative impact on the demand for self-adhesive labels. However, this growth is expected to be reduced by 1.5% in the course of the recession. For the purpose of saving money, companies may delay or cancel orders for self-adhesive labels. Businesses may, for example, replace the self-adhesive label with less expensive alternatives such as paper or plastic labels. According to a survey carried out by the National Retail Federation, 70% of retailers plan to reduce their marketing budgets in 2023. In June 2023, the Conference Board's Consumer Confidence Index declined to 98.7 , which was its lowest level since February 2020. In June 2023, the US unemployment rate has risen to 3.6%, its highest level since April 2020.
KEY MARKET SEGMENTS
By Type
-
Linerless
-
Release Liner
By Nature
-
Repositionable
-
Permanent
-
Removable
By Printing Technology
-
Digital Printing
-
Screen Printing
-
Flexography
-
Gravure
-
Offset
-
Lithography
-
Letterpress
By Application
-
Food & Beverages
-
Pharmaceuticals
-
Retail Labels
-
Consumer Durables
-
E-commerce
-
Others
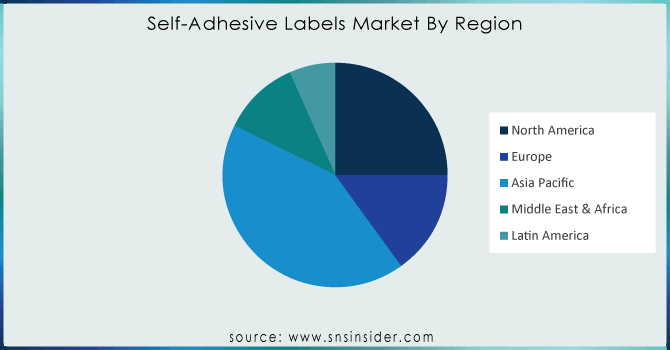
REGIONAL ANALYSIS
Asia Pacific dominates the global self-adhesive labels market and is expected to continue its dominance over the forecast period. As a result of availability of raw materials in the area, Asia Pacific is expected to be the fastest growing region during the forecast period. Given the availability of materials such as plastic films, paper, adhesives and others, growth in a regional market is likely to be supported by an increase in production activity in China and India. In addition, populous countries in the Asia-Pacific region, such as China, India, and Japan, have large customer bases in FMCG, food and beverage, and retail industries.
The most rapid growth is projected in North America during the forecast period. The reason for the market's further growth is that there is a high concentration of manufacturing in this region, as well as an increasing e commerce sector. Moreover, the demand for consumer products is expected to grow as a result of increased purchasing power which will also drive growth in the self-adhesive label market. The demand for FMCG, convenience food and beverages are increasing considerably as a result of the fast-evolving lifestyles of workers. The United States saw an increase in online retail sales from $698 billion in 2021 to $891.7 billion in 2022, according to the UNCTAD Conference on Trade and Development. Developments have a very significant impact on market growth. In this region, e-commerce plays an important role.
Get Customized Report as per Your Business Requirement - Request For Customized Report
REGIONAL COVERAGE:
North America
-
US
-
Canada
-
Mexico
Europe
-
Eastern Europe
-
Poland
-
Romania
-
Hungary
-
Turkey
-
Rest of Eastern Europe
-
-
Western Europe
-
Germany
-
France
-
UK
-
Italy
-
Spain
-
Netherlands
-
Switzerland
-
Austria
-
Rest of Western Europe
-
Asia Pacific
-
China
-
India
-
Japan
-
South Korea
-
Vietnam
-
Singapore
-
Australia
-
Rest of Asia Pacific
Middle East & Africa
-
Middle East
-
UAE
-
Egypt
-
Saudi Arabia
-
Qatar
-
Rest of Middle East
-
-
Africa
-
Nigeria
-
South Africa
-
Rest of Africa
-
Latin America
-
Brazil
-
Argentina
-
Colombia
-
Rest of Latin America
Key Players
Some major key players in the Self-Adhesive Labels market are Avery Dennison Corporation, 3M Company, CCL Industries, Fuji Seal International, Multi-Color Corporation, Mondi Group, MULTIVAC, Huhtamaki Oyj, Coveris Holdings, Asteria Group and other players.
RECENT DEVELOPMENT
-
Avery Dennison labelling and packaging materials is launching direct thermal DT linerless label platform for variable information labels used in e.g., online shopping, food deliveries & pick-ups, quick serving restaurants, weighing scales & weighing; transport and logistics applications.
-
The new packaging and labelling solutions that MULTIVAC Marketing & Inspection has developed for the reduction of plastic in fruit and vegetables were launched as Top Wrap and Top Close.
| Report Attributes | Details |
| Market Size in 2023 | US$ 53.45 Bn |
| Market Size by 2031 | US$ 81.71 Bn |
| CAGR | CAGR of 5.45 % From 2024 to 2031 |
| Base Year | 2023 |
| Forecast Period | 2024-2031 |
| Historical Data | 2020-2022 |
| Report Scope & Coverage | Market Size, Segments Analysis, Competitive Landscape, Regional Analysis, DROC & SWOT Analysis, Forecast Outlook |
| Key Segments | • by Type (Linerless, Release Liner) • by Nature (Repositionable, Permanent, Removable) • by Printing Technology (Digital Printing, Screen Printing, Flexography, Gravure, Offset, Lithography, Letterpress) • by Application (Food & Beverages, Pharmaceuticals, Retail Labels, Consumer Durables, E-commerce, Others) |
| Regional Analysis/Coverage | North America (US, Canada, Mexico), Europe (Eastern Europe [Poland, Romania, Hungary, Turkey, Rest of Eastern Europe] Western Europe] Germany, France, UK, Italy, Spain, Netherlands, Switzerland, Austria, Rest of Western Europe]), Asia Pacific (China, India, Japan, South Korea, Vietnam, Singapore, Australia, Rest of Asia Pacific), Middle East & Africa (Middle East [UAE, Egypt, Saudi Arabia, Qatar, Rest of Middle East], Africa [Nigeria, South Africa, Rest of Africa], Latin America (Brazil, Argentina, Colombia Rest of Latin America) |
| Company Profiles | Avery Dennison Corporation, 3M Company, CCL Industries, Fuji Seal International, Multi-Color Corporation, Mondi Group, MULTIVAC, Huhtamaki Oyj, Coveris Holdings, Asteria Group |
| Key Drivers | • The growing urban populations are stimulating demand for different products, leading to growth in the self-adhesive labels market • Growth in the personal care and cosmetic industry |
| Market Challenges | • Regulatory compliance complexity and cost pressures as a barrier to the self-adhesive label market |
Frequently Asked Questions
Ans. The growing urban populations are stimulating demand for different products, leading to growth in the self-adhesive labels market.
Ans. The major key players are Avery Dennison Corporation, 3M Company, CCL Industries, Huhtamaki Oyj.
Ans. Asia Pacific is the dominating and the fastest growing region for the Self-Adhesive Labels Market.
Ans. USD 81.71 Billion is the projected Self-Adhesive Labels market size of market by 2031.
Ans. The Compound Annual Growth rate for Self-Adhesive Labels Market over the forecast period is 5.45 %.
Get in Touch
