Sensormatic Labels Market Report Scope & Overview:
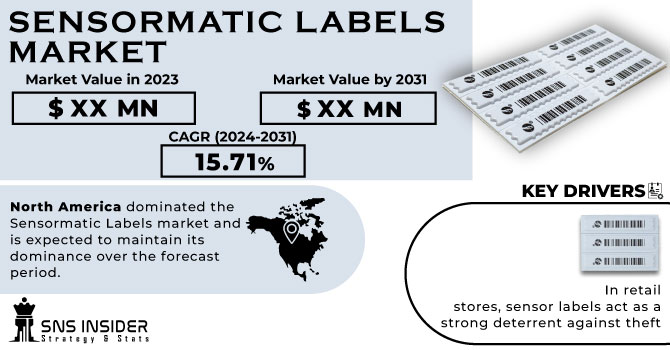
The Sensormatic Labels Market is expected to grow at a CAGR of 15.71% over the forecast period of 2024-2031.
Sensormatic Labels and tags aim to help retailers and shops fight shoplifters and thieves. The labels work with radio frequency retail systems and protect hard-to-tag items, packaged goods, cosmetics, pharmaceuticals, and more.
Get More Information on Sensormatic Labels Market - Request Sample Report
The main factor accelerating market growth in Sensormatic Labels is an increase in demand for fast moving consumer goods. The growth of the Sensormatic Labels market is also expected to be stimulated by increased production and proper inventory management, a rising number of investments in developing advanced and technical products, adoption of radio frequency identification tags and electronic article surveillance technology.
The Sensormatic Labels market is being hampered by growing preference for conventional barcode and label printing among manufacturers of small-scale industries, which will limit the growth of this market in comparison to laser printers that are more expensive. Moreover, the Sensormatic Labels label market will have ample opportunity to grow as a result of increasing demand from different sectors.
MARKET DYNAMICS
KEY DRIVERS:
-
In retail stores, sensor labels act as a strong deterrent against theft
Retailers are investing in these labels for protection of their goods, reducing shrinkage and minimising losses caused by theft.
-
The demand for Sensormatic Labels is increasing in order to secure a growing number of stores and goods due to the expansion of retail chains both at home and abroad.
RESTRAIN:
-
False alarm and inconvenience to customers
Customers may be inconvenienced and have negative shopping experiences, due to false alarms which arise from Sensormatic Labels. The key is to strike the right balance of security with minimising inconvenience.
OPPORTUNITY:
-
Advances in the Technology of Sensormatic Labelling
The opportunities to enhance detection capacity, increase data accuracy and facilitate the integration of retail systems are presented by continuing innovation in sensor labelling technology such as RFID Nearmatic labels or NFCNFC Field Communication technologies.
-
An opportunity to take advantage of a significant part of the retail market is provided by offering tailor made cost effective Sensormatic Labels solutions and packages for SMEs which may be subject to budgetary constraints.
CHALLENGES:
-
In order to preserve the integrity and security of shopping environments, it is vital that sensorial labelling systems be protected from cyber threats such as attempted hackers or data breaches.
IMPACT OF RUSSIAN UKRAINE WAR
The war damaged the supply lines, leading to higher prices for raw materials like paper and adhesives. Paper prices have increased by 10% since the beginning of the war. Adhesive prices have gone up by 5% since the beginning of the war. By now, the paper imports had risen to more than INR 1 00,000 per tonne, which had been priced at around INR 70,000 per tonne before the war. The cost of the Sensormatic Labels label has increased by 3% since the beginning of the war.
As a result of the sanctions imposed on Russia, Europe could fall into recession, leading to reduced demand for Sensormatic Labels packaging. Eastern Europe's largest markets for Sensormatic Labels are Russia and Ukraine. Due to the war, there was a steep drop in demand from those countries due to business closures and cutbacks.
IMPACT OF ONGOING RECESSION
The ongoing recession is expected to have a negative impact on this growth of Sensormatic Labels. The recession may also lead to an increase in the cost of doing business, thus making it more difficult for firms to raise their Sensormatic Labels Labelling expenditure.
The effect of the recession will vary between Sensormatic Labels labelling markets, depending on the region. Consequently, it is expected that North American markets will have a larger effect compared to the Asia Pacific. For example, the North American region has been more advanced and consumer spending is higher.
KEY MARKET SEGMENTS
By Labelling
-
RFID Labels
-
Sensing Labels
-
EAS Labels
-
Others
By Printing Technology
-
Digital
-
Flexographic
-
Others
By Application
-
Logistics
-
Retail
-
Healthcare & Pharmaceuticals
-
Food & Beverage
-
Cosmetic & Personal Care
-
Others
REGIONAL ANALYSIS:
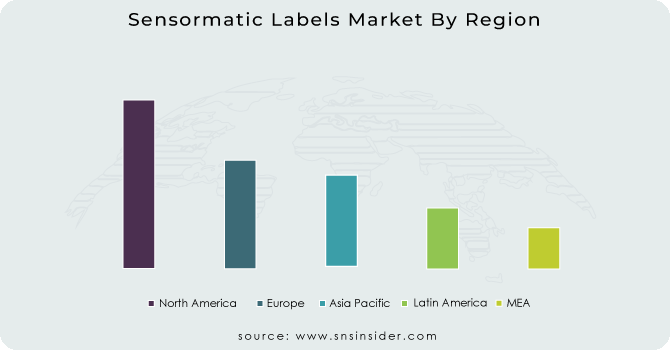
As a result of the fast demand from retail and logistics industry in this region, North America dominated the Sensormatic Labels market and is expected to maintain its dominance over the forecast period. In this region, increasing retail and logistics sectors are demanding efficient tracking solutions to drive demand for sensor labels. According to the USA grocery manufacturer's association, by 2023, 80% of foods and beverages, pet food, personal care or household goods would have a Smart Label.
However, the increase in demand from end user industries as well as growing labelling and packaging sectors will lead to Asia Pacific registering highest growth rates for this period.
To Get Customized Report as per your Business Requirement - Request For Customized Report
REGIONAL COVERAGE:
North America
-
US
-
Canada
-
Mexico
Europe
-
Eastern Europe
-
Poland
-
Romania
-
Hungary
-
Turkey
-
Rest of Eastern Europe
-
-
Western Europe
-
Germany
-
France
-
UK
-
Italy
-
Spain
-
Netherlands
-
Switzerland
-
Austria
-
Rest of Western Europe
-
Asia Pacific
-
China
-
India
-
Japan
-
South Korea
-
Vietnam
-
Singapore
-
Australia
-
Rest of Asia Pacific
Middle East & Africa
-
Middle East
-
UAE
-
Egypt
-
Saudi Arabia
-
Qatar
-
Rest of Middle East
-
-
Africa
-
Nigeria
-
South Africa
-
Rest of Africa
-
Latin America
-
Brazil
-
Argentina
-
Colombia
-
Rest of Latin America
Key Players
Some major key players in the Sensormatic Labels market are Johnson Controls, CCL Industries Inc, Custom Security Industries Inc, Avery Dennison Corporation, Honeywell International Inc, Star Label Products, Watson Label Products, MEGA FORTRIS GROUP, ALL-TAG Corporation, Henkel Adhesives Technologies India Private Limited and other players.
Custom Security Industries Inc-Company Financial Analysis
RECENT DEVELOPMENT
-
A new acousto magnetic metal label designed to protect high risk products such as cookware, canned food, power tools and more has been recently introduced by Sensormatic Labels Solutions in the global retail solutions portfolio of Johnson Controls.
| Report Attributes | Details |
| CAGR | CAGR of 15.71% From 2024 to 2031 |
| Base Year | 2023 |
| Forecast Period | 2024-2031 |
| Historical Data | 2020-2022 |
| Report Scope & Coverage | Market Size, Segments Analysis, Competitive Landscape, Regional Analysis, DROC & SWOT Analysis, Forecast Outlook |
| Key Segments | • by Labelling (RFID Labels, Sensing Labels, EAS Labels, Others) • by Printing Technology (Digital, Flexographic, Others) • by End Use (Logistics, Retail, Healthcare & Pharmaceuticals, Food & Beverage, Cosmetic & Personal Care, Others) |
| Regional Analysis/Coverage | North America (US, Canada, Mexico), Europe (Eastern Europe [Poland, Romania, Hungary, Turkey, Rest of Eastern Europe] Western Europe] Germany, France, UK, Italy, Spain, Netherlands, Switzerland, Austria, Rest of Western Europe]), Asia Pacific (China, India, Japan, South Korea, Vietnam, Singapore, Australia, Rest of Asia Pacific), Middle East & Africa (Middle East [UAE, Egypt, Saudi Arabia, Qatar, Rest of Middle East], Africa [Nigeria, South Africa, Rest of Africa], Latin America (Brazil, Argentina, Colombia Rest of Latin America) |
| Company Profiles | Johnson Controls, CCL Industries Inc, Custom Security Industries Inc, Avery Dennison Corporation, Honeywell International Inc, Star Label Products, Watson Label Products, MEGA FORTRIS GROUP, ALL-TAG Corporation, Henkel Adhesives Technologies India Private Limited |
| Key Drivers | • In retail stores, sensor labels act as a strong deterrent against theft • The demand for Sensormatic Labels is increasing in order to secure a growing number of stores and goods due to the expansion of retail chains both at home and abroad. |
| Key Opportunities | • Advances in the Technology of Sensormatic Labelling • An opportunity to take advantage of a significant part of the retail market is provided by offering tailor made cost effective Sensormatic Labels solutions and packages for SMEs which may be subject to budgetary constraints. |
Frequently Asked Questions
Ans: North America dominated the Sensormatic Labels market and is expected to maintain its dominance over the forecast period.
Ans: False alarm and inconvenience to customers can hinder the market growth.
Ans: The demand for Sensormatic Labels is increasing in order to secure a growing number of stores and goods due to the expansion of retail chains both at home and abroad.
Ans: Advances in the Technology of Sensormatic Labels can provide growth opportunities for the market.
Ans: The Sensormatic Labels Market is expected to grow at a CAGR of 15.10 %.
Get in Touch
