Returnable Packaging Market Key Insights:
Get PDF Sample Copy of Returnable Packaging Market - Request Sample Report
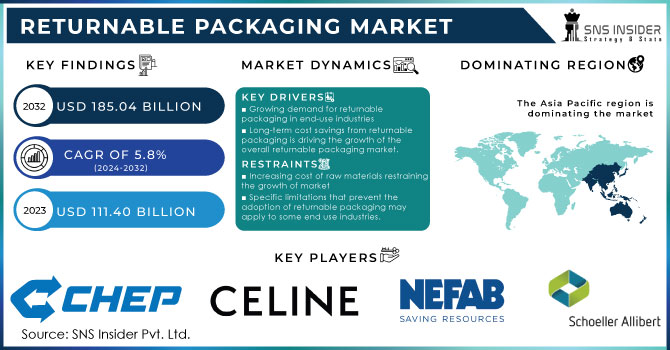
The Returnable Packaging Market size was valued at USD 111.40 billion in 2023 and is expected to Reach USD 185.04 billion by 2032 and grow at a CAGR of 5.8 % over the forecast period of 2024-2032.
The rising demand for robust and long-lasting material handling solutions is anticipated to drive growth in the global market for returnable packaging. Returnable packaging reduces the amount of packaging waste that ends up in landfills and is therefore very environmentally friendly. Market growth is anticipated to be fuelled by end-users growing adoption of green packaging solutions to enhance their brand reputation and by increasing regulatory pressure regarding the use of flexible plastic packaging. With a strong cold storage chain network all over the continent, North America has a thriving food and beverage industry.
Returnable plastic pallets are preferred over single-use wood pallets for the transportation of food and beverages products throughout the cold chain network because, when exposed to moisture, wood pallets are more likely to encourage bacterial and fungal growth. Therefore, increased food and beverage movement throughout the cold chain is anticipated to be advantageous for the local reusable packaging market. As more businesses come to understand the advantages of using sustainable packaging options, there is a rapid rise in the trend toward recyclable packaging in North America. Several factors, such as growing environmental awareness, increasing demand for eco-friendly packaging options, and government initiatives to support sustainable development, are behind this trend.
The use of robust materials, like plastic, metal, and wood, that can be reused numerous times before being recycled or disposed of, is one of the main trends in returnable packaging. In place of single-use packaging, which creates a lot of waste and is bad for the environment, these materials offer a more affordable and environmentally responsible option.
Additionally, returning pallets has a number of benefits, such as less waste, greater effectiveness, and cost savings. As a result, more businesses are incorporating these pallets into their supply chain management procedures. Using returnable pallets, companies can achieve sustainability goals and lessen their damaging environmental impact.
MARKET DYNAMICS
KEY DRIVERS:
-
Growing demand for returnable packaging in end-use industries
Different industries searching for affordable and sustainable solutions are the ones driving the demand for returnable packaging. Returnable packaging is being adopted by a variety of industries, including those in the automotive, retail, consumer goods, food and beverage, pharmaceutical, manufacturing, e-commerce, agriculture, electronics, and more, in order to improve product protection, reduce waste, and optimize logistics.
-
Long-term cost savings from returnable packaging is driving the growth of the overall returnable packaging market.
RESTRAIN:
-
Increasing cost of raw materials restraining the growth of market
During the forecast period the prices of raw materials and energy will increase. The increased raw materials prices will affect the growth of market and affect the value chain, resulting in rise of operation cost.
-
Specific limitations that prevent the adoption of returnable packaging may apply to some end use industries.
OPPORTUNITY:
-
The development of technology opens up possibilities for returnable packaging system optimization
Supply chain management software, Internet of Things (IoT) sensors, RFID tracking, data analytics, and other technologies can be integrated to provide real-time visibility, asset tracking, and improved decision-making capabilities, which can improve operational effectiveness and customer satisfaction.
-
Returnable packaging has lots of opportunities for innovation in terms of both functionality and design.
CHALLENGES:
-
Varying environmental laws and regulations across different regions
The environmental laws and policies governing packaging waste and sustainability can vary greatly from one nation to the next. Due to the need to navigate and adhere to various sets of regulations, businesses that operate across multiple regions or engage in international trade are made more difficult.
IMPACT OF RUSSIAN-UKRAINE WAR
According to the European Federation of Wooden Pallet and Packaging Manufacturers, there will be pressure on the supply of wooden pallets and packaging as the conflict in Ukraine affects the supply of wood.
The organization, which represents manufacturers in the EU and the UK, expressed "deep sympathies and support for the people of Ukraine," saying the virtual shutdown of the Ukrainian economy would have "serious direct impacts on countries like Hungary, Italy, and Germany and an indirect impact across Europe by unbalancing the market, increasing competition for more limited wood supplies, and putting upward pressure
More than 215 million m3 of sawn softwood timber was exported from Ukraine last year, a large portion of which went toward the production of wooden pallets and packaging for use in countries like France, Germany, Italy, the Netherlands, and Poland. An estimated 16 million pallets were also produced and exported, mostly to Europe.
While Belarus exports about 3 mm3 and Russia exports about 4.3mm3 of softwood lumber to the EU, respectively, the trade sanctions that have been put in place against the two nations will have a significant effect on Europe. .
Up to 25% of the pallet and packaging wood used in some nations comes from these three nations. Alternative timber sources, such as those in Germany, the Baltic States, and Scandinavia, can only make up a small portion of the deficit.
The conflict has also significantly disrupted energy supplies, resulting in a more than 35% increase in the price of gasoline and a barrel of oil now costing more than US$100. According to FEFPEB, this would have a significant impact on production costs as a whole, resulting in inevitably higher prices.
IMPACT OF ONGOING RECESSION
Packaging needs will decline due to the recession, and the shutdown will cause paper waste to start going to landfills.
Gas prices have an impact on European paper mills. However, the lack of orders for finished goods is currently the main issue. This is a result of the economy's slowdown and expectations that a severe economic crisis will cause demand for packaging to fall precipitously. There were still warehouses that were overstocked due to the expectation of high demand.
Supply chain optimization efforts may prioritize the use of returnable packaging to enhance efficiency and minimize waste.
KEY MARKET SEGMENTATION
By Raw Material
-
Wood
-
Metal
-
Plastic
By Product Type
-
Crates
-
IBCs
-
Dunnage
-
Pallets
-
Barrels & Drums
-
Others
By Application
-
Food & Beverage
-
Healthcare
-
Automotive
-
Others
REGIONAL ANALYSIS
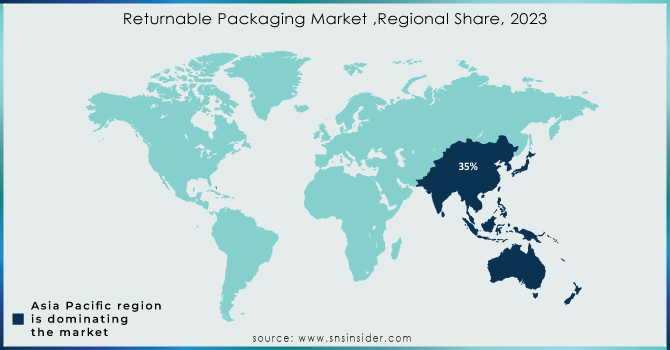
Due to the region's rapidly expanding manufacturing sector, particularly in nations like India, China, and Japan, Asia Pacific held a market share of over 35% in the regional segment in 2023. Furthermore, the region has a very high availability of raw materials like metal and plastic.
China produces 35% of the world's plastic, which is advantageous to manufacturers in terms of the cost and accessibility of raw materials. The largest importer and exporter of food, drink, and agri-food products, China is a significant economy in the Asia Pacific market for returnable packaging, with a share expected to reach over 45% in 2023.
Considering the size of the pharmaceutical, food and beverage, and automotive industries in the US, North America held the second-largest market share with over 28 % in 2023. The segment's largest share in 2022 is primarily attributable to the robustness, affordability, and lightweight of reusable packaging containers made of plastic. Further fuelling the market expansion is the regional trend toward recyclable packaging, which is accelerating as more businesses come to understand the advantages of using eco-friendly packaging options.
Get Customized Report as per Your Business Requiremrnt - Enquiry Now
REGIONAL COVERAGE
North America
-
USA
-
Canada
-
Mexico
Europe
-
Germany
-
UK
-
France
-
Italy
-
Spain
-
The Netherlands
-
Rest of Europe
Asia-Pacific
-
Japan
-
South Korea
-
China
-
India
-
Australia
-
Rest of Asia-Pacific
The Middle East & Africa
-
Israel
-
UAE
-
South Africa
-
Rest of the Middle East & Africa
Latin America
-
Brazil
-
Argentina
-
Rest of Latin American
Key Players:
Some major key players in the Returnable packaging market are Schoeller Allibert, CHEP, NEFAB GROUP, Celina, RPP Containers, Amatech Inc, UBEECO Packaging Solutions, PPS Midlands Limited, RPR Inc, Tri-pack Packaging Systems Ltd, and other players.
RECENT DEVELOPMENTS
-
McDonald, Fast food giant McDonald's has partnered with logistics and supply chain firm Havi, and Burger King's rival is working with reusable packaging initiative Recup to create national deposit systems for reusable cups in Germany.
-
Nestle, Food giant Nestlé is experimenting with using reusable stainless steel containers for its Nesquik cocoa brand in Germany. These containers were rented from start-up Circolution.
| Report Attributes | Details |
| Market Size in 2023 | US$ 111.40 Bn |
| Market Size by 2032 | US$ 185.04 Bn |
| CAGR | CAGR of 5.8% From 2024 to 2032 |
| Base Year | 2023 |
| Forecast Period | 2024-2032 |
| Historical Data | 2020-2022 |
| Report Scope & Coverage | Market Size, Segments Analysis, Competitive Landscape, Regional Analysis, DROC & SWOT Analysis, Forecast Outlook |
| Key Segments | • by Raw Material (Wood, Metal, Plastic) • by Product Type (Crates, IBCs, Dunnage, Pallets, Barrels & Drums, Others) • by Application (Food & Beverage, Healthcare, Automotive, Others) |
| Regional Analysis/Coverage | North America (USA, Canada, Mexico), Europe (Germany, UK, France, Italy, Spain, Netherlands, Rest of Europe), Asia-Pacific (Japan, South Korea, China, India, Australia, Rest of Asia-Pacific), The Middle East & Africa (Israel, UAE, South Africa, Rest of Middle East & Africa), Latin America (Brazil, Argentina, Rest of Latin America) |
| Company Profiles | Schoeller Allibert, CHEP, NEFAB GROUP, Celina, RPP Containers, Amatech Inc, UBEECO Packaging Solutions, PPS Midlands Limited, RPR Inc, Tri-pack Packaging Systems Ltd |
| Key Drivers | • Growing demand for returnable packaging in end-use industries • Long-term cost savings from returnable packaging is driving the growth of the overall returnable packaging market. |
| Market Opportunities | • The development of technology opens up possibilities for returnable packaging system optimization • Returnable packaging has lots of opportunities for innovation in terms of both functionality and design. |
Frequently Asked Questions
Ans: Asia Pacific held a market share of over 35% in the regional segment in 2023 and will continue to dominate the market.
Ans: Some major key players in the Returnable packaging market are Schoeller Allibert, CHEP, NEFAB GROUP, Celina, RPP Containers, Amatech Inc, UBEECO Packaging Solutions, PPS Midlands Limited, RPR Inc, Tri-pack Packaging Systems Ltd.
Ans: Growing demand for returnable packaging in end-use industries.
Ans: The Returnable Packaging Market size was USD 111.40 Bn in 2023 and is expected to Reach USD 185.04 Bn by 2032.
Ans: Returnable Packaging Market is expected to grow at a CAGR of 5.8% over the forecast period of 2024-2032.
Get in Touch
