Silica Market Report Scope & Overview:
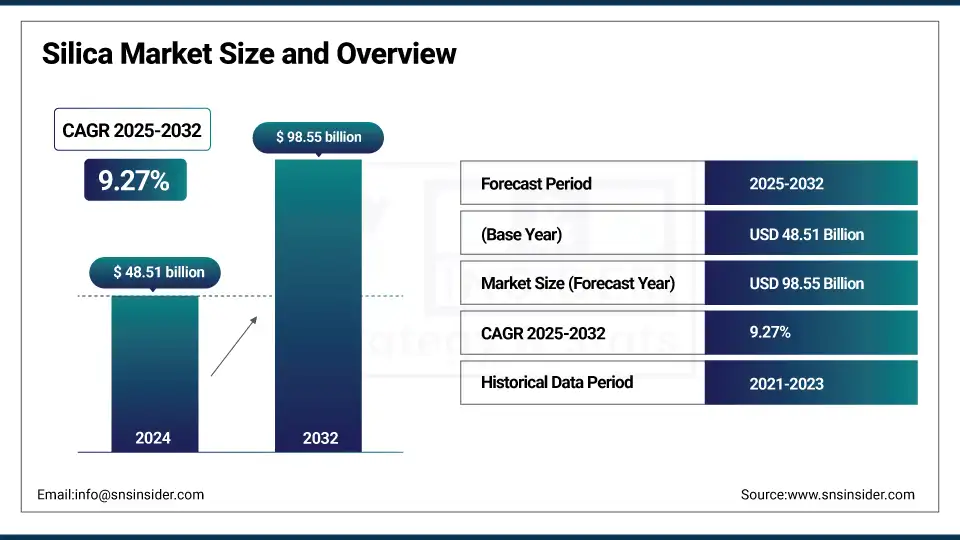
The Silica market size was valued at USD 48.51 billion in 2024 and is expected to reach USD 98.55 billion by 2032, growing at a CAGR of 9.27% over the forecast period of 2025-2032.

Strong growth of the silica market is owing to the increased demand for industrial silica in hydraulic fracturing and a surge in the use of silica applications across the glass and ceramics industry. Green tire and lightweight composite sustainability initiatives are further molding silica market outlook, while innovations in electronics and 3D printing are reinforcing the silica market size. Silica companies are concentrating on innovation and expansion of production capacity to increase their silica market share and silica market size overall.

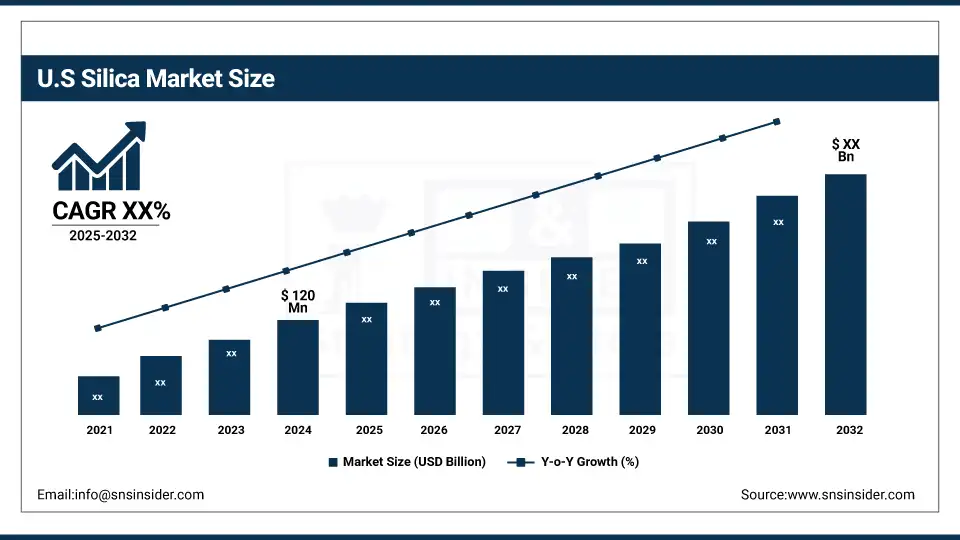
U.S. industrial silica consumption reached 120 million tons in 2023, an 11% increase over 2022, the U.S. Geological Survey reported. MSHA implemented tougher silica exposure standards in April 2024. It will also be increasing capacity for precipitated silica, in the amount of 50%, in Charleston, from 2026 on, which further confirming the on-going silica market assessment and strategy change made in the global silica market scene.

Market Dynamics:

Drivers:

  • Increasing hydraulic fracturing activities significantly boost industrial silica demand

Hydraulic fracturing continues to be one of the principal drivers of the silica market, as industrial silica is critical to the production of proppant used in hydraulic fracturing. Base on the U.S. Geological Survey, the apparent consumption of industrial sand and gravel (silica) in the U.S. reached 120 million tons in 2023, a rise of 11% on the year prior. This is because growth in the silica market largely operates on the energy activities of fracking, which in turn dictates silica market size and has even caused silica providers to increase silica production capabilities to meet energy market demands. This fashion indicates close positive relationship between energy exploitation and the usage of silica.

  • Rising demand for sustainable materials drives silica applications in green manufacturing

The silica market is in the midst of favoring sustainable materials including in the glass/ceramics industry and with green composites e.g. green tires. Industrial sand is primarily used in the production of glass which accounts for 26% of industrial sand use, while foundry sand has a much higher use of silica, specifically in cast iron and aluminum production. Silica suppliers are increasing production of their precipitated and colloidal silica to provide materials optimized for sustainability driven markets. This transition mirrors silica market dynamics that continue to evolve based on environmental drivers with resulting impact on product innovation and size of the silica market all around including automotive and construction.

Restraints:

  • Environmental and zoning restrictions limit expansion opportunities for silica production

Domestic zoning laws and environmental regulations limit the development of new silica mines in North America. The U.S. Geological Survey says some areas where silica sand is mined have imaging problems or land use restrictions because of local ecosystems and community opposition. BenToshi’s restrictions obstruct silica companies’ potential to expand industrial silica production and, as such, constrain the increase of the market size for silica and the pace of market share penetration into key geographies, such as the Midwest. This is a regulatory environment that will pose substantial barriers to any ramp up in future capacity.

Segmentation Analysis:

By Product

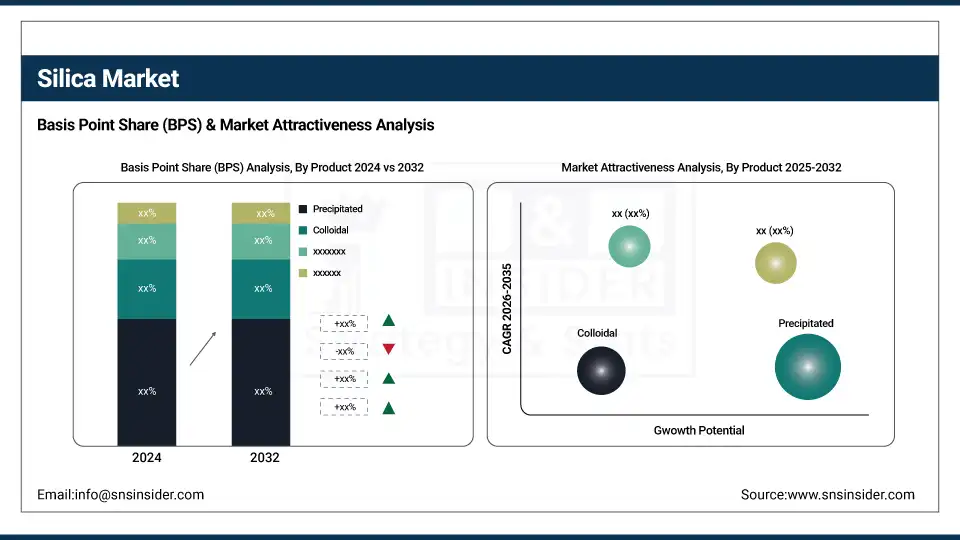
Precipitated silica held a 38% silica market share in 2024, making it the dominant product type, driven by its extensive use in green tires and oral care products. Evonik and PPG Industries have both expanded their precipitated silica manufacture considerably due to increasing demand in the automotive industry. Since silica improves rolling resistance, European Automobile Manufacturers Association The use of silica in tires allows fuel savings, and that goes to the ground of global warming. Such a move will significantly drive the silica market and will augment the demand for sustainable silica products.

Precipitated silica is projected to grow at a CAGR of 9.87% between 2025 and 2032, emerging as the fastest-growing segment. The demand is driven by its wide use in environmentally friendly tires, toothpaste and food defoamers. Silica companies like Solvay and Evonik are investing significant amounts to expand capacity in the face of green material demand. This is in line with the latest trends of silica and sustainability requirements that Europe and North America have been demanding, resulting in accelerating growth of the silica market and its application and usage in multiple sectors.

By Form

Crystalline silica dominated the silica market with a 53.5% share in 2024, primarily due to its use in the glass and ceramics industry. Flat glass, solar and container glass continue to drive demand for high-purity silica sand. An increase in industrial silica for solar glass is emphasized by the U.S. Geological Survey as a product of the Inflation Reduction Act. This extensive use, especially in clean energy infrastructure, is why crystalline silica’s market position continues, and the importance of the inclusion of crystalline silica for evaluating the silica market globally.

Amorphous silica is expected to grow at a CAGR of 9.39% from 2025 to 2032, driven by its expanding use in lithium-ion batteries, coatings, and 3D printing. Solvay and Wacker Chemie launch R&D into battery-grade amorphous silica materials. Worldwide production of electric vehicles is increasing and the need for safer, better performing additives is growing. This is indicative of a momentum in silica market trends toward advanced, functional for high-purity materials, driving growth in the silica market overall through new and sustainable silica application.

By End-use Industry

Glass manufacturing led the silica market in 2024 with a 32.4% market share, supported by strong demand for architectural glass and solar panel substrates. Silica is a key component of glass, and when used in high purity grades it provides optimal clarity and strength. The National Renewable Energy Laboratory found that more silica-based glass was needed as solar panel deployment skyrocketed. This demand surge underlines silica’s place in industrial silica applications and how it is more fundamental than other materials, in the rise of energy-efficient and renewable technologies.

Building and construction is projected to grow at a CAGR of 9.67% during 2025–2032, making it the fastest-growing end-use industry. Demand for silica-enhanced concrete, insulation panels, and lightweight mortars is rising due to green building mandates. According to the U.S. Department of Energy, federal projects increasingly use silica-based materials for thermal performance. This sector’s growth highlights changing silica market trends and underlines silica market share expansion across infrastructure projects promoting sustainability and energy efficiency in modern construction.

Regional Analysis:

North America held a 21.5% silica market share in 2024, driven by widespread use of industrial silica in hydraulic fracturing and specialty glass manufacturing. According to the U.S. Geological Survey, the U.S. consumed 120 million tons of industrial sand and gravel in 2023, with over 80% used for oil and gas fracking. The United States, led by states like Texas and Wisconsin, dominates regional production. These silica applications sustain silica market growth, supported by ongoing infrastructure upgrades and the growing glass and ceramics industry.

Europe accounted for a 24.3% silica market share during the 2025–2032 forecast period, propelled by eco-friendly infrastructure and strong demand in the glass and ceramics industry. Countries like Germany and France are advancing silica applications in architectural glass and insulation through EU Green Deal policies. Silica companies are scaling up sustainable production to meet emission reduction goals. This regional silica market growth aligns with Europe’s transition toward low-carbon construction, reinforced by stringent building regulations and a rising preference for industrial silica in energy-efficient materials.

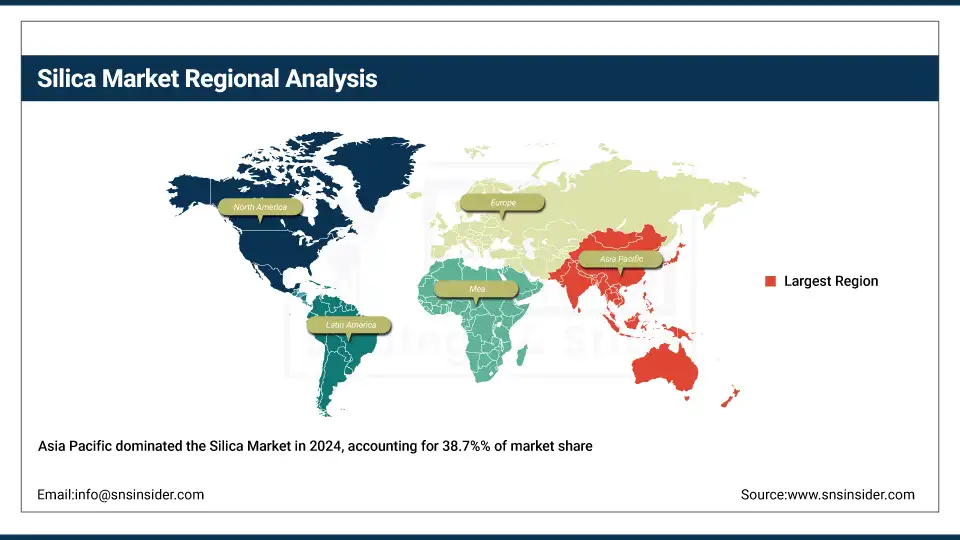
Asia Pacific dominated the silica market with a 38.7% share in 2024 and is the fastest-growing region through 2032 with the highest CAGR of 9.58%. China's dominance stems from massive glass production, solar panel exports, and electronics manufacturing, while India supports silica market growth via smart city projects and industrial infrastructure. Government-backed initiatives like China’s “New Infrastructure Plan” and India’s PMAY (Housing for All) fuel silica market trends. Asia Pacific’s expanding silica applications in solar glass and semiconductors continue to drive regional silica market size and industrial silica output.

Latin America is witnessing steady silica market growth, supported by Brazil and Argentina’s construction, agriculture, and glass industries. Local silica companies are increasing output for water filtration and lightweight glass applications, contributing to regional silica market share. Brazil’s construction sector, projected to expand under national housing programs like “Casa Verde e Amarela,” is encouraging silica applications in cement and tiles. Additionally, regional demand for agrochemical-grade silica is rising, reinforcing silica market trends across Latin America’s industrial silica landscape.

The Middle East & Africa is projected to be the fastest-growing silica market from 2025 to 2032, with increasing demand from construction and solar industries. Saudi Arabia’s NEOM project and the UAE’s clean energy expansion are boosting silica applications in smart glass and concrete. The region’s silica market analysis highlights government infrastructure investments and economic diversification efforts as key drivers. South Africa leads in quartz silica mining, supplying the local glass and ceramics industry. These factors collectively enhance silica market size and market share regionally.

Key Players:

The major silica market competitors include Evonik Industries AG, Wacker Chemie AG, PPG Industries Inc., Cabot Corporation, Imerys S.A., Solvay SA, W.R. Grace & Co., Sibelco, US Silica, and Madhu Silica Pvt. Ltd.

Recent Developments:

  • In December 2024, Mitsubishi Chemical Group expanded its synthetic silica powder capacity in Japan to support semiconductor packaging demand, incorporating automation and sustainability measures.

  • In November 2024, NGT directed CPCB to draft nationwide silica mining guidelines to address environmental concerns and regulate operations sustainably in states like Uttar Pradesh.

Silica Market Report Scope:

Report Attributes Details
Market Size in 2024 USD 48.51 billion
Market Size by 2032 USD 98.55 billion
CAGR CAGR of 9.27% From 2025 to 2032
Base Year 2024
Forecast Period 2025-2032
Historical Data 2021-2023
Report Scope & Coverage Market Size, Segments Analysis, Competitive Landscape, Regional Analysis, DROC & SWOT Analysis, Forecast Outlook
Key Segments •By Product (Fumed, Precipitated, Colloidal, Fused Silica, Silica Gel, Others)
•By Form (Amorphous, and Crystalline)
•By End-use Industry (Building & Construction, Oil & Gas, Glass Manufacturing, Water Treatment, and Others)
Regional Analysis/Coverage North America (US, Canada, Mexico), Europe (Germany, France, UK, Italy, Spain, Poland, Turkey, Rest of Europe), Asia Pacific (China, India, Japan, South Korea, Singapore, Australia, Rest of Asia Pacific), Middle East & Africa (UAE, Saudi Arabia, Qatar, South Africa, Rest of Middle East & Africa), Latin America (Brazil, Argentina, Rest of Latin America)
Company Profiles Evonik Industries AG, Wacker Chemie AG, PPG Industries Inc., Cabot Corporation, Imerys S.A., Solvay SA, W.R. Grace & Co., Sibelco, US Silica, and Madhu Silica Pvt. Ltd.

Table of Contents

1. Introduction

1.1 Market Definition

1.2 Scope (Inclusion and Exclusions)

1.3 Research Assumptions

2. Executive Summary

2.1 Market Overview

2.2 Regional Synopsis

2.3 Competitive Summary

3. Research Methodology

3.1 Top-Down Approach

3.2 Bottom-up Approach

3.3. Data Validation

3.4 Primary Interviews

4. Market Dynamics Impact Analysis

4.1 Market Driving Factors Analysis

4.1.1 Drivers

4.1.2 Restraints

4.1.3 Opportunities

4.1.4 Challenges

4.2 PESTLE Analysis

4.3 Porter’s Five Forces Model

5. Statistical Insights and Trends Reporting

5.1 Industrial Silica Consumption Trends, 2024

5.2 Export-Import Silica Flow Analysis, 2024

5.3 Regulatory Impact on Crystalline Silica

5.4 Investments in Silica Capacity Expansion

6. Competitive Landscape

6.1 List of Major Companies, By Region

6.2 Market Share Analysis, By Region

6.3 Product Benchmarking

6.3.1 Product specifications and features

6.3.2 Pricing

6.4 Strategic Initiatives

6.4.1 Marketing and promotional activities

6.4.2 Distribution and Supply Chain Strategies

6.4.3 Expansion plans and new Product launches

6.4.4 Strategic partnerships and collaborations

6.5 Technological Advancements

6.6 Market Positioning and Branding

7. Silica Market Segmentation by Product

7.1 Chapter Overview

      7.2 Fumed

7.2.1 Fumed Market Trends Analysis (2021-2032)

7.2.2 Fumed Market Size Estimates and Forecasts to 2032 (USD Billion)

7.3 Precipitated

     7.3.1 Precipitated Market Trends Analysis (2021-2032)

          7.3.2 Precipitated Market Size Estimates and Forecasts to 2032 (USD Billion)

      7.4 Colloidal

7.4.1 Colloidal Market Trends Analysis (2021-2032)

7.4.2 Colloidal Market Size Estimates and Forecasts to 2032 (USD Billion)

7.5 Fused Silica

     7.5.1 Fused Silica Market Trends Analysis (2021-2032)

          7.5.2 Fused Silica Market Size Estimates and Forecasts to 2032 (USD Billion)

      7.6 Silica Gel

7.6.1 Silica Gel Market Trends Analysis (2021-2032)

7.6.2 Silica Gel Market Size Estimates and Forecasts to 2032 (USD Billion)

7.7 Others

     7.7.1 Others Market Trends Analysis (2021-2032)

          7.7.2 Others Market Size Estimates and Forecasts to 2032 (USD Billion)

8. Silica Market Segmentation by Form

8.1 Chapter Overview

     8.2 Amorphous

            8.2.1 Amorphous Market Trend Analysis (2021-2032)

           8.2.2 Amorphous Market Size Estimates and Forecasts to 2032 (USD Billion)

8.3 Crystalline

      8.3.1 Crystalline Market Trends Analysis (2021-2032)

           8.3.2 Crystalline Market Size Estimates and Forecasts to 2032 (USD Billion)

9. Silica Market Segmentation by End-use Industry

9.1 Chapter Overview

9.2 Building & Construction

        9.2.1 Building & Construction Market Trends Analysis (2021-2032)

9.2.2 Building & Construction Market Size Estimates and Forecasts to 2032 (USD Billion)

9.3 Oil & Gas

        9.3.1 Oil & Gas Market Trends Analysis (2021-2032)

9.3.2 Oil & Gas Market Size Estimates and Forecasts to 2032 (USD Billion)

9.4 Glass Manufacturing

9.4.1 Glass Manufacturing Market Trends Analysis (2021-2032)

9.4.2 Glass Manufacturing Market Size Estimates and Forecasts to 2032 (USD Billion)

9.5 Water Treatment

9.5.1 Water Treatment Market Trends Analysis (2021-2032)

9.5.2 Water Treatment Market Size Estimates and Forecasts to 2032 (USD Billion)

9.6 Others

9.6.1 Others Market Trends Analysis (2021-2032)

9.6.2 Others Market Size Estimates and Forecasts to 2032 (USD Billion)

10. Regional Analysis

10.1 Chapter Overview

10.2 North America

10.2.1 Trends Analysis

10.2.2 North America Silica Market Estimates and Forecasts, by Country (2021-2032) (USD Billion)

10.2.3 North America Silica Market Estimates and Forecasts, by Product (2021-2032) (USD Billion) 

10.2.4 North America Silica Market Estimates and Forecasts, by Form (2021-2032) (USD Billion)

10.2.5 North America Silica Market Estimates and Forecasts, by End-use Industry (2021-2032) (USD Billion)

10.2.6 USA

10.2.6.1 USA Silica Market Estimates and Forecasts, by Product (2021-2032) (USD Billion)

10.2.6.2 USA Silica Market Estimates and Forecasts, by Form (2021-2032) (USD Billion)

10.2.6.3 USA Silica Market Estimates and Forecasts, by End-use Industry (2021-2032) (USD Billion)

10.2.7 Canada

10.2.7.1 Canada Silica Market Estimates and Forecasts, by Product (2021-2032) (USD Billion)

10.2.7.2 Canada Silica Market Estimates and Forecasts, by Form (2021-2032) (USD Billion)

10.2.7.3 Canada Silica Market Estimates and Forecasts, by End-use Industry (2021-2032) (USD Billion)

10.2.8 Mexico

10.2.8.1 Mexico Silica Market Estimates and Forecasts, by Product (2021-2032) (USD Billion)

10.2.8.2 Mexico Silica Market Estimates and Forecasts, by Form (2021-2032) (USD Billion)

10.2.8.3 Mexico Silica Market Estimates and Forecasts, by End-use Industry (2021-2032) (USD Billion)

10.3 Europe

10.3.1 Trends Analysis

10.3.2 Eastern Europe Silica Market Estimates and Forecasts, by Country (2021-2032) (USD Billion)

10.3.3 Eastern Europe Silica Market Estimates and Forecasts, by Product (2021-2032) (USD Billion) 

10.3.4 Eastern Europe Silica Market Estimates and Forecasts, by Form (2021-2032) (USD Billion)

10.3.5 Eastern Europe Silica Market Estimates and Forecasts, by End-use Industry (2021-2032) (USD Billion)

10.3.6 Germany

10.3.6.1 Germany Silica Market Estimates and Forecasts, by Product (2021-2032) (USD Billion)

10.3.6.2 Germany Silica Market Estimates and Forecasts, by Form (2021-2032) (USD Billion)

10.3.6.3 Germany Silica Market Estimates and Forecasts, by End-use Industry (2021-2032) (USD Billion)

10.3.7 France

10.3.7.1 France Silica Market Estimates and Forecasts, by Product (2021-2032) (USD Billion)

10.3.7.2 France Silica Market Estimates and Forecasts, by Form (2021-2032) (USD Billion)

10.3.7.3 France Silica Market Estimates and Forecasts, by End-use Industry (2021-2032) (USD Billion)

10.3.8 UK

10.3.8.1 UK Silica Market Estimates and Forecasts, by Product (2021-2032) (USD Billion)

10.3.8.2 UK Silica Market Estimates and Forecasts, by Form (2021-2032) (USD Billion)

10.3.8.3 UK Silica Market Estimates and Forecasts, by End-use Industry (2021-2032) (USD Billion)

10.3.9 Italy

10.3.9.1 Italy Silica Market Estimates and Forecasts, by Product (2021-2032) (USD Billion)

10.3.9.2 Italy Silica Market Estimates and Forecasts, by Form (2021-2032) (USD Billion)

10.3.9.3 Italy Silica Market Estimates and Forecasts, by End-use Industry (2021-2032) (USD Billion)

10.3.10 Spain

10.3.10.1 Spain Silica Market Estimates and Forecasts, by Product (2021-2032) (USD Billion)

10.3.10.2 Spain Silica Market Estimates and Forecasts, by Form (2021-2032) (USD Billion)

10.3.10.3 Spain Silica Market Estimates and Forecasts, by End-use Industry (2021-2032) (USD Billion)

10.3.11 Poland

10.3.11.1 Poland Silica Market Estimates and Forecasts, by Product (2021-2032) (USD Billion)

10.3.11.2 Poland Silica Market Estimates and Forecasts, by Form (2021-2032) (USD Billion)

10.3.11.3 Poland Silica Market Estimates and Forecasts, by End-use Industry (2021-2032) (USD Billion)

10.3.12 Turkey

10.3.12.1 Turkey Silica Market Estimates and Forecasts, by Product (2021-2032) (USD Billion)

10.3.12.2 Turkey Silica Market Estimates and Forecasts, by Form (2021-2032) (USD Billion)

10.3.12.3 Turkey Silica Market Estimates and Forecasts, by End-use Industry (2021-2032) (USD Billion)

10.3.13 Rest of Europe

10.3.13.1 Rest of Europe Silica Market Estimates and Forecasts, by Product (2021-2032) (USD Billion)

10.3.13.2 Rest of Europe Silica Market Estimates and Forecasts, by Form (2021-2032) (USD Billion)

10.3.13.3 Rest of Europe Silica Market Estimates and Forecasts, by End-use Industry (2021-2032) (USD Billion)

10.4 Asia Pacific

10.4.1 Trends Analysis

10.4.2 Asia Pacific Silica Market Estimates and Forecasts, by Country (2021-2032) (USD Billion)

10.4.3 Asia Pacific Silica Market Estimates and Forecasts, by Product (2021-2032) (USD Billion) 

10.4.4 Asia Pacific Silica Market Estimates and Forecasts, by Form (2021-2032) (USD Billion)

10.4.5 Asia Pacific Silica Market Estimates and Forecasts, by End-use Industry (2021-2032) (USD Billion)

10.4.6 China

10.4.6.1 China Silica Market Estimates and Forecasts, by Product (2021-2032) (USD Billion)

10.4.6.2 China Silica Market Estimates and Forecasts, by Form (2021-2032) (USD Billion)

10.4.6.3 China Silica Market Estimates and Forecasts, by End-use Industry (2021-2032) (USD Billion)

10.4.7 India

10.4.7.1 India Silica Market Estimates and Forecasts, by Product (2021-2032) (USD Billion)

10.4.7.2 India Silica Market Estimates and Forecasts, by Form (2021-2032) (USD Billion)

10.4.7.3 India Silica Market Estimates and Forecasts, by End-use Industry (2021-2032) (USD Billion)

10.4.8 Japan

10.4.8.1 Japan Silica Market Estimates and Forecasts, by Product (2021-2032) (USD Billion)

10.4.8.2 Japan Silica Market Estimates and Forecasts, by Form (2021-2032) (USD Billion)

10.4.8.3 Japan Silica Market Estimates and Forecasts, by End-use Industry (2021-2032) (USD Billion)

10.4.9 South Korea

10.4.9.1 South Korea Silica Market Estimates and Forecasts, by Product (2021-2032) (USD Billion)

10.4.9.2 South Korea Silica Market Estimates and Forecasts, by Form (2021-2032) (USD Billion)

10.4.9.3 South Korea Silica Market Estimates and Forecasts, by End-use Industry (2021-2032) (USD Billion)

10.4.10 Singapore

10.4.10.1 Singapore Silica Market Estimates and Forecasts, by Product (2021-2032) (USD Billion)

10.4.10.2 Singapore Silica Market Estimates and Forecasts, by Form (2021-2032) (USD Billion)

10.4.10.3 Singapore Silica Market Estimates and Forecasts, by End-use Industry (2021-2032) (USD Billion)

10.4.11 Australia

10.4.11.1 Australia Silica Market Estimates and Forecasts, by Product (2021-2032) (USD Billion)

10.4.11.2 Australia Silica Market Estimates and Forecasts, by Form (2021-2032) (USD Billion)

10.4.11.3 Australia Silica Market Estimates and Forecasts, by End-use Industry (2021-2032) (USD Billion)

10.4.12 Rest of Asia Pacific

10.4.12.1 Rest of Asia Pacific Silica Market Estimates and Forecasts, by Product (2021-2032) (USD Billion)

10.4.12.2 Rest of Asia Pacific Silica Market Estimates and Forecasts, by Form (2021-2032) (USD Billion)

10.4.12.3 Rest of Asia Pacific Silica Market Estimates and Forecasts, by End-use Industry (2021-2032) (USD Billion)

10.5 Middle East and Africa

10.5.1 Trends Analysis

10.5.2 Middle East Silica Market Estimates and Forecasts, by Country (2021-2032) (USD Billion)

10.5.3 Middle East Silica Market Estimates and Forecasts, by Product (2021-2032) (USD Billion) 

10.5.4 Middle East Silica Market Estimates and Forecasts, by Form (2021-2032) (USD Billion)

10.5.5 Middle East Silica Market Estimates and Forecasts, by End-use Industry (2021-2032) (USD Billion)

10.5.6 UAE

10.5.6.1 UAE Silica Market Estimates and Forecasts, by Product (2021-2032) (USD Billion)

10.5.6.2 UAE Silica Market Estimates and Forecasts, by Form (2021-2032) (USD Billion)

10.5.6.3 UAE Silica Market Estimates and Forecasts, by End-use Industry (2021-2032) (USD Billion)

10.5.7 Saudi Arabia

10.5.7.1 Saudi Arabia Silica Market Estimates and Forecasts, by Product (2021-2032) (USD Billion)

10.5.7.2 Saudi Arabia Silica Market Estimates and Forecasts, by Form (2021-2032) (USD Billion)

10.5.7.3 Saudi Arabia Silica Market Estimates and Forecasts, by End-use Industry (2021-2032) (USD Billion)

10.5.8 Qatar

10.5.8.1 Qatar Silica Market Estimates and Forecasts, by Product (2021-2032) (USD Billion)

10.5.8.2 Qatar Silica Market Estimates and Forecasts, by Form (2021-2032) (USD Billion)

10.5.8.3 Qatar Silica Market Estimates and Forecasts, by End-use Industry (2021-2032) (USD Billion)

10.5.9 South Africa

10.5.9.1 South Africa Silica Market Estimates and Forecasts, by Product (2021-2032) (USD Billion)

10.5.9.2 South Africa Silica Market Estimates and Forecasts by Form (2021-2032) (USD Billion)

10.5.9.3 South Africa Silica Market Estimates and Forecasts, by End-use Industry (2021-2032) (USD Billion)

10.5.10 Rest of Middle East & Africa

10.5.10.1 Rest of Middle East & Africa Silica Market Estimates and Forecasts, by Product (2021-2032) (USD Billion)

10.5.10.2 Rest of Middle East & Africa Silica Market Estimates and Forecasts, by Form (2021-2032) (USD Billion)

10.5.10.3 Rest of Middle East & Africa Silica Market Estimates and Forecasts, by End-use Industry (2021-2032) (USD Billion)

10.6 Latin America

10.6.1 Trends Analysis

10.6.2 Latin America Silica Market Estimates and Forecasts, by Country (2021-2032) (USD Billion)

10.6.3 Latin America Silica Market Estimates and Forecasts, by Product (2021-2032) (USD Billion) 

10.6.4 Latin America Silica Market Estimates and Forecasts, by Form (2021-2032) (USD Billion)

10.6.5 Latin America Silica Market Estimates and Forecasts, by End-use Industry (2021-2032) (USD Billion)

10.6.6 Brazil

10.6.6.1 Brazil Silica Market Estimates and Forecasts, by Product (2021-2032) (USD Billion)

10.6.6.2 Brazil Silica Market Estimates and Forecasts, by Form (2021-2032) (USD Billion)

10.6.6.3 Brazil Silica Market Estimates and Forecasts, by End-use Industry (2021-2032) (USD Billion)

10.6.7 Argentina

10.6.7.1 Argentina Silica Market Estimates and Forecasts, by Product (2021-2032) (USD Billion)

10.6.7.2 Argentina Silica Market Estimates and Forecasts, by Form (2021-2032) (USD Billion)

10.6.7.3 Argentina Silica Market Estimates and Forecasts, by End-use Industry (2021-2032) (USD Billion)

10.6.8 Rest of Latin America

10.6.8.1 Rest of Latin America Silica Market Estimates and Forecasts, by Product (2021-2032) (USD Billion)

10.6.8.2 Rest of Latin America Silica Market Estimates and Forecasts, by Form (2021-2032) (USD Billion)

10.6.8.3 Rest of Latin America Silica Market Estimates and Forecasts, by End-use Industry (2021-2032) (USD Billion)

11. Company Profiles

11.1 Evonik Industries AG

11.1.1 Company Overview

11.1.2 Financial

11.1.3 Product/ Services Offered

11.1.4 SWOT Analysis

11.2 Wacker Chemie AG

11.2.1 Company Overview

11.2.2 Financial

11.2.3 Product/ Services Offered

11.2.4 SWOT Analysis

11.3 PPG Industries Inc.

11.3.1 Company Overview

11.3.2 Financial

11.3.3 Product/ Services Offered

11.3.4 SWOT Analysis

11.4 Cabot Corporation

11.4.1 Company Overview

11.4.2 Financial

11.4.3 Product/ Services Offered

11.4.4 SWOT Analysis

11.5 Imerys S.A.

11.5.1 Company Overview

11.5.2 Financial

11.5.3 Product/ Services Offered

11.5.4 SWOT Analysis

11.6 Solvay SA

11.6.1 Company Overview

11.6.2 Financial

11.6.3 Product/ Services Offered

11.6.4 SWOT Analysis

11.7 W.R. Grace & Co.

11.7.1 Company Overview

11.7.2 Financial

11.7.3 Product/ Services Offered

11.7.4 SWOT Analysis

11.8 Sibelco

11.8.1 Company Overview

11.8.2 Financial

11.8.3 Product/ Services Offered

11.8.4 SWOT Analysis

11.9 US Silica

11.9.1 Company Overview

11.9.2 Financial

11.9.3 Product/ Services Offered

11.9.4 SWOT Analysis

11.10 Madhu Silica Pvt. Ltd.

11.10.1 Company Overview

11.10.2 Financial

11.10.3 Product/ Services Offered

11.10.4 SWOT Analysis

12. Use Cases and Best Practices

13. Conclusion

Key Segments: 

By Product

  • Fumed

  • Precipitated

  • Colloidal

  • Fused Silica

  • Silica Gel

  • Others

By Form

  • Amorphous

  • Crystalline

By End-use Industry

  • Building & Construction

  • Oil & Gas

  • Glass Manufacturing

  • Water Treatment

  • Others

Request for Segment Customization as per your Business Requirement: Segment Customization Request

Regional Coverage: 

North America

  • US

  • Canada

  • Mexico

Europe

  • Germany

  • France

  • UK

  • Italy

  • Spain

  • Poland

  • Turkey

  • Rest of Europe

Asia Pacific

  • China

  • India

  • Japan

  • South Korea

  • Singapore

  • Australia

  • Rest of Asia Pacific

Middle East & Africa

  • UAE

  • Saudi Arabia

  • Qatar

  • South Africa

  • Rest of Middle East & Africa

Latin America

  • Brazil

  • Argentina

  • Rest of Latin America

Request for Country Level Research Report: Country Level Customization Request

Available Customization 

With the given market data, SNS Insider offers customization as per the company’s specific needs. The following customization options are available for the report: 

  • Detailed Volume Analysis 

  • Criss-Cross segment analysis (e.g. Product X Application) 

  • Competitive Product Benchmarking 

  • Geographic Analysis 

  • Additional countries in any of the regions 

  • Customized Data Representation 

  • Detailed analysis and profiling of additional market players

An accurate research report requires proper strategizing as well as implementation. There are multiple factors involved in the completion of good and accurate research report and selecting the best methodology to compete the research is the toughest part. Since the research reports we provide play a crucial role in any company’s decision-making process, therefore we at SNS Insider always believe that we should choose the best method which gives us results closer to reality. This allows us to reach at a stage wherein we can provide our clients best and accurate investment to output ratio.

Each report that we prepare takes a timeframe of 350-400 business hours for production. Starting from the selection of titles through a couple of in-depth brain storming session to the final QC process before uploading our titles on our website we dedicate around 350 working hours. The titles are selected based on their current market cap and the foreseen CAGR and growth.


The 5 steps process:

Step 1: Secondary Research:

Secondary Research or Desk Research is as the name suggests is a research process wherein, we collect data through the readily available information. In this process we use various paid and unpaid databases which our team has access to and gather data through the same. This includes examining of listed companies’ annual reports, Journals, SEC filling etc. Apart from this our team has access to various associations across the globe across different industries. Lastly, we have exchange relationships with various university as well as individual libraries.

Secondary Research

Step 2: Primary Research

When we talk about primary research, it is a type of study in which the researchers collect relevant data samples directly, rather than relying on previously collected data.  This type of research is focused on gaining content specific facts that can be sued to solve specific problems. Since the collected data is fresh and first hand therefore it makes the study more accurate and genuine.

We at SNS Insider have divided Primary Research into 2 parts.

Part 1 wherein we interview the KOLs of major players as well as the upcoming ones across various geographic regions. This allows us to have their view over the market scenario and acts as an important tool to come closer to the accurate market numbers. As many as 45 paid and unpaid primary interviews are taken from both the demand and supply side of the industry to make sure we land at an accurate judgement and analysis of the market.

This step involves the triangulation of data wherein our team analyses the interview transcripts, online survey responses and observation of on filed participants. The below mentioned chart should give a better understanding of the part 1 of the primary interview.

Primary Research

Part 2: In this part of primary research the data collected via secondary research and the part 1 of the primary research is validated with the interviews from individual consultants and subject matter experts.

Consultants are those set of people who have at least 12 years of experience and expertise within the industry whereas Subject Matter Experts are those with at least 15 years of experience behind their back within the same space. The data with the help of two main processes i.e., FGDs (Focused Group Discussions) and IDs (Individual Discussions). This gives us a 3rd party nonbiased primary view of the market scenario making it a more dependable one while collation of the data pointers.

Step 3: Data Bank Validation

Once all the information is collected via primary and secondary sources, we run that information for data validation. At our intelligence centre our research heads track a lot of information related to the market which includes the quarterly reports, the daily stock prices, and other relevant information. Our data bank server gets updated every fortnight and that is how the information which we collected using our primary and secondary information is revalidated in real time.

Data Bank Validation

Step 4: QA/QC Process

After all the data collection and validation our team does a final level of quality check and quality assurance to get rid of any unwanted or undesired mistakes. This might include but not limited to getting rid of the any typos, duplication of numbers or missing of any important information. The people involved in this process include technical content writers, research heads and graphics people. Once this process is completed the title gets uploader on our platform for our clients to read it.

Step 5: Final QC/QA Process:

This is the last process and comes when the client has ordered the study. In this process a final QA/QC is done before the study is emailed to the client. Since we believe in giving our clients a good experience of our research studies, therefore, to make sure that we do not lack at our end in any way humanly possible we do a final round of quality check and then dispatch the study to the client.