Smart Gas Meter Market Report Scope & Overview:
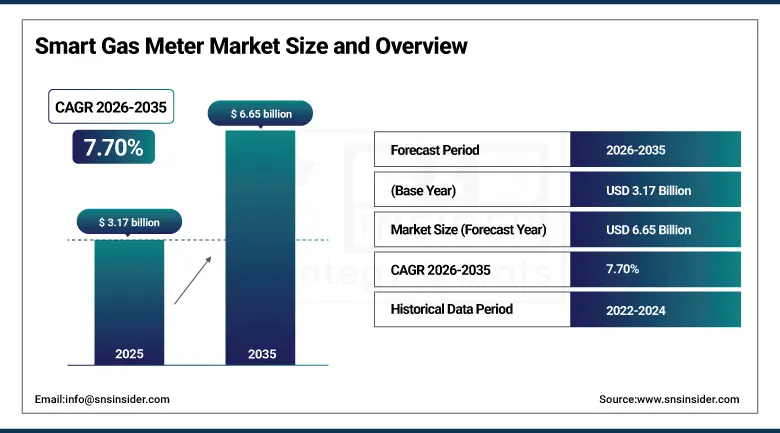
The Smart Gas Meter Market was valued at USD 3.17 billion in 2025 and is expected to reach USD 6.65 billion by 2035, growing at a CAGR of 7.70% from 2026 to 2035.
The market for smart gas meters is showing a positive growth trajectory, owing to the rising need for improved gas management and smart meters. They help monitor the gas utilization in real time, thus facilitating utilities to measure usage, detect leaks, avoid waste, and make accurate billing. This market's growth can be attributed to factors such as the increasing significance of energy efficiency, the rise in digital technology implementation, and the growing demand for automated billing. The integration of IoT and cloud in the systems enables the smart gas meters to offer more responsive demand management, remote monitoring, and predictive maintenance. In addition, the rising government regulations on the use of smart meters, aging infrastructure upgrade projects, and high customer demands for efficient energy management are expected to drive the future market growth.
In May 2023, Landis+Gyr introduced G480 ultra-sonic smart gas meter with 30 years of solid-state measurement, cellular communication, and self-cut-off functionality.
Market Size and Forecast
-
Market Size in 2026E: USD 3.41 Billion
-
Market Size by 2035: USD 6.65 Billion
-
CAGR: 7.70% from 2026 to 2035
-
Fastest Growing Region: Asia Pacific
-
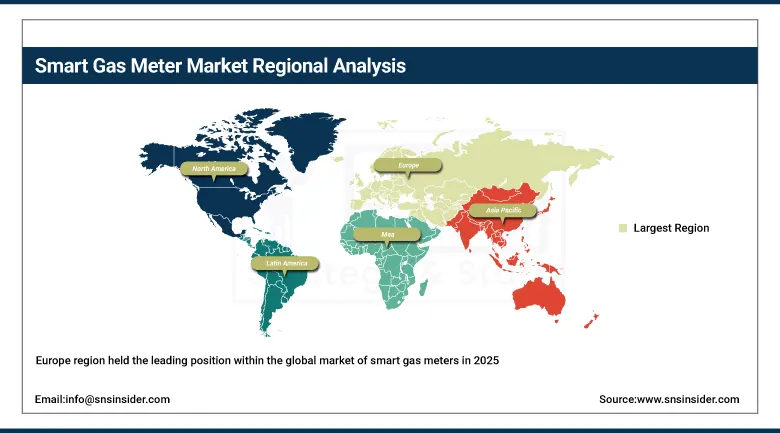
Largest Region: Europe
To Get more information on Smart Gas Meter Market - Request Free Sample Report
Smart Gas Meter Market Trends
-
The increase in usage of the IoT and cloud-based metering systems will transform the existing gas distribution network to become an intelligent system.
-
The rise in adoption of NB-IoT and LoRaWAN wireless communications technologies will facilitate better long-range data transfer and remote monitoring systems.
-
The rise in governmental pressure for adopting smart meters will speed up the process of implementation of the smart gas meter systems.
-
The growth in the use of advanced data analytics systems will result in improved demand forecasts, along with proactive maintenance measures.
-
The growing interest in hydrogen-enabled smart gas meters is one of the trends that will define future technological advancements.
U.S. Smart Gas Meter Market Size Outlook
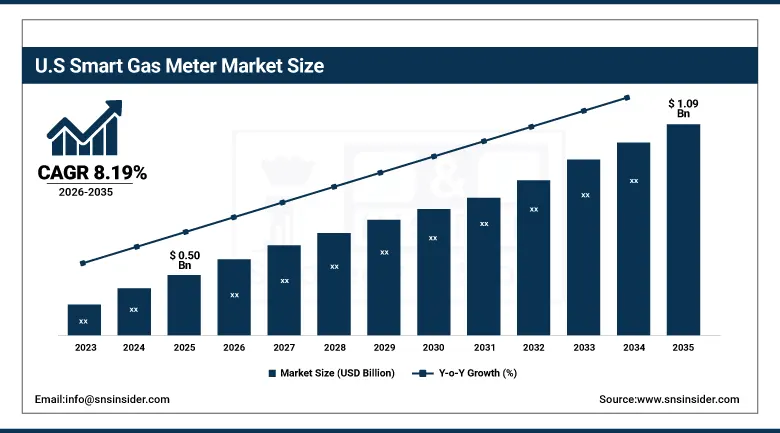
The U.S. smart gas meter market was valued at USD 0.50 billion in 2025 and is expected to reach USD 1.09 billion by 2035, growing at a CAGR of 8.19% from 2026 to 2035.
The United States dominates the North American smart gas meter market due to AMI implementation, significant government initiatives for grid modernization, and growing investments in remote meter monitoring devices. Smart gas meters have been increasingly adopted by U.S. utilities companies due to enhanced efficiency in monitoring and reduction of cost of manual meter readings, as well as improved detection of leaks. The Department of Energy's Grid Modernization Initiative has spurred adoption of such solutions within both domestic and industrial sectors. The release of the EI5 smart gas meter, the world's first 100% hydrogen-ready diaphragm smart gas meter released by Honeywell in November 2023, exemplifies the innovations that influence development trends within the U.S. market segment.
The EI5 smart gas meter, introduced by Honeywell in November 2023, was released as the first 100% hydrogen-ready diaphragm smart meter that enables metering of natural gas as well as hydrogen without replacing existing infrastructure.
Smart Gas Meter Market Segment Analysis
-
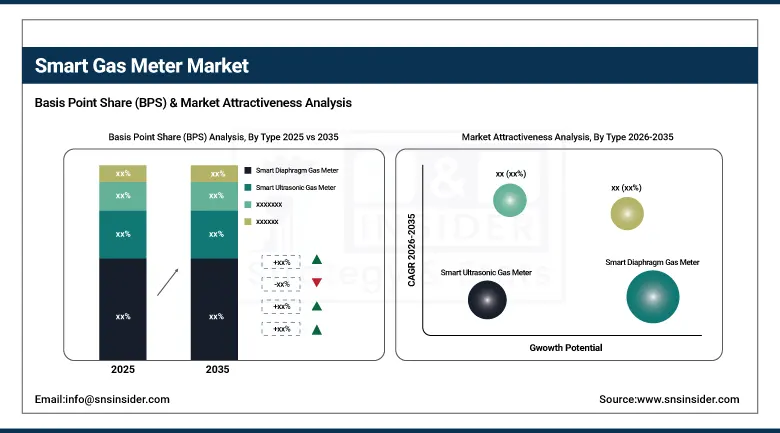
By Type, Smart Diaphragm Gas Meter segment dominated the Smart Gas Meter Market in 2025 with approximately 62% share; Smart Ultrasonic Gas Meter segment fastest growing.
-
By Technology, Automatic Meter Reading (AMR) segment dominated the Smart Gas Meter Market in 2025; Advanced Metering Infrastructure (AMI) segment fastest growing.
-
By Component, Hardware segment dominated the Smart Gas Meter Market in 2025; Software segment fastest growing.
-
By End User, Residential segment dominated the Smart Gas Meter Market in 2025 with approximately 52% share; Commercial segment fastest growing.
By Type, Smart Diaphragm Gas Meter segment dominates the smart gas meter market, Smart Ultrasonic Gas Meter segment expected to grow fastest
The Smart Diaphragm Gas Meter segment led the smart gas meter market with nearly 62% share in 2025 on account of their cost-effectiveness, reliability, and compatibility with the existing gas delivery system. They are the most commonly installed type of gas meter owing to their reliable operation, low cost of installation, and easy adoption in AMR systems. Developing countries' utility companies still continue to favor smart diaphragm gas meters for large-scale installations due to their regulatory approval and affordability. They possess a simple mechanism and an impressive operational record that helps them sustain market leadership in such cases where cost and compatibility considerations take priority.
Ultrasonic Smart Gas Meter segment constitutes the fastest-growing product segment in the smart gas meter market because of their excellent precision in measurements, lack of any moving components, higher life span, and low maintenance needs when compared with the conventional methods. These types of meters are gaining more attention from users in the high-end commercial and industrial segments who look for accuracy in billing systems and longevity in their products. Increasing digitization of utility grids and the need for meters equipped with two-way communication technology have increased the usage of these meters. For example, the Landis+Gyr's G480 ultrasonic meter with 30 years' experience in solid-state measurement and cellular technology is among the best in the market.
By Technology, AMR segment dominates the smart gas meter market, AMI segment expected to grow fastest
Automatic Meter Reading (AMR) segment dominated the smart gas meter market in 2025 owing to its maturity, cost-effectiveness, and widespread deployment across utility networks globally over the past decade. AMR meters transmit the information via radio frequency networks, helping in automating gas consumption measurement by utility companies, thereby cutting down on cost incurred in manual readings and avoiding any human errors that may occur in the process. AMR technology is popular in areas that require basic modernization of the metering system without breaking the bank. The robust nature of the technology and ease of its deployment path makes it an ideal choice in regulated utility metering technology. Its wide deployment has enabled its dominance in the market despite the rise of two-way communications technology.
The AMI segment is the fastest-growing technology within the smart gas meter market owing to its capability to facilitate two-way communication, remote meter configurations, and real-time data monitoring and prediction of maintenance needs. It is recognized as the most effective technology for developing smart gas distribution networks. Programs such as the EU smart meter directives and Grid Modernization initiatives by the U.S. Department of Energy are forcing utilities in both the residential and commercial sectors to use AMI technology. Coupled with cloud analytics platforms, Internet of Things technology, and AI-based demand forecasting, it is rapidly gaining popularity.
By Component, Hardware segment dominates the smart gas meter market, Software segment expected to grow fastest
Hardware segment was the major contributor to revenue generated by the smart gas meter market in 2025 due to the widespread installation of smart metering devices such as meters, communication modules, gateways, and sensors for residential, commercial, and industrial infrastructure. As the procurement of hardware remains an expensive affair, revenues from the sales of physical devices always remained dominant in the global smart metering market. There has been an increased government mandate towards replacing old gas meters with more efficient smart meters leading to a high demand for hardware. Improved meter miniaturization, efficient battery performance, and integrated communication modules have enabled a growth in the addressable hardware market size.
Software segment has become the fastest-growing component in the smart gas meter market driven by the need for utilities to have advanced analytics, consumption monitoring, billing management software, and predictive maintenance applications based on data generated by the smart meters. An increase in cloud-based meter management solutions and artificial intelligence-driven demand forecasting tools is providing growth momentum to the software segment revenues. It has been understood by utilities that maximum benefit from investment in smart meters can be derived through software applications which convert consumption data into operations. Growing integration of smart metering software with enterprise resource planning systems, customer management platforms, and grid automation networks is further expanding the commercial scope of smart gas meter software solutions.
By End User, Residential segment dominates the smart gas meter market, Commercial segment expected to grow fastest
Residential segment dominated the smart gas meter market in 2025, capturing approximately 52% of total revenue, owing to large-scale government-mandated meter replacement programs targeting household gas consumers across Europe, North America, and Asia Pacific. Regulatory frameworks in the United Kingdom, Italy, and China have driven millions of residential smart meter installations, generating consistent and high-volume hardware and software procurement. Increasing consumer demand for accuracy in billing, monitoring of energy consumption, and energy cost management is enhancing the dominance of residential end users in the industry. Automated meter reading features such as the ability to detect leaks, prevent frauds, and remotely disconnect meters are adding to the attractiveness of investing in residential smart meter installations.
The commercial segment represents the most rapidly growing end user segment in the smart gas meter market due to the high demand from commercial entities for accurate monitoring, cost allocation, reporting, and optimization of energy consumption. The commercial sector has realized that smart gas meters can help realize significant cost savings by optimizing consumption of energy and lowering the burden on manual management. Integration with building management software and sustainability reporting systems provides added value. Increasing environmental, social, and governance considerations, together with the rising cost of energy, is driving adoption of smart gas meters within the commercial end-user segment.
Regional Analysis
|
Region |
Major Country |
Share within Region, 2025 (%) |
|---|---|---|
|
North America |
United States |
76.4% |
|
Europe |
United Kingdom |
28.3% |
|
Asia Pacific |
China |
54.7% |
|
Middle East & Africa |
UAE |
21.6% |
|
Latin America |
Brazil |
46.3% |
Europe Smart Gas Meter Market Insights
The Europe region held the leading position within the global market of smart gas meters in 2025 due to the presence of mandatory programs for the installation of smart meters in the United Kingdom, Italy, France, and the Netherlands, which helped build one of the biggest bases of smart gas meters worldwide. The UK smart meter rollout and mass-scale introduction in Italy made Europe the world leader in the implementation of residential smart gas meters. Under the directive on energy efficiency of the EU, there is continuous installation of smart meters that contributes to the leadership of Europe in the industry.
Get Customized Report as per Your Business Requirement - Enquiry Now
Asia Pacific Smart Gas Meter Market Insights
The Asia Pacific region is forecasted to record high growth rates in the market for smart gas meters because of rapid urbanization, developments of gas distribution infrastructure, and supportive policies by governments for smart utilities adoption projects in countries such as China, India, and Southeast Asia. Gas distribution infrastructure modernization efforts in China, along with its position as one of the largest producers of smart meters, provides both opportunities and challenges for growth in China. Expansion of urban gas networks and industrial gas consumption in India have created robust demand for metering infrastructure development. Southeast Asia has increasingly become a market destination for smart gas metering technologies.
North America Smart Gas Meter Market Insights
The North American market for smart gas meters is experiencing steady growth due to increased investments made by utilities in AMI, favorable energy policies from the federal government, and the increasing need for remote monitoring capability. The United States leads the region in terms of adoption, with leading utilities deploying smart gas meters to minimize operational costs, detect leaks, and provide superior service to their customers. The Grid Modernization Initiative by the U.S. Department of Energy provides both regulatory oversight and financial assistance for deployment of smart meters. Canada also experiences increased investments in smart metering technology, with the modernization of gas distribution infrastructure in urban areas by its utilities.
Middle East & Africa and Latin America Smart Gas Meter Market Insights
The smart gas meter markets in Middle East & Africa, especially countries such as the UAE and Saudi Arabia, as well as Latin America, particularly Brazil, are witnessing steady growth owing to developments within the gas networks, urbanization trends, and the need for metering upgrades by utilities. The gulf countries are implementing smart gas meter installations as part of their larger smart city plans and energy efficient infrastructure projects. The Latin American smart meter market is seeing the installation of these devices due to issues related to inaccurate billing and the desire to minimize non-technical losses.
Growth Drivers: Global push for energy efficiency and sustainability is accelerating smart gas meter adoption across utility networks worldwide
Governments around the world have become focused on reducing carbon emissions and encouraging sustainable consumption of natural resources, leading to policy frameworks requiring the installation of smart meters in their gas distribution networks. Smart gas meters offer utilities real-time information about gas consumption, which is critical for managing demand, detecting leaks, and preventing losses through smart metering technology. Integration with IoT technologies and cloud-based systems offers utilities the opportunity to enhance customer service, bill accurately, and manage their network infrastructure effectively. Increased consumer interest in being transparent with their energy consumption and controlling costs has encouraged investments in smart metering by utilities. Furthermore, increasing costs associated with natural gas are encouraging utilities as well as consumers to embrace smart meters for efficient consumption of gas.
Restraints: High infrastructure costs and cybersecurity risks associated with connected metering systems are limiting rapid deployment across price-sensitive and underdeveloped markets
Smart gas metering technology implementation necessitates substantial initial capital outlay in terms of hardware, connectivity, software, and training, making it financially difficult for gas companies working within developing countries that do not have enough budgetary provisions. The old gas distribution network in many areas would necessitate expensive changes before the smart metering system could be implemented. Vulnerabilities associated with cybersecurity threats to the internet-enabled smart metering system could expose the system to data theft and manipulation. Data interoperability problems in relation to various smart metering systems using different technology could hamper their implementation on a wide scale. Concerns about data protection of consumers from cyber attacks and unclear legal frameworks governing smart metering data could make smart metering implementation challenging.
Opportunities: Advancing hydrogen-ready and AI-powered metering technologies are creating new long-term growth opportunities for smart gas meter providers globally
There is great interest in hydrogen-friendly smart gas meters as a solution to measuring mixed gases and hydrogen in particular, as there is increasing interest in using hydrogen as a source of clean fuel throughout the world. For instance, the Honeywell EI5 hydrogen-ready diaphragm smart gas meter presents the kind of opportunities that the development of hydrogen-based solutions will present to technology firms. As the use of AI and machine learning becomes increasingly common in metering data analytics, there will be great value in predictive demand analytics, anomaly detection, and optimized network management that result from such applications. Digital twins and their increasing application in managing gas networks have increased the need for accurate metering sensors that provide the real-time data needed by the simulation tools. There are opportunities emerging in the development of smart cities in Asia, the Middle East, and Latin America due to growing urban population pressure.
Recent Developments:
-
2025: Landis+Gyr and Centrica Smart Meter Assets signed a strategic partnership to expand smart gas meter deployment across the United Kingdom, reinforcing the UK's position as Europe's leading smart meter market and supporting national smart metering rollout program targets.
-
2024: Apator SA expanded its smart diaphragm gas meter portfolio with new AMI-compatible models targeting utility modernization programs across Central and Eastern European markets, strengthening its competitive position in the region.
-
2023: Landis+Gyr launched the G480 ultrasonic smart gas meter with 30 years of solid-state measurement, cellular connectivity, and self-cutoff capability, representing a significant advancement in meter durability and performance for utility operators globally.
-
2023: Honeywell introduced the EI5, the world's first 100% hydrogen-ready diaphragm smart gas meter, enabling utilities to future-proof gas metering infrastructure for the energy transition without replacing existing base installations.
Smart Gas Meter Market Companies are:
-
Landis+Gyr
-
Honeywell International Inc.
-
Itron Inc.
-
Apator SA
-
Diehl Stiftung & Co. KG
-
Sensus (Xylem)
-
EDMI Limited
-
Chongqing Shancheng Gas Equipment Co. Ltd.
-
ZENNER International GmbH & Co. KG
-
Master Meter
-
Aclara Technologies
-
Raychem RPG
-
CHINT Group
-
Dongfa (Group)
-
Siemens AG
-
Schneider Electric
-
Kamstrup AS
-
DIEHL Metering
-
Badger Meter Inc.
-
Elster Group
| Report Attributes | Details |
|---|---|
| Market Size in 2025 | USD 3.17 Billion |
| Market Size by 2035 | USD 6.65 Billion |
| CAGR | CAGR of 7.70% From 2026 to 2035 |
| Base Year | 2025 |
| Forecast Period | 2026-2035 |
| Historical Data | 2022-2024 |
| Report Scope & Coverage | Market Size, Segments Analysis, Competitive Landscape, Regional Analysis, DROC & SWOT Analysis, Forecast Outlook |
| Key Segments | • By Type (Smart Diaphragm Gas Meter, Smart Ultrasonic Gas Meter) • By Technology (Automatic Meter Reading (AMR), Advanced Metering Infrastructure (AMI)) • By Component (Hardware, Software) • By End User (Residential, Commercial, Industrial) |
| Regional Analysis/Coverage | North America (US, Canada, Mexico), Europe (Eastern Europe [Poland, Romania, Hungary, Turkey, Rest of Eastern Europe] Western Europe] Germany, France, UK, Italy, Spain, Netherlands, Switzerland, Austria, Rest of Western Europe]), Asia Pacific (China, India, Japan, South Korea, Vietnam, Singapore, Australia, Rest of Asia Pacific), Middle East & Africa (Middle East [UAE, Egypt, Saudi Arabia, Qatar, Rest of Middle East], Africa [Nigeria, South Africa, Rest of Africa], Latin America (Brazil, Argentina, Colombia, Rest of Latin America) |
| Company Profiles | Landis+Gyr, Honeywell International Inc., Itron Inc., Apator SA, Diehl Stiftung & Co. KG Sensus (Xylem), EDMI Limited, Chongqing Shancheng Gas Equipment Co. Ltd., ZENNER International GmbH & Co. KG Master Meter, Aclara Technologies, Raychem RPG, CHINT Group, Dongfa (Group), Siemens AG, Schneider Electric, Kamstrup AS, DIEHL Metering, Badger Meter Inc., Elster Group |
Frequently Asked Questions
Get in Touch
