Smart Meter Market Report Scope & Overview:
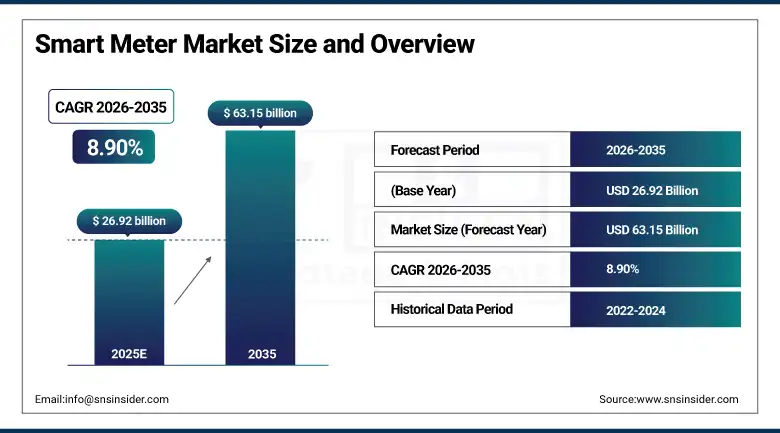
The Smart Meter Market size was valued at USD 26.92 billion in 2025 and is expected to reach USD 63.15 billion by 2035, growing at a CAGR of 8.90% from 2026–2035.
The global Smart Meter Market is at an inflection point of structural transformation as utility companies, governments, and energy regulators accelerate the mandatory replacement of legacy electromechanical meters with two-way communicating digital smart meter infrastructure. This enables real-time energy consumption monitoring, remote disconnection and reconnection, time-of-use pricing programme implementation, grid fault detection, demand response activation, and the granular consumption data analytics that modern smart grid management requires. The market is being propelled by an extraordinary convergence of policy mandates, economic drivers, and technology advances. These include government initiatives such as U.S. Department of Energy Grid Modernization Initiative and the EU Energy Efficiency Directive, which are promoting smart meter installations. In addition, there is an inclusion of energy resources, like solar and wind power, whose supply is fluctuating and requires real-time monitoring of the energy consumed to ensure proper distribution within the grid; and increasing electric vehicles usage resulting in dynamic demand management of energy. More than 65 percent of electricity companies across the world have implemented smart meters for their demand-side management needs, proving that smart metering has reached the critical adoption point.
The Smart Meter Market's 8.90% CAGR from 2026 to 2035 reflects the structural demand certainty created by government mandate programmes requiring smart meter deployment across utility account bases, the demonstrated operational cost savings that utilities realise through smart meter deployment including elimination of meter reading labour, reduction of non-technical losses through detection of meter tampering and energy theft, and the growing value of demand response capability enabled by smart meter two-way communication for grid balancing as renewable energy penetration increases.
Market Size and Forecast
-
Market Size in 2025: USD 26.92 Billion
-
Market Size by 2035: USD 63.15 Billion
-
CAGR: 8.90% from 2026 to 2035
-
Base Year: 2025
-
Forecast Period: 2026–2035
-
Historical Data: 2022–2024
To Get more information On Smart Meter Market - Request Free Sample Report
Smart Meter Market Trends
-
Accelerating smart meter deployment mandates across Europe are driving large-scale utility procurement programs as governments target higher smart electricity and gas meter penetration to improve energy efficiency and digital grid modernization.
-
Growing integration of AI-powered analytics with smart meter platforms is enabling utilities to improve demand forecasting, grid monitoring, predictive maintenance, anomaly detection, and operational efficiency across modern energy networks.
-
Rising adoption of time-of-use pricing programs supported by smart meters is encouraging off-peak electricity consumption, reducing grid strain, improving load balancing, and supporting efficient energy demand management initiatives.
-
Expanding smart water meter deployment across water-stressed regions is improving leak detection, consumption monitoring, billing accuracy, and non-revenue water reduction through real-time infrastructure monitoring and analytics capabilities.
-
The increased use of cellular communication systems in smart meters will facilitate the transmission of reliable data across rural and remote areas where deployment of conventional RF mesh and PLC network will still be expensive.
-
The increased interconnection between smart meters and EV charging systems will provide dynamic charging management, electricity usage during off-peak hours, and stability of the grid, given that the world is rapidly adopting electric vehicles.
-
Increased deployment of smart meters in industrial and commercial establishments will help with energy consumption tracking, optimization, sustainability reporting, and compliance with energy management standards such as ISO 50001.
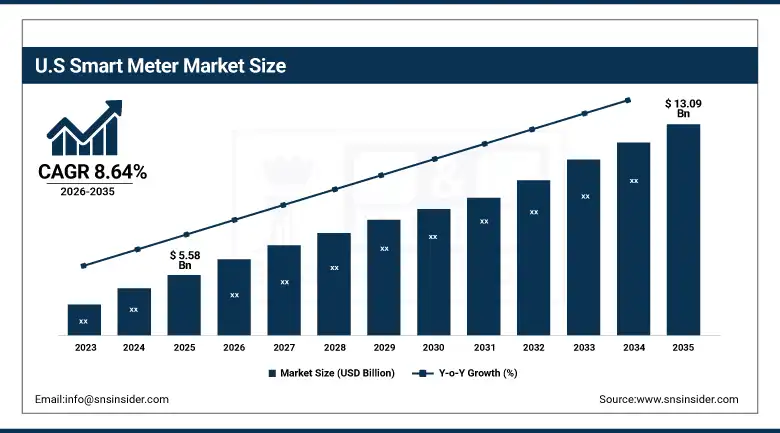
U.S. Smart Meter Market Size Outlook:
The U.S. Smart Meter Market was valued at USD 5.58 billion in 2025 and is expected to reach approximately USD 13.09 billion by 2035, growing at a CAGR of 8.64% during 2026–2035. The USA constitutes a major player within the market for advanced smart meters, with the high level of development within its smart grid modernization projects, utility digital transformation, and substantial investments made by the US federal government into upgrading energy infrastructure. Advanced smart meters are becoming increasingly popular among utility companies providing services to residents, commercial enterprises, and industries for improving billing accuracy, lowering electricity losses, dealing with power outages, and improving reliability. Residential smart meters have covered over 60% of households in North America owing to the highly advanced nature of AMI deployment in this market environment. Moreover, the upgrade of initial AMI technology installed in earlier smart grid systems creates even greater opportunities for newer smart meters with improved security features and enhanced communication and edge computing capabilities.
Landis+Gyr won the contract in August 2024 to provide more than 400,000 smart meters for the Cypriot households coupled with GridStream head-end system, whereas Siemens managed to integrate smart metering solutions with grid analytics based on artificial intelligence by January 2025. These consecutive product delivery and technology integration milestones confirm that the smart meter market has achieved both the manufacturing scale and analytical sophistication that utility operators require for enterprise-wide digital metering infrastructure investment that will sustain market growth through the 2026 to 2035 forecast period.
Smart Meter Market Segment Insights
-
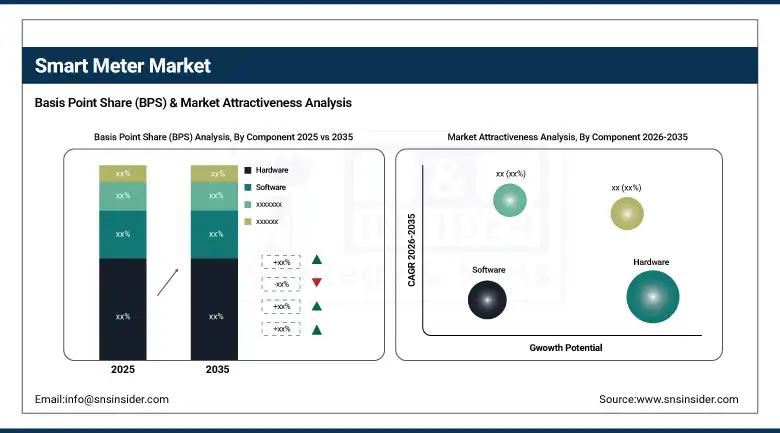
According to Component, Hardware dominated with approximately 77.20% of market share in 2025; Software is expected to grow at the fastest CAGR of approximately 9.09% from 2026 to 2035.
-
In terms of Type, Electric Smart Meters dominated with approximately 64.20% of revenues in 2025; Water Smart Meters are expected to grow at the highest CAGR of 9.62% from 2026 to 2035.
-
By Technology, Advanced Metering Infrastructure dominated with approximately 56.88% market share in 2025 and is simultaneously the fastest-growing technology at approximately 8.94% CAGR.
-
By End-User, Residential dominated as the largest deployment category; Industrial is the fastest-growing end-user.
By Component: Hardware dominates, Software grows fastest
Hardware dominated the Smart Meter Market in 2025 with approximately 77.2% revenue share due to the large-scale deployment of smart meter devices, communication modules, data concentrators, and network infrastructure across utility networks globally. The utilities are investing huge amounts of money in installing smart meters that help in modernizing power grids, enhance accuracy of bills, and help in monitoring energy usage in real time. Hardware is another sector which consists of smart metering devices that have sensors, microprocessors, communication tools, and anti-tampering capabilities.
It is anticipated that the software will record the highest CAGR between 2019 and 2035 due to increased demand for software such as AI-based analytics, MDM systems, demand response, and predictive grid monitoring software. The increased use of machine learning, energy consumption analytics software, and customer energy management software is driving software growth.
By Type: Electric Smart Meters dominate, Water Smart Meters grow fastest
In the year 2025, the Electric Smart Meters have been identified as the best-selling products of the Smart Meter Market with their market revenue share forecasted to be around 64.2%. The reason behind their popularity is due to their application in utilities industries such as residential, commercial, and industrial. In addition to that, the government policies in favor of smart grid technology and AMI implementation are also encouraging users to opt for Electric Smart Meters.
Water Smart Meters are expected to exhibit the fastest CAGR up until 2035 due to rising concerns regarding water shortage around the world, increasing investments in smart water networks, and rising demand for solutions to detect leakages and reduce NRW. Water utility companies have started adopting smart meters in order to monitor consumption, enhance billing practices, and manage water resources in an environmentally sustainable manner.
By Technology: AMI dominates and grows fastest simultaneously
The Advanced Metering Infrastructure (AMI) segment was the top contributor to the Smart Meter Market in 2025, accounting for around 56.88% market share in terms of revenue, and this segment will also grow at the fastest CAGR during the forecast period 2026-2035. The advanced metering infrastructure allows bidirectional interaction between utilities and smart meters. This technology allows remote meter reading, outage identification, energy monitoring in real-time, remote connection management, demand response solutions, and time of use metering systems. Governments across the world have taken up smart grid modernization programs that are pushing AMI adoption.
Automatic Meter Reading (AMR) continues to maintain a significant installed base, particularly in developing regions and phased smart grid projects where one-way communication systems remain sufficient for basic automated consumption monitoring and billing operations.
Regional Insights
|
Region |
Major Country |
Share within Region (%) |
|---|---|---|
|
North America |
United States |
81% |
|
Europe |
United Kingdom |
28% |
|
Asia Pacific |
China |
45% |
|
Middle East & Africa |
Saudi Arabia |
29% |
|
Latin America |
Brazil |
43% |
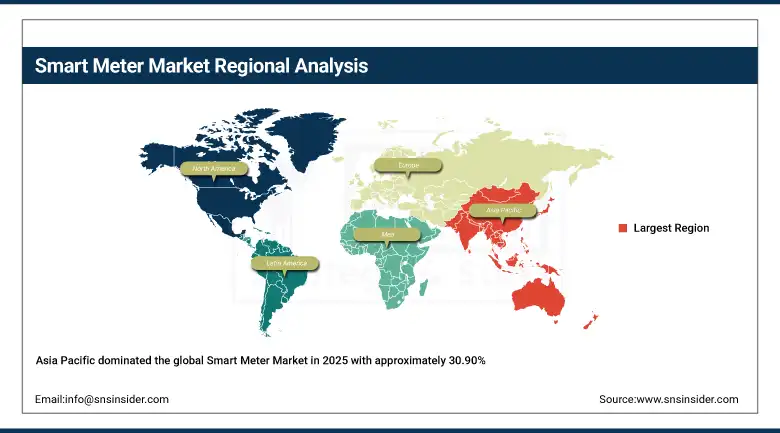
Asia Pacific Smart Meter Market Insights
Asia Pacific dominated the global Smart Meter Market in 2025 with approximately 30.90% of global revenues and is projected to grow at the fastest regional CAGR of 9.74% through 2035, driven by the major economies of China, India, and Japan alongside rapid urbanisation, smart city programmes, and national grid modernisation mandates. China leads through its State Grid and Southern Power Grid national smart meter mandates that have deployed hundreds of millions of smart electricity meters across urban and rural service territories. India's UJALA and NSGM smart metering programmes are creating the world's second-largest smart meter deployment market as the country upgrades its vast electricity distribution infrastructure.
Get Customized Report as per Your Business Requirement - Enquiry Now
North America Smart Meter Market Insights
North America is a mature and growing smart meter market anchored by the United States with approximately 80% of North American revenues. U.S. smart meter penetration exceeds 60% in residential buildings, with second-generation AMI replacement programmes and expansion to previously unmetered accounts sustaining market growth. The Bipartisan Infrastructure Law's grid modernisation investment allocation is creating additional utility capital for smart meter deployment acceleration, while the U.S. smart water meter market is growing rapidly as water utility operators address infrastructure deterioration and conservation mandates.
Europe Smart Meter Market Insights
Europe presents another substantial market for smart meters, determined by the requirements for deployment set out in the EU’s Energy Efficiency Directive, different schedules of implementation within various countries, and gradual expansion of smart metering beyond electricity meters to meters for gas and water utility accounts. Revenue generated in the European market is dominated by the UK due to its SMETS2 smart meter installation program covering 30 million homes. Italy's pioneering Enel second-generation smart meter programme serves as a reference deployment for European utility operators planning infrastructure upgrades.
Latin America and MEA Smart Meter Market Insights
Latin America and MEA are growing smart meter markets driven by non-technical loss reduction imperatives and infrastructure modernisation investment. Brazil leads Latin American revenues through Aneel's smart meter regulatory framework requiring utility deployment across customer account bases, while MEA adoption is driven by Saudi Arabia's smart grid investment under Vision 2030 and South Africa's electricity utility loss reduction programme. The UAE's smart utility infrastructure integration within Dubai's smart city programme demonstrates the premium smart meter market potential in Gulf Cooperation Council nations.
Market Dynamics:
Growth Drivers: Government smart grid mandates and renewable energy integration accelerating smart meter adoption
The regulations concerning upgrade of smart grids, energy efficiency and digitalization of utilities have been the key growth drivers in the Smart Meters market. Use of renewable energy, development of charging stations for electric vehicles and establishment of distributed energy systems have helped contribute to growing need for sophisticated meters that can control operations of smart grids. Traditional meters cannot perform such a task. Smart meters are being increasingly used by utilities companies to reduce expenses and avoid outages of power supply, electricity thefts and errors in billing. Additionally, the growing deployment of artificial intelligence-based grid analytics, demand response systems, and advanced metering infrastructure has resulted in more sophisticated meters in terms of utility management capabilities. Sustained investment in digital energy infrastructure and smart cities would ensure market growth up to 2035.
Restraints: High deployment costs and cybersecurity concerns limiting large-scale smart meter implementation
The high initial infrastructure investment required to install smart meters, establish communication networks and upgrade power grids is a primary limitation for utility companies, especially those operating in developing countries. It entails large investment in the acquisition of meters, software, communications infrastructure and employee training programs. Furthermore, increasing fears about cybersecurity, data access threats and privacy risks linked to utility network systems pose challenges for utility companies. The inability to integrate existing utility infrastructure with smart meters poses another limitation for utility companies. Opposition by consumers on data privacy and the adverse health effects of radio frequency technology is another barrier for adopting smart meters.
Opportunities: Expansion of smart cities and AI-driven utility analytics creating significant growth opportunities
Smart cities, digital utilities infrastructure, and integration of renewable energy sources are creating a plethora of opportunities for the Smart Meter Market. The increasing use of artificial intelligence in power grids, predictive maintenance tools, and energy management systems is helping boost the commercial potential of smart metering solutions. Furthermore, increased focus on building electric vehicle charging stations, distributed generation sources, and intelligent water management solutions will significantly increase the global demand for advanced metering infrastructures. Moreover, the increasing use of 5G connectivity, cloud-based utility management services, and IoT-based smart utility ecosystem will further drive the growth prospects of the smart meters market up to 2035.
Recent Developments:
-
2026: Itron Inc. expanded its strategic AI collaboration with Microsoft to enhance grid-edge intelligence and utility analytics capabilities for advanced smart metering and energy management systems.
-
2026: Siemens AG introduced the next evolution of its Gridscale X platform featuring AI-powered grid planning and advanced utility software capabilities supporting autonomous smart grid operations.
-
2026: Landis+Gyr Group AG announced deployment of its Revelo smart metering platform for advanced grid modernization and demand flexibility management projects supporting next-generation utility infrastructure.
Smart Meter Companies are:
-
Itron Inc.
-
Siemens AG
-
Honeywell International Inc.
-
Kamstrup AS
-
Sensus
-
Elster Group GmbH
-
Jiangsu Linyang Energy Co. Ltd.
-
Wasion Group Holdings Ltd.
-
Aclara Technologies LLC
-
Energizer Holdings Inc.
-
Murata Manufacturing Co. Ltd.
-
Diehl Metering GmbH
-
Holley Technology Ltd.
-
Shenzhen Kaifa Technology Co. Ltd.
-
ADD GRUP
-
Arad Group
-
Neptune Technology Group Inc.
-
Master Meter Inc.
Smart Meter Market Report Scope:
| Report Attributes | Details |
|---|---|
| Market Size in 2025 | USD 26.92 Billion |
| Market Size by 2035 | USD 63.15 Billion |
| CAGR | CAGR of 8.90% From 2026 to 2035 |
| Base Year | 2025 |
| Forecast Period | 2026-2035 |
| Historical Data | 2022-2024 |
| Report Scope & Coverage | Market Size, Segments Analysis, Competitive Landscape, Regional Analysis, DROC & SWOT Analysis, Forecast Outlook |
| Key Segments | • By Component (Hardware, Software, Services) • By Type (Electric Smart Meters, Water Smart Meters, Gas Smart Meters) • By Technology (Advanced Metering Infrastructure, Automatic Meter Reading) • By Communication Technology (Radio Frequency, Power Line Communication, Cellular) • By End-User (Residential, Commercial, Industrial) |
| Regional Analysis/Coverage | North America (US, Canada), Europe (Germany, UK, France, Italy, Spain, Russia, Poland, Rest of Europe), Asia Pacific (China, India, Japan, South Korea, Australia, ASEAN Countries, Rest of Asia Pacific), Middle East & Africa (UAE, Saudi Arabia, Qatar, South Africa, Rest of Middle East & Africa), Latin America (Brazil, Argentina, Mexico, Colombia, Rest of Latin America). |
| Company Profiles | Landis+Gyr Group AG, Itron Inc., Siemens AG, Honeywell International Inc., Kamstrup AS, Schneider Electric SE, Sensus, Elster Group GmbH, Jiangsu Linyang Energy Co. Ltd., Wasion Group Holdings Ltd., Aclara Technologies LLC, Energizer Holdings Inc., Murata Manufacturing Co. Ltd., Diehl Metering GmbH, Holley Technology Ltd., Shenzhen Kaifa Technology Co. Ltd., ADD GRUP, Arad Group, Neptune Technology Group Inc., Master Meter Inc. |
Get in Touch
