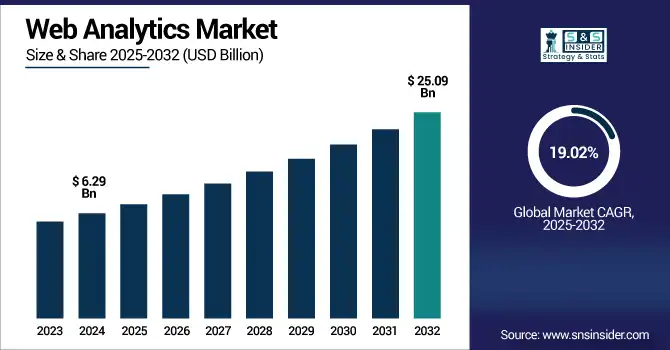
Web Analytics Market size was valued at USD 6.29 billion in 2024 and is expected to reach USD 25.09 billion by 2032, growing at a CAGR of 19.02% over 2025-2032.
The Web Analytics Market growth is driven by the use of web analytics solutions that improve customer the personalization capabilities, growing adoption of cloud, and surge in number of connected devices. Businesses are using web analytics to drive targeted marketing efforts and to track customer interactions and boost conversion rates. The rise of e-commerce, mobile and social media activity has raised the bar of instant insights.
Notably, Google Analytics 4 (GA4) powers around 13.5 million websites as of August 2023, reflecting its central role in modern digital strategies.
Additionally, cloud adoption has significantly enhanced analytics deployment AWS Cloud Value Benchmarking reports that migrating to AWS resulted in a 27% reduction in cost per user, 58% increase in virtual machines managed per admin, 57% decrease in downtime, and 34% fewer security events demonstrating how cloud infrastructure boosts efficiency and resilience.
Advancements in AI and machine learning have further strengthened analytics tools, enabling deeper and faster insights.
Supporting this, a survey by AWS and Altman Solon revealed that generative AI adoption in telecom will reach 48% within two years, with 34% expected in just one year, and 92% of companies are likely to use AI chatbots, and 63% already have them in production, highlighting the growing role of AI-driven automation in web analytics.
The rise of cloud-based deployment models and increasing investments in digital marketing continue to fuel the expansion of the web analytics market.
The U.S. Web Analytics Market size was valued at USD 1.79 billion in 2024 and is expected to reach USD 7.13 billion by 2032, growing at a CAGR of 18.85% from 2025-2032.
The U.S. Web Analytics Market is growing due to strong digital infrastructure, high adoption of advanced marketing technologies, and increasing demand for real-time consumer insights. This strong growth is driven by increasing e-commerce, growing investments in data analytics, and increasing demand for personalization in online experiences.
Drivers
Rising E-Commerce Penetration and Digital Transformation Initiatives are Fueling the Need for Robust Web Performance Tracking Solutions
With the rise of e-commerce across markets and industries, organizations rely more on web analytics to outline user journeys, identify drop-offs, and refine conversion funnels. The urgency to have KPIs measured and a digital strategy aligned with it is all-time high due to the digital transformation across the industries. These tools quantify how effective the campaigns were and enable a competitive edge. Combined with integration with CRM and marketing automation platforms, this only adds to the strategic value that web analytics brings to the table, hence adding to the fact that web analytics is an essential tool for data-driven decision making and for keeping customers interested in today’s economy business environment.
Adobe Marketo Engage customers, for instance, report a 37 % reduction in email campaign time and up to a 2.8× increase in revenue from integrated, data-driven automation.
Furthermore, studies show that even a modest 5 % increase in customer retention often driven by analytics-powered CRM strategies can lead to a 50 % rise in lifetime customer profits.
In parallel, the rise of mobile-first shopping, which now accounts for over 60 % of total e-commerce sales, further reinforces the need for real-time performance analytics and continuous funnel optimization.
Restraints
Growing Concerns Over Data Privacy Regulations and Compliance are Restricting the Use of Web Analytics Tools in Several Regions
Heavy regulations such as GDPR and CCPA have placed heavy shackles on web analytics vendors and customers alike. Enter consent-based data collection, anonymization and now transparency, and it only gets tougher to comply. Regulatory fines and the difficulty of syncing tracking tools with privacy requirements have prevented more comprehensive use. This reduces the granularity of data and diminishes insights. While there is growing demand for privacy-by-design solutions, upgrading legacy systems to meet modern standards remains costly and operationally complex for many businesses.
For instance, Meta (Facebook/Instagram) was fined USD1.31 billion USD in May 2023 for illegal data transfers to the U.S., USD443 million USD in 2022 for violations related to children's data processing, and USD275 million USD in December 2024 for a 2018 data breach.
Additionally, under the CCPA in the U.S., companies can face statutory penalties ranging from USD100 to USD750 USD per consumer per incident, with fines reaching up to USD2,500 USD for unintentional violations and USD7,500 USD for intentional ones further emphasizing the financial and legal risks of non-compliance.
Opportunities
Growing Integration of AI And Machine Learning with Web Analytics Platforms is Unlocking New Predictive and Prescriptive Capabilities
Artificial Intelligence and Machine Learning are changing the game when it comes to web analytics: providing automated insights, spotting outliers and advanced customer segmentation. They also provide real-time trend prediction, behavior modeling and smart recommendations based on more than just traditional reporting. Suppliers are embedding AI to enable marketers to act on worthwhile data in real time, and enabling non-technical users to dig into analytics. With increasing demand for competitive intelligence, AI-powered analytics is fast evolving into a strategic investment for several important domains such as retail, BFSI and healthcare, facilitating smarter, faster decision-making.
For instance, Google Analytics 4’s Analytics Intelligence uses machine learning to detect anomalies and emerging trends in real time, allowing users to configure up to 50 custom alert rules.
As of April 2025, GA4 also automatically provides explanatory summaries by analyzing patterns in dimensions and metrics helping reduce the time spent on manual report reviews. S
Similarly, since November 2023, Amazon CloudWatch Logs has been using machine learning to automatically recognize and cluster log patterns, extract meaningful trends, and surface anomalies based on AWS’s operational data.
Challenges
Difficulty In Unifying Data from Multiple Sources and Platforms Continues to Hamper Analytics Accuracy and Actionable Insights
Most companies have a patchwork quilt of a digital ecosystem, with data living in silos across dozens of different CMSs, CRMs, ad platforms, and social. Such lack of integration prevents one to extract cohesive actionable insights from web analytics tools. These limitations range from inline to inconsistent data formats, API, or inadequate data governance. With disconnected data architecture, the insights are incomplete or delayed, resulting in poor decisions. But even with technological improvements, constructing easy data pipes and real-time data syncing across sources is one area that many firms wrestle with as of late.
According to Salesforce, 90% of organizations report that data silos continue to be a challenge, and almost 90% say integration issues block digital transformation efforts.
Companies use an average of 843 applications, but only 29% are integrated, leaving the rest siloed and fragmented.
Furthermore, 85% of IT organizations are slowed down by integration challenges, and only 18% of organizations achieve fully integrated end-user experiences across all digital channels, while 48% find this difficult.
By Enterprise Type
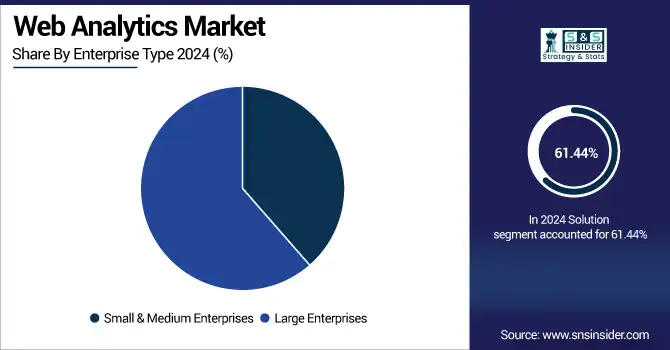
Large enterprises dominated the Web Analytics Market share in 2024 due to their vast digital infrastructure, higher marketing budgets, and demand for advanced analytics capabilities. Such organizations have a clear focus on understanding customer better, personalizing campaigns, and optimizing conversions, underlined by the need for strong analytics platforms. Also, their global footprint, rich data pool demands scalable solutions which leads them to early adoption and higher revenue share comparing more smaller firms with limited analytics deployment footprint size.
Small and medium enterprises are projected to grow at the fastest CAGR of 20.38% over 2025-2032, as every business is now hands on with digitizing their operations and the cloud-based analytics tools have become quite affordable recently. With increasing competition out there, the SMEs are focusing on data-driven marketing and customer engagement tactics. The emergence of simple, subscription-based platforms gives these companies access to advanced analytics capabilities, which encourages adoption and facilitates true rapid growth in this segment in emerging and developed markets alike.
By Application
Social media analytics held the largest revenue share of 22% in 2024, due to growing attention of the brands toward real time engagement, sentiment tracking, and influencer impact measurement. In addition, as consumer behavior is increasingly influenced by Instagram, Facebook and TikTok, organizations are looking at tools to track performance metrics and audience insights, with oversight being critical. These changes, in addition to a greater emphasis on customer-centric marketing and the growing relevance of social data, gives it the stature of a true powerhouse of the analytics industry.
Display advertising optimization is expected to witness the fastest CAGR of 21.55% over 2025- 2032, owing to the rise in the digital advertising spend and the increasing adoption of programmatic advertising. Web analytics lie at the heart of how businesses are able to maximize ad ROI by targeting specific placements, conducting A/B tests, and using dynamic creative content optimization, which is even more critical for direct-response ads. With an increasing demand of transparency and performance tracking from advertisers, advanced analytics solutions for display campaigns prove to support this domain and significantly drive growth.
By Vertical
Retail and e-commerce dominated the Web Analytics Market with a 29% revenue share in 2024, attributed to its heavy dependency on digital platforms for sales and customer interaction. These businesses get analytics to make the customer journey better and avoid cart abandonment. Given the high online purchases and omnichannel mall, web analytics is enabled that capture high levels of retail dealership, operational efficiency, and marketing effectiveness while ensuring the top spot in the market.
The IT and telecommunication segment is anticipated to grow at the fastest CAGR of 21.78% over 2025-2032, fueled by increased customer acquisition efforts and digital service delivery. These companies leverage analytics to fine-tune the user experience, lower churn, and identify upsell opportunities for the product. Customer data is increasing exponentially with the services continuing to be moved online, hence web analytics is key to understand user behavior but also combined with other factors for building a competitive strategy in a hypercompetitive environment.
By Solution
Search Engine Tracking and Ranking dominated the Web Analytics Market with a 31% revenue share in 2024 and is expected to grow at the fastest CAGR of 20.41% during 2025-2032. The segment’s dominance is fueled by companies that demand more visibility in search results, more traffic, thus more organic leads, which make the SEO performance a center stage of their marketing strategy. Increasing dependency on Google and other search engines for lead generation and presence boost the need. Forecasts for its fast expansion are underpinned by new algorithms, a surge in mobile search, and growing scope for businesses to invest in content optimizing and monitoring their position on the SERPs.
By Deployment
Cloud segment led the Web Analytics Market with a 64% revenue share in 2024 and is anticipated to grow at the fastest CAGR of 19.97% over 2025-2032. This growth is driven by the movement toward scalable, cost-effective, and remotely accessible analytics platforms. Cloud deployment is flexible, streamlined with updates, easier to integrate with third-party tools, and fits for both large enterprises and extends for renegade SMEs as well. Growing SaaS adoption, increased demand for real-time analytics, and greater dependence on digital infrastructure in a hybrid work environment are all catalysts for its growth.
North America
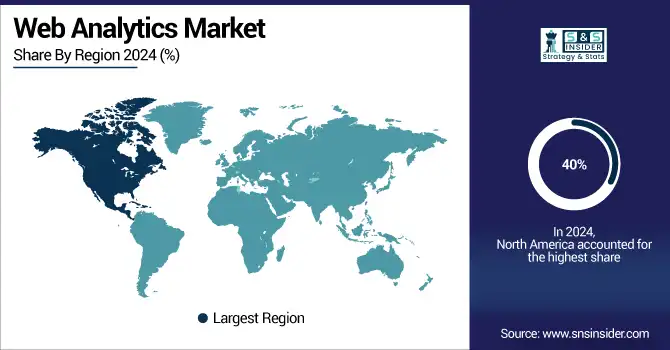
North America dominated the Web Analytics Market with a 40% revenue share in 2024 due to the presence of mature digital ecosystem, high adoption of the technologies, and presence of key providers in the block. In addition, high digital advertising spends, prevalent data-driven strategies and mature regulations encourage adoption.
According to the IAB/PwC report, the U.S. internet advertising revenue surged to USD 258.6 billion in 2024, marking a 14.9% year-over-year increase, with digital video, search, display, and social media driving growth.
With high infrastructure and a clear focus on personalization, customer retention, and real-time decision-making, the proliferation of AI across sectors continues to grow in the region.
The U.S. is dominating the Web Analytics Market owing to well-developed digital infrastructure, higher adoption of analytics tools and a greater number of investments in digital marketing.
Asia Pacific
Asia Pacific is projected to grow at the fastest CAGR of 21.46% over 2025-2032 due to rapid digitalization, expanding e-commerce penetration, and increasing internet user base. Government and enterprises are pouring money in cloud infrastructure and digital marketing, increasing analytics demand. This is bolstered by the increasing number of SMEs going for web-based solutions and the exponential growth of smartphone applications.
The Chinese government reported that from January to May 2025, USD 20 billion in digital product sales such as smartphones and wearables were driven by subsidies, underlining state-led e-commerce growth in the region.
Multinational and local vendors are also targeting the region for expansion, accelerating market growth. China is dominating the Web Analytics Market in Asia Pacific due to its massive online population, booming e-commerce sector, and strong investment in digital technologies.
Europe
Europe is experiencing steady growth in the Web Analytics Market due to digital transformation across sectors, growing regulatory scrutiny on data usage and increasing adoption of analytics tools for customer engagement enhancement, marketing optimization, and compliance with data protection laws across the region.
Between 2021 and 2024, the EU budget including the NextGenerationEU recovery plan allocated approximately USD 66 billion for e-government initiatives and around USD 44 billion for digitalizing businesses, reflecting strong public-sector investment in digital transformation across the region.
The U.K. Web Analytics Market in Europe is driven by strong growth of e-commerce, wide adoption of analytics solutions, and accelerated digital transformation initiatives.
Middle East & Africa and Latin America
Middle East & Africa and Latin America are experiencing key Web Analytics Market trends, driven by rising internet penetration, growing e-commerce, and digital marketing efforts. Government and enterprise investments in digital infrastructure are accelerating adoption, supporting data-driven strategies and customer engagement across both regions.
Web Analytics Market companies are Google LLC, matomo.org, Adobe Inc., Amplitude Inc., Sandstorm Analytics Inc. (kissmetrics), Crazy Egg, Inc., Glassbox Ltd., Webtrends Inc., Mouseflow, Inc, Hotjar Ltd., AT Internet, International Business Machines Corporation, Microsoft Corporation, MicroStrategy Incorporated, SAS Institute Inc., Splunk Inc., Tableau Software LLC, and Teradata Corporation.
June 2025: Google Analytics 360 introduces Property Syncing to replicate custom dimensions/metrics across sub‑properties, ensuring consistent configurations.
December 2024: Matomo 5.2.0 released with enhanced security features, stronger privacy controls, and performance improvements for the core platform.
July 2023: Adobe unveils Product Analytics within Customer Journey Analytics self-service cross‑channel product experience insights, private beta available.
Report Attributes | Details |
---|---|
Market Size in 2024 | USD 6.29 Billion |
Market Size by 2032 | USD 25.09 Billion |
CAGR | CAGR of 19.02% From 2025 to 2032 |
Base Year | 2024 |
Forecast Period | 2025-2032 |
Historical Data | 2021-2023 |
Report Scope & Coverage | Market Size, Segments Analysis, Competitive Landscape, Regional Analysis, DROC & SWOT Analysis, Forecast Outlook |
Key Segments | • By Solution (Heatmap Analytics, Search Engine Tracking and Ranking, Marketing Automation, Behavior-based Targeting, Others) • By Deployment (On-premise, Cloud) • By Enterprise Type (Small & Medium Enterprises, Large Enterprises) • By Application (Mobile Analytics, Online Marketing, Email Marketing, Social Media Analytics, Target & Behavioral Analysis, Display Advertising Optimization, Others) • By Vertical (BFSI, Retail & E-commerce, Healthcare, Government, IT & Telecommunication, Manufacturing, Others) |
Regional Analysis/Coverage | North America (US, Canada, Mexico), Europe (Germany, France, UK, Italy, Spain, Poland, Turkey, Rest of Europe), Asia Pacific (China, India, Japan, South Korea, Singapore, Australia, Rest of Asia Pacific), Middle East & Africa (UAE, Saudi Arabia, Qatar, South Africa, Rest of Middle East & Africa), Latin America (Brazil, Argentina, Rest of Latin America) |
Company Profiles | Google LLC, matomo.org, Adobe Inc., Amplitude Inc., Sandstorm Analytics Inc. (kissmetrics), Crazy Egg, Inc., Glassbox Ltd., Webtrends Inc., Mouseflow, Inc, Hotjar Ltd., AT Internet, International Business Machines Corporation, Microsoft Corporation, MicroStrategy Incorporated, SAS Institute Inc., Splunk Inc., Tableau Software LLC, Teradata Corporation |
Ans: The Web Analytics Market is expected to grow at a CAGR of 19.02% during 2025-2032, driven by rising digital transformation and data-driven strategies.
Ans: The Web Analytics Market was valued at USD 6.29 billion in 2024, with increasing adoption across enterprises for marketing optimization and consumer behavior analysis.
Ans: Rising demand for personalized customer experiences and growing e-commerce and social media engagement are the primary drivers fueling Web Analytics Market growth.
Ans: Search Engine Tracking and Ranking dominated by type in 2024 with a 31% share and is also projected to grow fastest at 20.41% CAGR.
Ans: North America led the Web Analytics Market in 2024 with a 40% revenue share, driven by early tech adoption and strong digital infrastructure.
Table of Contents:
1. Introduction
1.1 Market Definition
1.2 Scope (Inclusion and Exclusions)
1.3 Research Assumptions
2. Executive Summary
2.1 Market Overview
2.2 Regional Synopsis
2.3 Competitive Summary
3. Research Methodology
3.1 Top-Down Approach
3.2 Bottom-up Approach
3.3. Data Validation
3.4 Primary Interviews
4. Market Dynamics Impact Analysis
4.1 Market Driving Factors Analysis
4.1.1 Drivers
4.1.2 Restraints
4.2 PESTLE Analysis
4.3 Porter’s Five Forces Model
5. Statistical Insights and Trends Reporting
5.1 Data Volume & Processing Capacity
5.2 Customization & Integration
5.3 Tag Management & Tracking Codes
5.4 Security & Compliance
5.5 Tool-specific Metrics
6. Competitive Landscape
6.1 List of Major Companies, By Region
6.2 Market Share Analysis, By Region
6.3 Product Benchmarking
6.3.1 Product specifications and features
6.3.2 Pricing
6.4 Strategic Initiatives
6.4.1 Marketing and promotional activities
6.4.2 Distribution and supply chain strategies
6.4.3 Expansion plans and new product launches
6.4.4 Strategic partnerships and collaborations
6.5 Technological Advancements
6.6 Market Positioning and Branding
7. Web Analytics Market Segmentation, By Solution
7.1 Chapter Overview
7.2 Heatmap Analytics
7.2.1 Heatmap Analytics Market Trends Analysis (2020-2032)
7.2.2 Heatmap Analytics Market Size Estimates and Forecasts to 2032 (USD Billion)
7.3 Search Engine Tracking and Ranking
7.3.1 Search Engine Tracking and Ranking Market Trends Analysis (2020-2032)
7.3.2 Search Engine Tracking and Ranking Market Size Estimates and Forecasts to 2032 (USD Billion)
7.4 Marketing Automation
7.4.1 Marketing Automation Market Trends Analysis (2020-2032)
7.4.2 Marketing Automation Market Size Estimates and Forecasts to 2032 (USD Billion)
7.5 Behavior-based targeting
7.5.1 Behavior-based targeting Market Trends Analysis (2020-2032)
7.5.2 Behavior-based targeting Market Size Estimates and Forecasts to 2032 (USD Billion)
7.6 Others
7.6.1 Others Market Trends Analysis (2020-2032)
7.6.2 Others Market Size Estimates and Forecasts to 2032 (USD Billion)
8. Web Analytics Market Segmentation, By Vertical
8.1 Chapter Overview
8.2 BFSI
8.2.1 BFSI Market Trends Analysis (2020-2032)
8.2.2 BFSI Market Size Estimates And Forecasts To 2032 (USD Billion)
8.3 Healthcare
8.3.1 Healthcare Market Trends Analysis (2020-2032)
8.3.2 Healthcare Market Size Estimates And Forecasts To 2032 (USD Billion)
8.4 Retail & E-commerce
8.4.1 Retail & E-commerce Market Trends Analysis (2020-2032)
8.4.2 Retail & E-commerce Market Size Estimates And Forecasts To 2032 (USD Billion)
8.5 IT & Telecommunication
8.5.1 IT & Telecommunication Market Trends Analysis (2020-2032)
8.5.2 IT & Telecommunication Market Size Estimates And Forecasts To 2032 (USD Billion)
8.6 Government
8.6.1 Government Market Trends Analysis (2020-2032)
8.6.2 Government Market Size Estimates And Forecasts To 2032 (USD Billion)
8.7 Manufacturing
8.7.1 Manufacturing Market Trends Analysis (2020-2032)
8.7.2 Manufacturing Market Size Estimates And Forecasts To 2032 (USD Billion)
8.8 Others
8.8.1 Others Market Trends Analysis (2020-2032)
8.8.2 Others Market Size Estimates And Forecasts To 2032 (USD Billion)
9. Web Analytics Market Segmentation, By Application
9.1 Chapter Overview
9.2 Mobile Analytics
9.2.1 Mobile Analytics Market Trends Analysis (2020-2032)
9.2.2 Mobile Analytics Market Size Estimates And Forecasts To 2032 (USD Billion)
9.3 Online Marketing
9.3.1 Online Marketing Market Trends Analysis (2020-2032)
9.3.2 Online Marketing Market Size Estimates And Forecasts To 2032 (USD Billion)
9.4 Email Marketing
9.4.1 Email Marketing Market Trends Analysis (2020-2032)
9.4.2 Email Marketing Market Size Estimates And Forecasts To 2032 (USD Billion)
9.5 Social Media Analytics
9.5.1 Social Media Analytics Market Trends Analysis (2020-2032)
9.5.2 Social Media Analytics Market Size Estimates And Forecasts To 2032 (USD Billion)
9.6 Target & Behavioral Analysis
9.6.1 Target & Behavioral Analysis Market Trends Analysis (2020-2032)
9.6.2 Target & Behavioral Analysis Market Size Estimates And Forecasts To 2032 (USD Billion)
9.7 Display Advertising Optimization
9.7.1 Display Advertising Optimization Market Trends Analysis (2020-2032)
9.7.2 Display Advertising Optimization Market Size Estimates And Forecasts To 2032 (USD Billion)
9.8 Others
9.8.1 Others Market Trends Analysis (2020-2032)
9.8.2 Others Market Size Estimates And Forecasts To 2032 (USD Billion)
10. Web Analytics Market Segmentation, By Deployment Mode
10.1 Chapter Overview
10.2 Cloud
10.2.1 Cloud Market Trends Analysis (2020-2032)
10.2.2 Cloud Market Size Estimates And Forecasts To 2032 (USD Billion)
10.3 On-premises
10.3.1 On-premises Market Trends Analysis (2020-2032)
10.3.2 On-premises Market Size Estimates And Forecasts To 2032 (USD Billion)
11. Web Analytics Market Segmentation, By Enterprise Type
11.1 Chapter Overview
11.2 Small & Medium Enterprises
11.2.1 Small & Medium Enterprises Market Trends Analysis (2020-2032)
11.2.2 Small & Medium Enterprises Market Size Estimates And Forecasts To 2032 (USD Billion)
11.3 Large enterprises
11.3.1 Large enterprises Market Trends Analysis (2020-2032)
11.3.2 Large enterprises Market Size Estimates And Forecasts To 2032 (USD Billion)
12. Regional Analysis
12.1 Chapter Overview
12.2 North America
12.2.1 Trends Analysis
12.2.2 North America Web Analytics Market Estimates And Forecasts, By Country (2020-2032) (USD Billion)
12.2.3 North America Web Analytics Market Estimates And Forecasts, By Solution (2020-2032) (USD Billion)
12.2.4 North America Web Analytics Market Estimates And Forecasts, By Vertical (2020-2032) (USD Billion)
12.2.5 North America Web Analytics Market Estimates And Forecasts, By Application (2020-2032) (USD Billion)
12.2.6 North America Web Analytics Market Estimates And Forecasts, By Deployment Mode (2020-2032) (USD Billion)
12.2.7 North America Web Analytics Market Estimates And Forecasts, By Enterprise Type (2020-2032) (USD Billion)
12.2.8 USA
12.2.8.1 USA Web Analytics Market Estimates And Forecasts, By Solution (2020-2032) (USD Billion)
12.2.8.2 USA Web Analytics Market Estimates And Forecasts, By Vertical (2020-2032) (USD Billion)
12.2.8.3 USA Web Analytics Market Estimates And Forecasts, By Application (2020-2032) (USD Billion)
12.2.8.4 USA Web Analytics Market Estimates And Forecasts, By Deployment Mode (2020-2032) (USD Billion)
12.2.8.5 USA Web Analytics Market Estimates And Forecasts, By Enterprise Type (2020-2032) (USD Billion)
12.2.9 Canada
12.2.9.1 Canada Web Analytics Market Estimates And Forecasts, By Solution (2020-2032) (USD Billion)
12.2.9.2 Canada Web Analytics Market Estimates And Forecasts, By Vertical (2020-2032) (USD Billion)
12.2.9.3 Canada Web Analytics Market Estimates And Forecasts, By Application (2020-2032) (USD Billion)
12.2.9.4 Canada Web Analytics Market Estimates And Forecasts, By Deployment Mode (2020-2032) (USD Billion)
12.2.9.5 Canada Web Analytics Market Estimates And Forecasts, By Enterprise Type (2020-2032) (USD Billion)
12.2.10 Mexico
12.2.10.1 Mexico Web Analytics Market Estimates And Forecasts, By Solution (2020-2032) (USD Billion)
12.2.10.2 Mexico Web Analytics Market Estimates And Forecasts, By Vertical (2020-2032) (USD Billion)
12.2.10.3 Mexico Web Analytics Market Estimates And Forecasts, By Application (2020-2032) (USD Billion)
12.2.10.4 Mexico Web Analytics Market Estimates And Forecasts, By Deployment Mode (2020-2032) (USD Billion)
12.2.10.5 Mexico Web Analytics Market Estimates And Forecasts, By Enterprise Type (2020-2032) (USD Billion)
12.3 Europe
12.3.1 Trends Analysis
12.3.2 Eastern Europe Web Analytics Market Estimates And Forecasts, By Country (2020-2032) (USD Billion)
12.3.3 Eastern Europe Web Analytics Market Estimates And Forecasts, By Solution (2020-2032) (USD Billion)
12.3.4 Eastern Europe Web Analytics Market Estimates And Forecasts, By Vertical (2020-2032) (USD Billion)
12.3.5 Eastern Europe Web Analytics Market Estimates And Forecasts, By Application (2020-2032) (USD Billion)
12.3.6 Eastern Europe Web Analytics Market Estimates And Forecasts, By Deployment Mode (2020-2032) (USD Billion)
12.3.7 Eastern Europe Web Analytics Market Estimates And Forecasts, By Enterprise Type (2020-2032) (USD Billion)
12.3.8 Poland
12.3.8.1 Poland Web Analytics Market Estimates And Forecasts, By Solution (2020-2032) (USD Billion)
12.3.8.2 Poland Web Analytics Market Estimates And Forecasts, By Vertical (2020-2032) (USD Billion)
12.3.8.3 Poland Web Analytics Market Estimates And Forecasts, By Application (2020-2032) (USD Billion)
12.3.8.4 Poland Web Analytics Market Estimates And Forecasts, By Deployment Mode (2020-2032) (USD Billion)
12.3.8.5 Poland Web Analytics Market Estimates And Forecasts, By Enterprise Type (2020-2032) (USD Billion)
12.3.9 Turkey
12.3.9.1 Turkey Web Analytics Market Estimates And Forecasts, By Solution (2020-2032) (USD Billion)
12.3.9.2 Turkey Web Analytics Market Estimates And Forecasts, By Vertical (2020-2032) (USD Billion)
12.3.9.3 Turkey Web Analytics Market Estimates And Forecasts, By Application (2020-2032) (USD Billion)
12.3.9.4 Turkey Web Analytics Market Estimates And Forecasts, By Deployment Mode (2020-2032) (USD Billion)
12.3.9.5 Turkey Web Analytics Market Estimates And Forecasts, By Enterprise Type (2020-2032) (USD Billion)
12.3.10 Germany
12.3.10.1 Germany Web Analytics Market Estimates And Forecasts, By Solution (2020-2032) (USD Billion)
12.3.10.2 Germany Web Analytics Market Estimates And Forecasts, By Vertical (2020-2032) (USD Billion)
12.3.10.3 Germany Web Analytics Market Estimates And Forecasts, By Application (2020-2032) (USD Billion)
12.3.10.4 Germany Web Analytics Market Estimates And Forecasts, By Deployment Mode (2020-2032) (USD Billion)
12.3.10.5 Germany Web Analytics Market Estimates And Forecasts, By Enterprise Type (2020-2032) (USD Billion)
12.3.11 France
12.3.11.1 France Web Analytics Market Estimates And Forecasts, By Solution (2020-2032) (USD Billion)
12.3.11.2 France Web Analytics Market Estimates And Forecasts, By Vertical (2020-2032) (USD Billion)
12.3.11.3 France Web Analytics Market Estimates And Forecasts, By Application (2020-2032) (USD Billion)
12.3.11.4 France Web Analytics Market Estimates And Forecasts, By Deployment Mode (2020-2032) (USD Billion)
12.3.11.5 France Web Analytics Market Estimates And Forecasts, By Enterprise Type (2020-2032) (USD Billion)
12.3.12 UK
12.3.12.1 UK Web Analytics Market Estimates And Forecasts, By Solution (2020-2032) (USD Billion)
12.3.12.2 UK Web Analytics Market Estimates And Forecasts, By Vertical (2020-2032) (USD Billion)
12.3.12.3 UK Web Analytics Market Estimates And Forecasts, By Application (2020-2032) (USD Billion)
12.3.12.4 UK Web Analytics Market Estimates And Forecasts, By Deployment Mode (2020-2032) (USD Billion)
12.3.12.5 UK Web Analytics Market Estimates And Forecasts, By Enterprise Type (2020-2032) (USD Billion)
12.3.13 Italy
12.3.13.1 Italy Web Analytics Market Estimates And Forecasts, By Solution (2020-2032) (USD Billion)
12.3.13.2 Italy Web Analytics Market Estimates And Forecasts, By Vertical (2020-2032) (USD Billion)
12.3.13.3 Italy Web Analytics Market Estimates And Forecasts, By Application (2020-2032) (USD Billion)
12.3.13.4 Italy Web Analytics Market Estimates And Forecasts, By Deployment Mode (2020-2032) (USD Billion)
12.3.13.5 Italy Web Analytics Market Estimates And Forecasts, By Enterprise Type (2020-2032) (USD Billion)
12.3.14 Spain
12.3.14.1 Spain Web Analytics Market Estimates And Forecasts, By Solution (2020-2032) (USD Billion)
12.3.14.2 Spain Web Analytics Market Estimates And Forecasts, By Vertical (2020-2032) (USD Billion)
12.3.14.3 Spain Web Analytics Market Estimates And Forecasts, By Application (2020-2032) (USD Billion)
12.3.14.4 Spain Web Analytics Market Estimates And Forecasts, By Deployment Mode (2020-2032) (USD Billion)
12.3.14.5 Spain Web Analytics Market Estimates And Forecasts, By Enterprise Type (2020-2032) (USD Billion)
12.3.15 Rest Of Europe
12.3.15.1 Rest Of Western Europe Web Analytics Market Estimates And Forecasts, By Solution (2020-2032) (USD Billion)
12.3.15.2 Rest Of Western Europe Web Analytics Market Estimates And Forecasts, By Vertical (2020-2032) (USD Billion)
12.3.15.3 Rest Of Western Europe Web Analytics Market Estimates And Forecasts, By Application (2020-2032) (USD Billion)
12.3.15.4 Rest Of Western Europe Web Analytics Market Estimates And Forecasts, By Deployment Mode (2020-2032) (USD Billion)
12.3.15.5 Rest Of Western Europe Web Analytics Market Estimates And Forecasts, By Enterprise Type (2020-2032) (USD Billion)
12.4 Asia Pacific
12.4.1 Trends Analysis
12.4.2 Asia Pacific Web Analytics Market Estimates And Forecasts, By Country (2020-2032) (USD Billion)
12.4.3 Asia Pacific Web Analytics Market Estimates And Forecasts, By Solution (2020-2032) (USD Billion)
12.4.4 Asia Pacific Web Analytics Market Estimates And Forecasts, By Vertical (2020-2032) (USD Billion)
12.4.5 Asia Pacific Web Analytics Market Estimates And Forecasts, By Application (2020-2032) (USD Billion)
12.4.6 Asia Pacific Web Analytics Market Estimates And Forecasts, By Deployment Mode (2020-2032) (USD Billion)
12.4.7 Asia Pacific Web Analytics Market Estimates And Forecasts, By Enterprise Type (2020-2032) (USD Billion)
12.4.8 China
12.4.8.1 China Web Analytics Market Estimates And Forecasts, By Solution (2020-2032) (USD Billion)
12.4.8.2 China Web Analytics Market Estimates And Forecasts, By Vertical (2020-2032) (USD Billion)
12.4.8.3 China Web Analytics Market Estimates And Forecasts, By Application (2020-2032) (USD Billion)
12.4.8.4 China Web Analytics Market Estimates And Forecasts, By Deployment Mode (2020-2032) (USD Billion)
12.4.8.5 China Web Analytics Market Estimates And Forecasts, By Enterprise Type (2020-2032) (USD Billion)
12.4.9 India
12.4.9.1 India Web Analytics Market Estimates And Forecasts, By Solution (2020-2032) (USD Billion)
12.4.9.2 India Web Analytics Market Estimates And Forecasts, By Vertical (2020-2032) (USD Billion)
12.4.9.3 India Web Analytics Market Estimates And Forecasts, By Application (2020-2032) (USD Billion)
12.4.9.4 India Web Analytics Market Estimates And Forecasts, By Deployment Mode (2020-2032) (USD Billion)
12.4.9.5 India Web Analytics Market Estimates And Forecasts, By Enterprise Type (2020-2032) (USD Billion)
12.4.10 Japan
12.4.10.1 Japan Web Analytics Market Estimates And Forecasts, By Solution (2020-2032) (USD Billion)
12.4.10.2 Japan Web Analytics Market Estimates And Forecasts, By Vertical (2020-2032) (USD Billion)
12.4.10.3 Japan Web Analytics Market Estimates And Forecasts, By Application (2020-2032) (USD Billion)
12.4.10.4 Japan Web Analytics Market Estimates And Forecasts, By Deployment Mode (2020-2032) (USD Billion)
12.4.10.5 Japan Web Analytics Market Estimates And Forecasts, By Enterprise Type (2020-2032) (USD Billion)
12.4.11 South Korea
12.4.11.1 South Korea Web Analytics Market Estimates And Forecasts, By Solution (2020-2032) (USD Billion)
12.4.11.2 South Korea Web Analytics Market Estimates And Forecasts, By Vertical (2020-2032) (USD Billion)
12.4.11.3 South Korea Web Analytics Market Estimates And Forecasts, By Application (2020-2032) (USD Billion)
12.4.11.4 South Korea Web Analytics Market Estimates And Forecasts, By Deployment Mode (2020-2032) (USD Billion)
12.4.11.5 South Korea Web Analytics Market Estimates And Forecasts, By Enterprise Type (2020-2032) (USD Billion)
12.4.12 Singapore
12.4.12.1 Singapore Web Analytics Market Estimates And Forecasts, By Solution (2020-2032) (USD Billion)
12.4.12.2 Singapore Web Analytics Market Estimates And Forecasts, By Vertical (2020-2032) (USD Billion)
12.4.12.3 Singapore Web Analytics Market Estimates And Forecasts, By Application (2020-2032) (USD Billion)
12.4.12.4 Singapore Web Analytics Market Estimates And Forecasts, By Deployment Mode (2020-2032) (USD Billion)
12.4.12.5 Singapore Web Analytics Market Estimates And Forecasts, By Enterprise Type (2020-2032) (USD Billion)
12.4.13 Australia
12.4.13.1 Australia Web Analytics Market Estimates And Forecasts, By Solution (2020-2032) (USD Billion)
12.4.13.2 Australia Web Analytics Market Estimates And Forecasts, By Vertical (2020-2032) (USD Billion)
12.4.13.3 Australia Web Analytics Market Estimates And Forecasts, By Application (2020-2032) (USD Billion)
12.4.13.4 Australia Web Analytics Market Estimates And Forecasts, By Deployment Mode (2020-2032) (USD Billion)
12.4.13.5 Australia Web Analytics Market Estimates And Forecasts, By Enterprise Type (2020-2032) (USD Billion)
12.4.14 Rest Of Asia Pacific
12.4.14.1 Rest Of Asia Pacific Web Analytics Market Estimates And Forecasts, By Solution (2020-2032) (USD Billion)
12.4.14.2 Rest Of Asia Pacific Web Analytics Market Estimates And Forecasts, By Vertical (2020-2032) (USD Billion)
12.4.14.3 Rest Of Asia Pacific Web Analytics Market Estimates And Forecasts, By Application (2020-2032) (USD Billion)
12.4.14.4 Rest Of Asia Pacific Web Analytics Market Estimates And Forecasts, By Deployment Mode (2020-2032) (USD Billion)
12.4.14.5 Rest Of Asia Pacific Web Analytics Market Estimates And Forecasts, By Enterprise Type (2020-2032) (USD Billion)
12.5 Middle East And Africa
12.5.1 Trends Analysis
12.5.2 Middle East And Africa Web Analytics Market Estimates And Forecasts, By Country (2020-2032) (USD Billion)
12.5.3 Middle East And Africa Web Analytics Market Estimates And Forecasts, By Solution (2020-2032) (USD Billion)
12.5.4 Middle East And Africa Web Analytics Market Estimates And Forecasts, By Vertical (2020-2032) (USD Billion)
12.5.5 Middle East And Africa Web Analytics Market Estimates And Forecasts, By Application (2020-2032) (USD Billion)
12.5.6 Middle East And Africa Web Analytics Market Estimates And Forecasts, By Deployment Mode (2020-2032) (USD Billion)
12.5.7 Middle East And Africa Web Analytics Market Estimates And Forecasts, By Enterprise Type (2020-2032) (USD Billion)
12.5.8 UAE
12.5.8.1 UAE Web Analytics Market Estimates And Forecasts, By Solution (2020-2032) (USD Billion)
12.5.8.2 UAE Web Analytics Market Estimates And Forecasts, By Vertical (2020-2032) (USD Billion)
12.5.8.3 UAE Web Analytics Market Estimates And Forecasts, By Application (2020-2032) (USD Billion)
12.5.8.4 UAE Web Analytics Market Estimates And Forecasts, By Deployment Mode (2020-2032) (USD Billion)
12.5.8.5 UAE Web Analytics Market Estimates And Forecasts, By Enterprise Type (2020-2032) (USD Billion)
12.5.9 Saudi Arabia
12.5.9.1 Saudi Arabia Web Analytics Market Estimates And Forecasts, By Solution (2020-2032) (USD Billion)
12.5.9.2 Saudi Arabia Web Analytics Market Estimates And Forecasts, By Vertical (2020-2032) (USD Billion)
12.5.9.3 Saudi Arabia Web Analytics Market Estimates And Forecasts, By Application (2020-2032) (USD Billion)
12.5.9.4 Saudi Arabia Web Analytics Market Estimates And Forecasts, By Deployment Mode (2020-2032) (USD Billion)
12.5.9.5 Saudi Arabia Web Analytics Market Estimates And Forecasts, By Enterprise Type (2020-2032) (USD Billion)
12.5.10 Qatar
12.5.10.1 Qatar Web Analytics Market Estimates And Forecasts, By Solution (2020-2032) (USD Billion)
12.5.10.2 Qatar Web Analytics Market Estimates And Forecasts, By Vertical (2020-2032) (USD Billion)
12.5.10.3 Qatar Web Analytics Market Estimates And Forecasts, By Application (2020-2032) (USD Billion)
12.5.10.4 Qatar Web Analytics Market Estimates And Forecasts, By Deployment Mode (2020-2032) (USD Billion)
12.5.10.5 Qatar Web Analytics Market Estimates And Forecasts, By Enterprise Type (2020-2032) (USD Billion)
12.5.11 South Africa
12.5.11.1 South Africa Web Analytics Market Estimates And Forecasts, By Solution (2020-2032) (USD Billion)
12.5.11.2 South Africa Web Analytics Market Estimates And Forecasts, By Vertical (2020-2032) (USD Billion)
12.5.11.3 South Africa Web Analytics Market Estimates And Forecasts, By Application (2020-2032) (USD Billion)
12.5.11.4 South Africa Web Analytics Market Estimates And Forecasts, By Deployment Mode (2020-2032) (USD Billion)
12.5.11.5 South Africa Web Analytics Market Estimates And Forecasts, By Enterprise Type (2020-2032) (USD Billion)
12.5.12 Rest Of Africa
12.5.12.1 Rest Of Africa Web Analytics Market Estimates And Forecasts, By Solution (2020-2032) (USD Billion)
12.5.12.2 Rest Of Africa Web Analytics Market Estimates And Forecasts, By Vertical (2020-2032) (USD Billion)
12.5.12.3 Rest Of Africa Web Analytics Market Estimates And Forecasts, By Application (2020-2032) (USD Billion)
12.5.12.4 Rest Of Africa Web Analytics Market Estimates And Forecasts, By Deployment Mode (2020-2032) (USD Billion)
12.5.12.5 Rest Of Africa Web Analytics Market Estimates And Forecasts, By Enterprise Type (2020-2032) (USD Billion)
12.6 Latin America
12.6.1 Trends Analysis
12.6.2 Latin America Web Analytics Market Estimates And Forecasts, By Country (2020-2032) (USD Billion)
12.6.3 Latin America Web Analytics Market Estimates And Forecasts, By Solution (2020-2032) (USD Billion)
12.6.4 Latin America Web Analytics Market Estimates And Forecasts, By Vertical (2020-2032) (USD Billion)
12.6.5 Latin America Web Analytics Market Estimates And Forecasts, By Application (2020-2032) (USD Billion)
12.6.6 Latin America Web Analytics Market Estimates And Forecasts, By Deployment Mode (2020-2032) (USD Billion)
12.6.7 Latin America Web Analytics Market Estimates And Forecasts, By Enterprise Type (2020-2032) (USD Billion)
12.6.8 Brazil
12.6.8.1 Brazil Web Analytics Market Estimates And Forecasts, By Solution (2020-2032) (USD Billion)
12.6.8.2 Brazil Web Analytics Market Estimates And Forecasts, By Vertical (2020-2032) (USD Billion)
12.6.8.3 Brazil Web Analytics Market Estimates And Forecasts, By Application (2020-2032) (USD Billion)
12.6.8.4 Brazil Web Analytics Market Estimates And Forecasts, By Deployment Mode (2020-2032) (USD Billion)
12.6.8.5 Brazil Web Analytics Market Estimates And Forecasts, By Enterprise Type (2020-2032) (USD Billion)
12.6.9 Argentina
12.6.9.1 Argentina Web Analytics Market Estimates And Forecasts, By Solution (2020-2032) (USD Billion)
12.6.9.2 Argentina Web Analytics Market Estimates And Forecasts, By Vertical (2020-2032) (USD Billion)
12.6.9.3 Argentina Web Analytics Market Estimates And Forecasts, By Application (2020-2032) (USD Billion)
12.6.9.4 Argentina Web Analytics Market Estimates And Forecasts, By Deployment Mode (2020-2032) (USD Billion)
12.6.9.5 Argentina Web Analytics Market Estimates And Forecasts, By Enterprise Type (2020-2032) (USD Billion)
12.6.10 Rest Of Latin America
12.6.10.1 Rest Of Latin America Web Analytics Market Estimates And Forecasts, By Solution (2020-2032) (USD Billion)
12.6.10.2 Rest Of Latin America Web Analytics Market Estimates And Forecasts, By Vertical (2020-2032) (USD Billion)
12.6.10.3 Rest Of Latin America Web Analytics Market Estimates And Forecasts, By Application (2020-2032) (USD Billion)
12.6.10.4 Rest Of Latin America Web Analytics Market Estimates And Forecasts, By Deployment Mode (2020-2032) (USD Billion)
12.6.10.5 Rest Of Latin America Web Analytics Market Estimates And Forecasts, By Enterprise Type (2020-2032) (USD Billion)
13. Company Profiles
13.1 Google LLC
13.1.1 Company Overview
13.1.2 Financial
13.1.3 Products/ Services Offered
13.1.4 SWOT Analysis
13.2 matomo.org
13.2.1 Company Overview
13.2.2 Financial
13.2.3 Products/ Services Offered
13.2.4 SWOT Analysis
13.3 Adobe Inc
13.3.1 Company Overview
13.3.2 Financial
13.3.3 Products/ Services Offered
13.3.4 SWOT Analysis
13.4 Amplitude Inc.
13.4.1 Company Overview
13.4.2 Financial
13.4.3 Products/ Services Offered
13.4.4 SWOT Analysis
13.5 Sandstorm Analytics Inc
13.5.1 Company Overview
13.5.2 Financial
13.5.3 Products/ Services Offered
13.5.4 SWOT Analysis
13.6 Crazy Egg, Inc
13.6.1 Company Overview
13.6.2 Financial
13.6.3 Products/ Services Offered
13.6.4 SWOT Analysis
13.7 Glassbox Ltd
13.7.1 Company Overview
13.7.2 Financial
13.7.3 Products/ Services Offered
13.7.4 SWOT Analysis
13.8 Webtrends Inc
13.8.1 Company Overview
13.8.2 Financial
13.8.3 Products/ Services Offered
13.8.4 SWOT Analysis
13.9 Mouseflow, Inc
13.9.1 Company Overview
13.9.2 Financial
13.9.3 Products/ Services Offered
13.9.4 SWOT Analysis
13.10 Hotjar Ltd.
13.10.1 Company Overview
13.10.2 Financial
13.10.3 Products/ Services Offered
13.10.4 SWOT Analysis
14. Use Cases and Best Practices
15. Conclusion
An accurate research report requires proper strategizing as well as implementation. There are multiple factors involved in the completion of good and accurate research report and selecting the best methodology to compete the research is the toughest part. Since the research reports we provide play a crucial role in any company’s decision-making process, therefore we at SNS Insider always believe that we should choose the best method which gives us results closer to reality. This allows us to reach at a stage wherein we can provide our clients best and accurate investment to output ratio.
Each report that we prepare takes a timeframe of 350-400 business hours for production. Starting from the selection of titles through a couple of in-depth brain storming session to the final QC process before uploading our titles on our website we dedicate around 350 working hours. The titles are selected based on their current market cap and the foreseen CAGR and growth.
The 5 steps process:
Step 1: Secondary Research:
Secondary Research or Desk Research is as the name suggests is a research process wherein, we collect data through the readily available information. In this process we use various paid and unpaid databases which our team has access to and gather data through the same. This includes examining of listed companies’ annual reports, Journals, SEC filling etc. Apart from this our team has access to various associations across the globe across different industries. Lastly, we have exchange relationships with various university as well as individual libraries.
Step 2: Primary Research
When we talk about primary research, it is a type of study in which the researchers collect relevant data samples directly, rather than relying on previously collected data. This type of research is focused on gaining content specific facts that can be sued to solve specific problems. Since the collected data is fresh and first hand therefore it makes the study more accurate and genuine.
We at SNS Insider have divided Primary Research into 2 parts.
Part 1 wherein we interview the KOLs of major players as well as the upcoming ones across various geographic regions. This allows us to have their view over the market scenario and acts as an important tool to come closer to the accurate market numbers. As many as 45 paid and unpaid primary interviews are taken from both the demand and supply side of the industry to make sure we land at an accurate judgement and analysis of the market.
This step involves the triangulation of data wherein our team analyses the interview transcripts, online survey responses and observation of on filed participants. The below mentioned chart should give a better understanding of the part 1 of the primary interview.
Part 2: In this part of primary research the data collected via secondary research and the part 1 of the primary research is validated with the interviews from individual consultants and subject matter experts.
Consultants are those set of people who have at least 12 years of experience and expertise within the industry whereas Subject Matter Experts are those with at least 15 years of experience behind their back within the same space. The data with the help of two main processes i.e., FGDs (Focused Group Discussions) and IDs (Individual Discussions). This gives us a 3rd party nonbiased primary view of the market scenario making it a more dependable one while collation of the data pointers.
Step 3: Data Bank Validation
Once all the information is collected via primary and secondary sources, we run that information for data validation. At our intelligence centre our research heads track a lot of information related to the market which includes the quarterly reports, the daily stock prices, and other relevant information. Our data bank server gets updated every fortnight and that is how the information which we collected using our primary and secondary information is revalidated in real time.
Step 4: QA/QC Process
After all the data collection and validation our team does a final level of quality check and quality assurance to get rid of any unwanted or undesired mistakes. This might include but not limited to getting rid of the any typos, duplication of numbers or missing of any important information. The people involved in this process include technical content writers, research heads and graphics people. Once this process is completed the title gets uploader on our platform for our clients to read it.
Step 5: Final QC/QA Process:
This is the last process and comes when the client has ordered the study. In this process a final QA/QC is done before the study is emailed to the client. Since we believe in giving our clients a good experience of our research studies, therefore, to make sure that we do not lack at our end in any way humanly possible we do a final round of quality check and then dispatch the study to the client.
Key Segments:
By Solution
Heatmap Analytics
Search Engine Tracking and Ranking
Marketing Automation
Behavior-based targeting
Others
By Deployment
On-premise
Cloud
By Enterprise Type
Small & Medium Enterprises
Large Enterprises
By Application
Mobile Analytics
Online Marketing
Email Marketing
Social Media Analytics
Target & Behavioral Analysis
Display Advertising Optimization
Others
By Vertical
BFSI
Retail & E-commerce
Healthcare
Government
IT & Telecommunication
Manufacturing
Others
Request for Segment Customization as per your Business Requirement: Segment Customization Request
Regional Coverage:
North America
US
Canada
Mexico
Europe
Germany
France
UK
Italy
Spain
Poland
Turkey
Rest of Europe
Asia Pacific
China
India
Japan
South Korea
Singapore
Australia
Rest of Asia Pacific
Middle East & Africa
UAE
Saudi Arabia
Qatar
South Africa
Rest of Middle East & Africa
Latin America
Brazil
Argentina
Rest of Latin America
Request for Country Level Research Report: Country Level Customization Request
Available Customization
With the given market data, SNS Insider offers customization as per the company’s specific needs. The following customization options are available for the report:
Detailed Volume Analysis
Criss-Cross segment analysis (e.g. Product X Application)
Competitive Product Benchmarking
Geographic Analysis
Additional countries in any of the regions
Customized Data Representation
Detailed analysis and profiling of additional market players