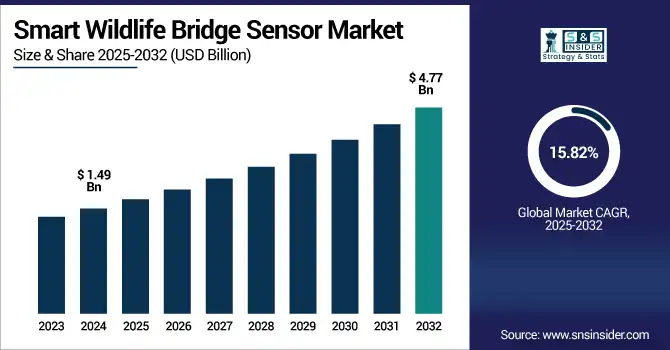
The Smart Wildlife Bridge Sensor Market Size was valued at USD 1.49 billion in 2024 and is expected to reach USD 4.77 billion by 2032 and grow at a CAGR of 15.82% over the forecast period 2025-2032.
Global Smart Wildlife Bridge Sensors Market includes market segmentation, regional dynamics, competitive landscape, and emerging technologies. This is driven by the growing emphasis on wildlife protection, road safety, and smart infrastructure. The increase in government initiatives for biodiversity safeguarding and ecosystem observation using sensor-based wildlife corridors is speeding up adoption. Conservation, transportation, and infrastructure, all these factors together contribute to the Global Smart Wildlife Bridge Sensor market growth across the world.
For instance, integration of AI and edge analytics in sensor networks has improved wildlife detection accuracy by over 60% in real-time deployments.
The U.S. Smart Wildlife Bridge Sensor Market size was USD 0.35 billion in 2024 and is expected to reach USD 1.09 billion by 2032, growing at a CAGR of 15.48% over the forecast period of 2025–2032.
The U.S. Market is growing significantly with increasing awareness of wildlife-vehicle collisions, rising ecological conservation efforts, and robust government support for smart infrastructure. The purpose of these sensors is to minimize road deaths and provide tracking live data on wildlife movement. Smart Wildlife Bridge Sensor Market analysis highlights evolving the U.S. adoption patterns driven by policy and innovation. The continual adoption of tech through national parks, department of transports, and infrastructure projects in line with various sustainability goals is yet increasing the demand of the market.
For instance, over 60% of the U.S. national parks adjacent to major highways have adopted or piloted smart sensor networks to reduce habitat fragmentation.
Key Drivers:
Rising Wildlife-Vehicle Collisions are Pushing Governments to Adopt Sensor-Based Bridge Solutions for Wildlife Protection and Road Safety.
Wildlife-vehicle collisions have devastating consequences for both human life and ecosystems. Many of developed and developing nations governments are also hitting their targets using smart bridge solutions with sensor technology to reduce these cases. The ability of these sensors to monitor wildlife, issue early alerts, and track movement will avoid potential crossings and allow for faster management by authorities. Additionally, insurance companies and road safety councils are promoting these solutions fueling the market growth and adoption at local and national levels.
For instance, authorities using real-time wildlife detection systems have reported a 60% improvement in response time to animal incursions on roads.
Restraints:
High Installation and Maintenance Costs of Smart Wildlife Sensors Limit Adoption Across Underfunded Regions and Remote Landscapes.
Smart wildlife bridge sensor technologies, while effective, come with high upfront costs, such as infrastructure modification, sensor calibration, and post-installation maintenance. Many conservation agencies, particularly those in developing countries and/or remote areas, do not have the money and technical assistance to implement widespread deployments. For instance, cost increases yet again when you throw in the need for maintenance in snowy mountains or tropical forests. Smart Wildlife Bridge Sensor Market trends indicate cost barriers remain a challenge. These nuances inhibit adoption in financially constrained gov departments and NGOs, limiting the market, and slow down sensors infusion to wildlife bridge projects.
Opportunities:
Technological Advancements in AI-Based Sensor Analytics Enhance Tracking, Prediction, and Response Capabilities in Wildlife Bridges.
Real-time detection, analysis, and response of movement patterns has been revolutionized through the application of artificial intelligence (AI), integrated with Wildlife sensors. With machine learning algorithms, it is now possible to identify species, predict migration patterns, and send warnings automatically upon detection. This capability enables proactive management of the ecosystem and prevents collisions with wildlife. The continuous innovation of the sensor hardware, cloud-based connectivity, and AI-based software renders these systems more intelligent and scalable thus exposing huge profits for the manufacturers and service providers in the market to build these solutions with advanced and data-driven conservation infrastructure.
For instance, the integration of machine learning has cut false-positive wildlife detection rates by more than 60% in multi-species zones.
Challenges:
Environmental Constraints and Terrain Variability Pose Difficulties in Deploying and Sustaining Sensor Networks Over Time.
Smart sensors need to walk in different areas including mountains, forests, wetlands, and each of those has unique environmental difficulties. Extreme weather, dense vegetation, wildlife tampering, and soil erosion may destroy or impair sensor operability. Moreover, battery technology and power supply constraints add additional problems in terms of operational deployment in off-grid areas. These operational challenges result in high O&M costs and complexity that can make continuous monitoring of these systems extremely difficult, presenting a major challenge for O&M. Some of these terrain-specific limitations will, however, need to be addressed so as to enable effective expansion of smart wildlife bridge sensor market.
By Type
In 2024, the Infrared Sensors had the highest Smart Wildlife Bridge Sensor Market share of around 29.50% due to their ability to detect objects in low light, and even nocturnal environments, better than any other types of sensors. This also enables them to work well in remote locations where a signal might be blocked. Due to their low-power consumption and high stability, these sensors are commonly selected for long-term deployment. There are some powerful infrared solutions from companies including Banner Engineering that engineers have used broadly for ecological bridge projects. They have rapidly become the standard globally for wildlife corridor projects due to their low cost and ease of integration.
Camera Sensors is anticipated to grow at a compound annual growth rate (CAGR) of 17.59% over 2024-2032, owing to increased adoption by detectives to determine species and analyze behavioral patterns. It is equipped with sensors that help confirm that the animals have crossed and it can also be used for conservation and research purposes due to its visual confirmation. Bushnell for its high-tech wildlife camera systems have been a big factor in this explosion. By integrating with AI technologies, the accuracy of the monitoring is improved which makes camera sensors an attractive observation tool for dynamic and real time ecological projects.
By Application
In 2024, Wildlife Monitoring accounted for the largest revenue share of 36.10%, attributed to the increasing interest to protect animal migration routes and reduce habitat fragmentation. Bridge sensors can be installed on a wide scale, as the need to monitor endangered species has become a global challenge. A key player in providing bioacoustic and sensor-based monitoring tools for these efforts is Wildlife Acoustics Inc. Solutions that provide high-quality movement information and ecological insights useful for policy now play an especially important role for park authorities, NGOs, and governments.
Environmental Monitoring is expected to witness the fastest CAGR of 17.64% during the period from 2024 to 2032, due to its increasing application for measuring environmental variables such as humidity, temperature, and air quality. Now these data points are used to assess the evolution of ecosystems under climate change and infrastructure stress. Smart Platforms for Real-Time Ecological Reporting Libelium is an IoT-based environmental sensors provider that supports these kinds of use cases, including reporting ecosystems in real time. They are being more frequently employed in adaptive management and policy development of conservation programs.
By Connectivity
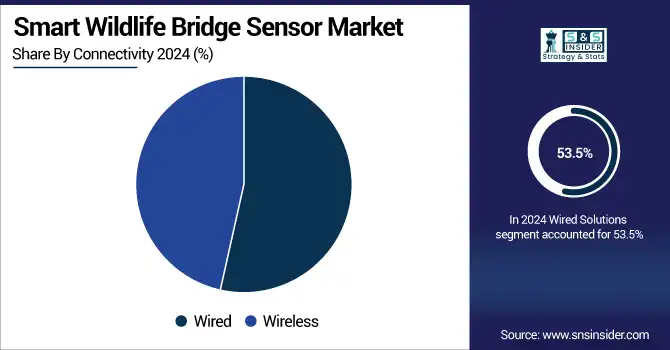
The wired solutions segment captured a 53.5% revenue share for a majority of the market in 2024, owing to the ability to allow a continuous influx of data, creating a real-time monitoring system that is dependable and consistent. Wired sensors are typically blitzed in high-traffic regions where long-term connectivity is necessary to protect wildlife in these areas. Schneider Electric, which has high-reliability industrial sensor systems, is one of the enablers of these technologies. Governments and agencies have responsible and safe either government solutions as their first choice for industries in sourcing development systems where infrastructure and utility are already established.
Wireless is expected to register the highest CAGR of 16.16% over 2024-2032 due to its convenience of deployment in off-grid or rugged terrain environments. Wireless systems have done away with the need for wiring which makes them great at quick installations. Hiber, a satellite-connected wireless sensor network company, facilitates enormous data transfer across terrestrial connections even in the most remote ecological bridges. It is this inherent flexibility which is promoting wireless systems in developed and emerging conservation markets.
By End-User
In 2024, Government Agencies emerged as the dominant revenue spender with a top market share of 38.5% for being the key implementers of wildlife protection programs at national and state levels and ecological safety civilization infrastructure. Funded by international agencies, these bodies place sensors to save bio-diversity and cut down accidents due to these heavy trucks. Many such departments use environmental sensors providing telemetry, such as those offered by Thermo Fisher Scientific, for data collection and real-time analysis. Their tools are essential for compliance with regulation and meaningful decisions about conservation policy for most jurisdictions.
Infrastructure Companies will witness a swift growth in the segment with a 18.48% CAGR over 2024-2032 due to the growing need of eco-design to fluff roads, tunnels, and railway projects. These companies are integrating smart sensors to help drive sustainability objectives and reduce environmental harm. Global infrastructure firm AECOM has taken an active role in moving wildlife bridges with built-in sensor technologies to new development areas. Their participation creates environmentally friendly construction and accelerates the growing market.
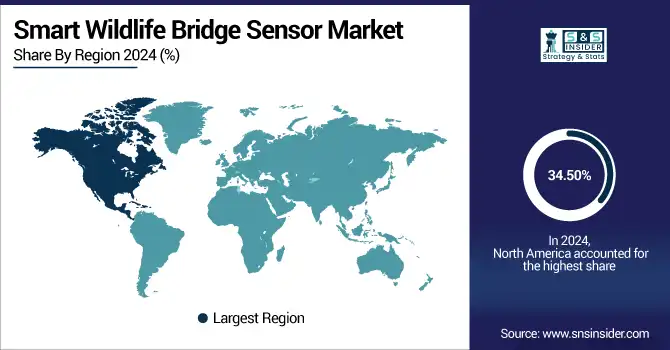
North America dominated the market with a revenue share of 34.50% in 2024 due to the support of effective conservation policies, technology leadership, and strong infrastructure. Now, to reduce wildlife-vehicle collisions and protect biodiversity, governments and environmental agencies all over the U.S. and Canada are using smart sensors to monitor wildlife on wildlife bridges. Another factor that contributes to the dominance of North America in the smart wildlife bridge sensor industry globally is the actuarial presence of leading sensor manufacturers and an increase in funding for ecological research.
The U.S. dominates the North American market due to extensive investment in smart infrastructure, strong governmental policies for wildlife conservation, and the widespread deployment of advanced sensor technologies across national parks, highways, and ecological bridges to prevent wildlife-vehicle collisions.
Asia Pacific is slated to witness the highest growth with a CAGR of 20.50% during the forecast period over 2024-2032 owing to fast infrastructural development, urbanization, and increasing environmental concern. China, India, and Australia are among the countries pouring resources into sensor-laden wildlife corridors designed to address biodiversity loss. Population growth and urbanization across developing regions is also driving demand at the regional level, with the potential for Asia Pacific to become the most lucrative growth frontier in this market through wide adoption of smart technologies in transportation planning and development supported by government-backed green infrastructure programs.
China leads the Asia Pacific market owing to large-scale infrastructure development, rising environmental awareness, and significant government funding for ecological protection. The country’s focus on smart cities and sustainable transport is accelerating the adoption of wildlife bridge sensors across expanding urban and rural corridors.
Europe is expected to hold significant share in the Smart Wildlife Bridge Sensor Market since, the region has strict environmental regulations and is known for conservation activities and investment in sustainable infrastructure. By contrast, nations, such as Germany, the Netherlands and Sweden are increasingly incorporating sensor-based wildlife crossings as part of the road network. EU encouragement, now both monetary and legislative, to protect biodiversity makes it easier to adopt technologies for more complex cross-border ecological connectivity projects.
Germany dominates the European Smart Wildlife Bridge Sensor Market due to its advanced infrastructure, strict environmental regulations, and proactive government initiatives. The country leads in deploying sensor-equipped wildlife bridges to reduce collisions and support biodiversity across highways and protected ecological zones.
The Middle East & Africa is experiencing growth attributed to the UAE investing in sustainable infrastructure and environmental preservation. Brazil ranks highest in Latin America on account of its natural diversity, and the increasing use of sensor technologies in ecological applications to safeguard wildlife at key habitats and major transportation corridors.
Major Key Players in Smart Wildlife Bridge Sensor companies are Banner Engineering, Bushnell Corporation, Wildlife Acoustics Inc., Libelium, Schneider Electric, Hiber, Thermo Fisher Scientific, AECOM, Rocky Mountain Instrument Co., and Sensara and others.
In November 2024, the University of Amsterdam implemented solar-powered wildlife camera arrays with AI detection that wirelessly transmit photos. Trials showed a 43% lifetime cost reduction and streamlined species monitoring via edge-AI.
In March 2025, IoT-enabled Reolink trail cameras with IR lighting were installed under 27 bridges to monitor bat activity. Data collected feeds a cloud dashboard (BatMap), demonstrating real-time bridge-based wildlife sensing.
Report Attributes | Details |
---|---|
Market Size in 2024 | USD 1.49 Billion |
Market Size by 2032 | USD 4.77 Billon |
CAGR | CAGR of 15.82% From 2025 to 2032 |
Base Year | 2024 |
Forecast Period | 2025-2032 |
Historical Data | 2021-2023 |
Report Scope & Coverage | Market Size, Segments Analysis, Competitive Landscape, Regional Analysis, DROC & SWOT Analysis, Forecast Outlook |
Key Segments | • By Type (Infrared Sensors, Motion Sensors, Camera Sensors, Acoustic Sensors, Others) • By Application (Wildlife Monitoring, Traffic Management, Bridge Safety, Environmental Monitoring, Others) • By Connectivity (Wired, Wireless) • By End-User (Government Agencies, Conservation Organizations, Research Institutes, Infrastructure Companies, Others) |
Regional Analysis/Coverage | North America (US, Canada, Mexico), Europe (Germany, France, UK, Italy, Spain, Poland, Turkey, Rest of Europe), Asia Pacific (China, India, Japan, South Korea, Singapore, Australia, Taiwan, Rest of Asia Pacific), Middle East & Africa (UAE, Saudi Arabia, Qatar, South Africa, Rest of Middle East & Africa), Latin America (Brazil, Argentina, Rest of Latin America) |
Company Profiles | FLIR Systems, Trailguard AI, Senstar Corporation, Axis Communications, Bosch Security and Safety Systems, Browning Trail Cameras, Wildlife Acoustics, Inc., HIKVISION, Panasonic Corporation and Reconyx Inc. |
Ans: The Smart Wildlife Bridge Sensor Market is expected to grow at a CAGR of 15.82 % from 2025-2032.
Ans: The Smart Wildlife Bridge Sensor Market size was USD 1.49 billion in 2024 and is expected to reach USD 4.77 billion by 2032.
Ans: Rising wildlife-vehicle collisions and increasing government investments in smart ecological infrastructure are driving demand for smart wildlife bridge sensors.
Ans: Infrared Sensors segment dominated the Smart Wildlife Bridge Sensor Market.
Ans: North America dominated the Smart Wildlife Bridge Sensor Market in 2024.
Table Of Content
1. Introduction
1.1 Market Definition
1.2 Scope (Inclusion and Exclusions)
1.3 Research Assumptions
2. Executive Summary
2.1 Market Overview
2.2 Regional Synopsis
2.3 Competitive Summary
3. Research Methodology
3.1 Top-Down Approach
3.2 Bottom-up Approach
3.3. Data Validation
3.4 Primary Interviews
4. Market Dynamics Impact Analysis
4.1 Market Driving Factors Analysis
4.1.1 Drivers
4.1.2 Restraints
4.1.3 Opportunities
4.1.4 Challenges
4.2 PESTLE Analysis
4.3 Porter’s Five Forces Model
5. Statistical Insights and Trends Reporting
5.1 Bridge Deployment Statistics
5.2 Sensor Utilization Metrics
5.3 Maintenance Cost Trends
5.4 Government Spending and Initiatives
5.5 Time-to-Response Metrics
5.6 Detection Accuracy Rate
6. Competitive Landscape
6.1 List of Major Companies By Region
6.2 Market Share Analysis By Region
6.3 Product Benchmarking
6.3.1 Product specifications and features
6.3.2 Pricing
6.4 Strategic Initiatives
6.4.1 Marketing and promotional activities
6.4.2 Distribution and Supply Chain Strategies
6.4.3 Expansion plans and new product launches
6.4.4 Strategic partnerships and collaborations
6.5 Technological Advancements
6.6 Market Positioning and Branding
7. Smart Wildlife Bridge Sensor Market Segmentation By Type
7.1 Chapter Overview
7.2 Infrared Sensors
7.2.1 Infrared Sensors Market Trends Analysis (2021-2032)
7.2.2 Infrared Sensors Market Size Estimates and Forecasts to 2032 (USD Billion)
7.3 Motion Sensors
7.3.1 Motion Sensors Market Trends Analysis (2021-2032)
7.3.2 Motion Sensors Market Size Estimates and Forecasts to 2032 (USD Billion)
7.4 Camera Sensors
7.4.1 Camera Sensors Market Trends Analysis (2021-2032)
7.4.2 Camera Sensors Market Size Estimates and Forecasts to 2032 (USD Billion)
7.5 Acoustic Sensors
7.5.1 Acoustic Sensors Market Trends Analysis (2021-2032)
7.5.2 Acoustic Sensors Market Size Estimates and Forecasts to 2032 (USD Billion)
7.6 Others
7.6.1 Others Market Trends Analysis (2021-2032)
7.6.2 Others Market Size Estimates and Forecasts to 2032 (USD Billion)
8. Smart Wildlife Bridge Sensor Market Segmentation By Application
8.1 Chapter Overview
8.2 Wildlife Monitoring
8.2.1 Wildlife Monitoring Market Trends Analysis (2021-2032)
8.2.2 Wildlife Monitoring Market Size Estimates and Forecasts to 2032 (USD Billion)
8.3 Traffic Management
8.3.1 Traffic Management Market Trends Analysis (2021-2032)
8.3.2 Traffic Management Market Size Estimates and Forecasts to 2032 (USD Billion)
8.4 Bridge Safety
8.4.1 Bridge Safety Market Trends Analysis (2021-2032)
8.4.2 Bridge Safety Market Size Estimates and Forecasts to 2032 (USD Billion)
8.5 Environmental Monitoring
8.5.1 Environmental Monitoring Market Trends Analysis (2021-2032)
8.5.2 Environmental Monitoring Market Size Estimates and Forecasts to 2032 (USD Billion)
8.6 Others
8.6.1 Others Market Trends Analysis (2021-2032)
8.6.2 Others Market Size Estimates and Forecasts to 2032 (USD Billion)
9. Smart Wildlife Bridge Sensor Market Segmentation By Connectivity
9.1 Chapter Overview
9.2 Wired
9.2.1 Wired Market Trends Analysis (2021-2032)
9.2.2 Wired Market Size Estimates and Forecasts to 2032 (USD Billion)
9.3 Wireless
9.3.1 Wireless Market Trends Analysis (2021-2032)
9.3.2 Wireless Market Size Estimates and Forecasts to 2032 (USD Billion)
10. Smart Wildlife Bridge Sensor Market Segmentation By End-User
10.1 Chapter Overview
10.2 Government Agencies
10.2.1 Government Agencies Market Trends Analysis (2021-2032)
10.2.2 Government Agencies Market Size Estimates and Forecasts to 2032 (USD Billion)
10.3 Conservation Organizations
10.3.1 Conservation Organizations Market Trend Analysis (2021-2032)
10.3.2 Conservation Organizations Market Size Estimates and Forecasts to 2032 (USD Billion)
10.4 Research Institutes
10.4.1 Research Institutes Market Trends Analysis (2021-2032)
10.4.2 Research Institutes Market Size Estimates and Forecasts to 2032 (USD Billion)
10.5 Infrastructure Companies
10.5.1 Infrastructure Companies Market Trends Analysis (2021-2032)
10.5.2 Infrastructure Companies Market Size Estimates and Forecasts to 2032 (USD Billion)
10.6 Others
10.6.1 Others Market Trends Analysis (2021-2032)
10.6.2 Others Market Size Estimates and Forecasts to 2032 (USD Billion)
11. Regional Analysis
11.1 Chapter Overview
11.2 North America
11.2.1 Trend Analysis
11.2.2 North America Smart Wildlife Bridge Sensor Market Estimates and Forecasts by Country (2021-2032) (USD Billion)
11.2.3 North America Smart Wildlife Bridge Sensor Market Estimates and Forecasts By Type (2021-2032) (USD Billion)
11.2.4 North America Smart Wildlife Bridge Sensor Market Estimates and Forecasts By Application (2021-2032) (USD Billion)
11.2.5 North America Smart Wildlife Bridge Sensor Market Estimates and Forecasts By Connectivity (2021-2032) (USD Billion)
11.2.6 North America Smart Wildlife Bridge Sensor Market Estimates and Forecasts By End-User (2021-2032) (USD Billion)
11.2.7 USA
11.2.7.1 USA Smart Wildlife Bridge Sensor Market Estimates and Forecasts By Type (2021-2032) (USD Billion)
11.2.7.2 USA Smart Wildlife Bridge Sensor Market Estimates and Forecasts By Application (2021-2032) (USD Billion)
11.2.7.3 USA Smart Wildlife Bridge Sensor Market Estimates and Forecasts By Connectivity (2021-2032) (USD Billion)
11.2.7.4 USA Smart Wildlife Bridge Sensor Market Estimates and Forecasts By End-User (2021-2032) (USD Billion)
11.2.8 Canada
11.2.8.1 Canada Smart Wildlife Bridge Sensor Market Estimates and Forecasts By Type (2021-2032) (USD Billion)
11.2.8.2 Canada Smart Wildlife Bridge Sensor Market Estimates and Forecasts By Application (2021-2032) (USD Billion)
11.2.8.3 Canada Smart Wildlife Bridge Sensor Market Estimates and Forecasts By Connectivity (2021-2032) (USD Billion)
11.2.8.4 Canada Smart Wildlife Bridge Sensor Market Estimates and Forecasts By End-User (2021-2032) (USD Billion)
11.2.9 Mexico
11.2.9.1 Mexico Smart Wildlife Bridge Sensor Market Estimates and Forecasts By Type (2021-2032) (USD Billion)
11.2.9.2 Mexico Smart Wildlife Bridge Sensor Market Estimates and Forecasts By Application (2021-2032) (USD Billion)
11.2.9.3 Mexico Smart Wildlife Bridge Sensor Market Estimates and Forecasts By Connectivity (2021-2032) (USD Billion)
11.2.9.4 Mexico Smart Wildlife Bridge Sensor Market Estimates and Forecasts By End-User (2021-2032) (USD Billion)
11.3 Europe
11.3.1 Trend Analysis
11.3.2 Europe Smart Wildlife Bridge Sensor Market Estimates and Forecasts by Country (2021-2032) (USD Billion)
11.3.3 Europe Smart Wildlife Bridge Sensor Market Estimates and Forecasts By Type (2021-2032) (USD Billion)
11.3.4 Europe Smart Wildlife Bridge Sensor Market Estimates and Forecasts By Application (2021-2032) (USD Billion)
11.3.5 Europe Smart Wildlife Bridge Sensor Market Estimates and Forecasts By Connectivity (2021-2032) (USD Billion)
11.3.6 Europe Smart Wildlife Bridge Sensor Market Estimates and Forecasts By End-User (2021-2032) (USD Billion)
11.3.7 Germany
11.3.7.1 Germany Smart Wildlife Bridge Sensor Market Estimates and Forecasts By Type (2021-2032) (USD Billion)
11.3.7.2 Germany Smart Wildlife Bridge Sensor Market Estimates and Forecasts By Application (2021-2032) (USD Billion)
11.3.7.3 Germany Smart Wildlife Bridge Sensor Market Estimates and Forecasts By Connectivity (2021-2032) (USD Billion)
11.3.7.4 Germany Smart Wildlife Bridge Sensor Market Estimates and Forecasts By End-User (2021-2032) (USD Billion)
11.3.8 France
11.3.8.1 France Smart Wildlife Bridge Sensor Market Estimates and Forecasts By Type (2021-2032) (USD Billion)
11.3.8.2 France Smart Wildlife Bridge Sensor Market Estimates and Forecasts By Application (2021-2032) (USD Billion)
11.3.8.3 France Smart Wildlife Bridge Sensor Market Estimates and Forecasts By Connectivity (2021-2032) (USD Billion)
11.3.8.4 France Smart Wildlife Bridge Sensor Market Estimates and Forecasts By End-User (2021-2032) (USD Billion)
11.3.9 UK
11.3.9.1 UK Smart Wildlife Bridge Sensor Market Estimates and Forecasts By Type (2021-2032) (USD Billion)
11.3.9.2 UK Smart Wildlife Bridge Sensor Market Estimates and Forecasts By Application (2021-2032) (USD Billion)
11.3.9.3 UK Smart Wildlife Bridge Sensor Market Estimates and Forecasts By Connectivity (2021-2032) (USD Billion)
11.3.9.4 UK Smart Wildlife Bridge Sensor Market Estimates and Forecasts By End-User (2021-2032) (USD Billion)
11.3.10 Italy
11.3.10.1 ItalySmart Wildlife Bridge Sensor Market Estimates and Forecasts By Type (2021-2032) (USD Billion)
11.3.10.2 Italy Smart Wildlife Bridge Sensor Market Estimates and Forecasts By Application (2021-2032) (USD Billion)
11.3.10.3 Italy Smart Wildlife Bridge Sensor Market Estimates and Forecasts By Connectivity (2021-2032) (USD Billion)
11.3.10.4 Italy Smart Wildlife Bridge Sensor Market Estimates and Forecasts By End-User (2021-2032) (USD Billion)
11.3.11 Spain
11.3.11.1 Spain Smart Wildlife Bridge Sensor Market Estimates and Forecasts By Type (2021-2032) (USD Billion)
11.3.11.2 Spain Smart Wildlife Bridge Sensor Market Estimates and Forecasts By Application (2021-2032) (USD Billion)
11.3.11.3 Spain Smart Wildlife Bridge Sensor Market Estimates and Forecasts By Connectivity (2021-2032) (USD Billion)
11.3.11.4 Spain Smart Wildlife Bridge Sensor Market Estimates and Forecasts By End-User (2021-2032) (USD Billion)
11.3.12 Poland
11.3.12.1 Poland Smart Wildlife Bridge Sensor Market Estimates and Forecasts By Type (2021-2032) (USD Billion)
11.3.12.2 Poland Smart Wildlife Bridge Sensor Market Estimates and Forecasts By Application (2021-2032) (USD Billion)
11.3.12.3 Poland Smart Wildlife Bridge Sensor Market Estimates and Forecasts By Connectivity (2021-2032) (USD Billion)
11.3.12.4 Poland Smart Wildlife Bridge Sensor Market Estimates and Forecasts By End-User (2021-2032) (USD Billion)
11.3.13 Turkey
11.3.13.1 Turkey Smart Wildlife Bridge Sensor Market Estimates and Forecasts By Type (2021-2032) (USD Billion)
11.3.13.2 Turkey Smart Wildlife Bridge Sensor Market Estimates and Forecasts By Application (2021-2032) (USD Billion)
11.3.13.3 Turkey Smart Wildlife Bridge Sensor Market Estimates and Forecasts By Connectivity (2021-2032) (USD Billion)
11.3.13.4 Turkey Smart Wildlife Bridge Sensor Market Estimates and Forecasts By End-User (2021-2032) (USD Billion)
11.3.14 Rest of Europe
11.3.14.1 Rest of Europe Smart Wildlife Bridge Sensor Market Estimates and Forecasts By Type (2021-2032) (USD Billion)
11.3.14.2 Rest of Europe Smart Wildlife Bridge Sensor Market Estimates and Forecasts By Application (2021-2032) (USD Billion)
11.3.14.3 Rest of Europe Smart Wildlife Bridge Sensor Market Estimates and Forecasts By Connectivity (2021-2032) (USD Billion)
11.3.14.4 Rest of Europe Smart Wildlife Bridge Sensor Market Estimates and Forecasts By End-User (2021-2032) (USD Billion)
11.4 Asia Pacific
11.4.1 Trend Analysis
11.4.2 Asia Pacific Smart Wildlife Bridge Sensor Market Estimates and Forecasts by Country (2021-2032) (USD Billion)
11.4.3 Asia Pacific Smart Wildlife Bridge Sensor Market Estimates and Forecasts By Type (2021-2032) (USD Billion)
11.4.4 Asia Pacific Smart Wildlife Bridge Sensor Market Estimates and Forecasts By Application (2021-2032) (USD Billion)
11.4.5 Asia Pacific Smart Wildlife Bridge Sensor Market Estimates and Forecasts By Connectivity (2021-2032) (USD Billion)
11.4.6 Asia Pacific Smart Wildlife Bridge Sensor Market Estimates and Forecasts By End-User (2021-2032) (USD Billion)
11.4.7 China
11.4.7.1 China Smart Wildlife Bridge Sensor Market Estimates and Forecasts By Type (2021-2032) (USD Billion)
11.4.7.2 China Smart Wildlife Bridge Sensor Market Estimates and Forecasts By Application (2021-2032) (USD Billion)
11.4.7.3 China Smart Wildlife Bridge Sensor Market Estimates and Forecasts By Connectivity (2021-2032) (USD Billion)
11.4.7.4 China Smart Wildlife Bridge Sensor Market Estimates and Forecasts By End-User (2021-2032) (USD Billion)
11.4.8 India
11.4.8.1 India Smart Wildlife Bridge Sensor Market Estimates and Forecasts By Type (2021-2032) (USD Billion)
11.4.8.2 India Smart Wildlife Bridge Sensor Market Estimates and Forecasts By Application (2021-2032) (USD Billion)
11.4.8.3 India Smart Wildlife Bridge Sensor Market Estimates and Forecasts By Connectivity (2021-2032) (USD Billion)
11.4.8.4 India Smart Wildlife Bridge Sensor Market Estimates and Forecasts By End-User (2021-2032) (USD Billion)
11.4.9 Japan
11.4.9.1 Japan Smart Wildlife Bridge Sensor Market Estimates and Forecasts By Type (2021-2032) (USD Billion)
11.4.9.2 Japan Smart Wildlife Bridge Sensor Market Estimates and Forecasts By Application (2021-2032) (USD Billion)
11.4.9.3 Japan Smart Wildlife Bridge Sensor Market Estimates and Forecasts By Connectivity (2021-2032) (USD Billion)
11.4.9.4 Japan Smart Wildlife Bridge Sensor Market Estimates and Forecasts By End-User (2021-2032) (USD Billion)
11.4.10 South Korea
11.4.10.1 South Korea Smart Wildlife Bridge Sensor Market Estimates and Forecasts By Type (2021-2032) (USD Billion)
11.4.10.2 South Korea Smart Wildlife Bridge Sensor Market Estimates and Forecasts By Application (2021-2032) (USD Billion)
11.4.10.3 South Korea Smart Wildlife Bridge Sensor Market Estimates and Forecasts By Connectivity (2021-2032) (USD Billion)
11.4.10.4 South Korea Smart Wildlife Bridge Sensor Market Estimates and Forecasts By End-User (2021-2032) (USD Billion)
11.4.11 Singapore
11.4.11.1 Singapore Smart Wildlife Bridge Sensor Market Estimates and Forecasts By Type (2021-2032) (USD Billion)
11.4.11.2 Singapore Smart Wildlife Bridge Sensor Market Estimates and Forecasts By Application (2021-2032) (USD Billion)
11.4.11.3 Singapore Smart Wildlife Bridge Sensor Market Estimates and Forecasts By Connectivity (2021-2032) (USD Billion)
11.4.11.4 Singapore Smart Wildlife Bridge Sensor Market Estimates and Forecasts By End-User (2021-2032) (USD Billion)
11.4.12 Australia
11.4.12.1 Australia Smart Wildlife Bridge Sensor Market Estimates and Forecasts By Type (2021-2032) (USD Billion)
11.4.12.2 Australia Smart Wildlife Bridge Sensor Market Estimates and Forecasts By Application (2021-2032) (USD Billion)
11.4.12.3 Australia Smart Wildlife Bridge Sensor Market Estimates and Forecasts By Connectivity (2021-2032) (USD Billion)
11.4.12.4 Australia Smart Wildlife Bridge Sensor Market Estimates and Forecasts By End-User (2021-2032) (USD Billion)
11.4.13 Taiwan
11.4.13.1 Taiwan Smart Wildlife Bridge Sensor Market Estimates and Forecasts By Type (2021-2032) (USD Billion)
11.4.13.2 Taiwan Smart Wildlife Bridge Sensor Market Estimates and Forecasts By Application (2021-2032) (USD Billion)
11.4.13.3 Taiwan Smart Wildlife Bridge Sensor Market Estimates and Forecasts By Connectivity (2021-2032) (USD Billion)
11.4.13.4 Taiwan Smart Wildlife Bridge Sensor Market Estimates and Forecasts By End-User (2021-2032) (USD Billion)
11.4.14 Rest of Asia Pacific
11.4.14.1 Rest of Asia Pacific Smart Wildlife Bridge Sensor Market Estimates and Forecasts By Type (2021-2032) (USD Billion)
11.4.14.2 Rest of Asia Pacific Smart Wildlife Bridge Sensor Market Estimates and Forecasts By Application (2021-2032) (USD Billion)
11.4.14.3 Rest of Asia Pacific Smart Wildlife Bridge Sensor Market Estimates and Forecasts By Connectivity (2021-2032) (USD Billion)
11.4.14.4 Rest of Asia Pacific Smart Wildlife Bridge Sensor Market Estimates and Forecasts By End-User (2021-2032) (USD Billion)
11.5 Middle East and Africa
11.5.1 Trend Analysis
11.5.2 Middle East and Africa Smart Wildlife Bridge Sensor Market Estimates and Forecasts by Country (2021-2032) (USD Billion)
11.5.3 Middle East and Africa Smart Wildlife Bridge Sensor Market Estimates and Forecasts By Type (2021-2032) (USD Billion)
11.5.4 Middle East and Africa Smart Wildlife Bridge Sensor Market Estimates and Forecasts By Application (2021-2032) (USD Billion)
11.5.5 Middle East and Africa Smart Wildlife Bridge Sensor Market Estimates and Forecasts By Connectivity (2021-2032) (USD Billion)
11.5.6 Middle East and Africa Smart Wildlife Bridge Sensor Market Estimates and Forecasts By End-User (2021-2032) (USD Billion)
11.5.7 UAE
11.5.7.1 UAE Smart Wildlife Bridge Sensor Market Estimates and Forecasts By Type (2021-2032) (USD Billion)
11.5.7.2 UAE Smart Wildlife Bridge Sensor Market Estimates and Forecasts By Application (2021-2032) (USD Billion)
11.5.7.3 UAE Smart Wildlife Bridge Sensor Market Estimates and Forecasts By Connectivity (2021-2032) (USD Billion)
11.5.7.4 UAE Smart Wildlife Bridge Sensor Market Estimates and Forecasts By End-User (2021-2032) (USD Billion)
11.5.8 Saudi Arabia
11.5.8.1 Saudi Arabia Smart Wildlife Bridge Sensor Market Estimates and Forecasts By Type (2021-2032) (USD Billion)
11.5.8.2 Saudi Arabia Smart Wildlife Bridge Sensor Market Estimates and Forecasts By Application (2021-2032) (USD Billion)
11.5.8.3 Saudi Arabia Smart Wildlife Bridge Sensor Market Estimates and Forecasts By Connectivity (2021-2032) (USD Billion)
11.5.8.4 Saudi Arabia Smart Wildlife Bridge Sensor Market Estimates and Forecasts By End-User (2021-2032) (USD Billion)
11.5.9 Qatar
11.5.9.1 Qatar Smart Wildlife Bridge Sensor Market Estimates and Forecasts By Type (2021-2032) (USD Billion)
11.5.9.2 Qatar Smart Wildlife Bridge Sensor Market Estimates and Forecasts By Application (2021-2032) (USD Billion)
11.5.9.3 Qatar Smart Wildlife Bridge Sensor Market Estimates and Forecasts By Connectivity (2021-2032) (USD Billion)
11.5.1.9.4 Qatar Smart Wildlife Bridge Sensor Market Estimates and Forecasts By End-User (2021-2032) (USD Billion)
11.5.10 South Africa
11.5.10.1 South Africa Smart Wildlife Bridge Sensor Market Estimates and Forecasts By Type (2021-2032) (USD Billion)
11.5.10.2 South Africa Smart Wildlife Bridge Sensor Market Estimates and Forecasts By Application (2021-2032) (USD Billion)
11.5.10.3 South Africa Smart Wildlife Bridge Sensor Market Estimates and Forecasts By Connectivity (2021-2032) (USD Billion)
11.5.10.4 South Africa Smart Wildlife Bridge Sensor Market Estimates and Forecasts By End-User (2021-2032) (USD Billion)
11.5.11 Rest of Middle East & Africa
11.5.11.1 Rest of Middle East & Africa Smart Wildlife Bridge Sensor Market Estimates and Forecasts By Type (2021-2032) (USD Billion)
11.5.11.2 Rest of Middle East & Africa Smart Wildlife Bridge Sensor Market Estimates and Forecasts By Application (2021-2032) (USD Billion)
11.5.11.3 Rest of Middle East & Africa Smart Wildlife Bridge Sensor Market Estimates and Forecasts By Connectivity (2021-2032) (USD Billion)
11.5.11.4 Rest of Middle East & Africa Smart Wildlife Bridge Sensor Market Estimates and Forecasts By End-User (2021-2032) (USD Billion)
11.6 Latin America
11.6.1 Trend Analysis
11.6.2 Latin America Smart Wildlife Bridge Sensor Market Estimates and Forecasts by Country (2021-2032) (USD Billion)
11.6.3 Latin America Smart Wildlife Bridge Sensor Market Estimates and Forecasts By Type (2021-2032) (USD Billion)
11.6.4 Latin America Smart Wildlife Bridge Sensor Market Estimates and Forecasts By Application (2021-2032) (USD Billion)
11.6.5 Latin America Smart Wildlife Bridge Sensor Market Estimates and Forecasts By Connectivity (2021-2032) (USD Billion)
11.6.6 Latin America Smart Wildlife Bridge Sensor Market Estimates and Forecasts By End-User (2021-2032) (USD Billion)
11.6.7 Brazil
11.6.7.1 Brazil Smart Wildlife Bridge Sensor Market Estimates and Forecasts By Type (2021-2032) (USD Billion)
11.6.7.2 Brazil Smart Wildlife Bridge Sensor Market Estimates and Forecasts By Application (2021-2032) (USD Billion)
11.6.7.3 Brazil Smart Wildlife Bridge Sensor Market Estimates and Forecasts By Connectivity (2021-2032) (USD Billion)
11.6.7.4 Brazil Smart Wildlife Bridge Sensor Market Estimates and Forecasts By End-User (2021-2032) (USD Billion)
11.6.8 Argentina
11.6.8.1 Argentina Smart Wildlife Bridge Sensor Market Estimates and Forecasts By Type (2021-2032) (USD Billion)
11.6.8.2 Argentina Smart Wildlife Bridge Sensor Market Estimates and Forecasts By Application (2021-2032) (USD Billion)
11.6.8.3 Argentina Smart Wildlife Bridge Sensor Market Estimates and Forecasts By Connectivity (2021-2032) (USD Billion)
11.6.8.4 Argentina Smart Wildlife Bridge Sensor Market Estimates and Forecasts By End-User (2021-2032) (USD Billion)
11.6.9 Rest of Latin America
11.6.9.1 Rest of Latin America Smart Wildlife Bridge Sensor Market Estimates and Forecasts By Type (2021-2032) (USD Billion)
11.6.9.2 Rest of Latin America Smart Wildlife Bridge Sensor Market Estimates and Forecasts By Application (2021-2032) (USD Billion)
11.6.9.3 Rest of Latin America Smart Wildlife Bridge Sensor Market Estimates and Forecasts By Connectivity (2021-2032) (USD Billion)
11.6.9.4 Rest of Latin America Smart Wildlife Bridge Sensor Market Estimates and Forecasts By End-User (2021-2032) (USD Billion)
12. Company Profiles
12.1 FLIR Systems
12.1.1 Company Overview
12.1.2 Financial
12.1.3 Products/ Services Offered
12.1.4 SWOT Analysis
12.2 Trailguard AI
12.2.1 Company Overview
12.2.2 Financial
12.2.3 Products/ Services Offered
12.2.4 SWOT Analysis
12.3 Senstar Corporation
12.3.1 Company Overview
12.3.2 Financial
12.3.3 Products/ Services Offered
12.3.4 SWOT Analysis
12.4 Axis Communications
12.4.1 Company Overview
12.4.2 Financial
12.4.3 Products/ Services Offered
12.4.4 SWOT Analysis
12.5 Bosch Security and Safety Systems
12.5.1 Company Overview
12.5.2 Financial
12.5.3 Products/ Services Offered
12.5.4 SWOT Analysis
12.6 Browning Trail Cameras
12.6.1 Company Overview
12.6.2 Financial
12.6.3 Products/ Services Offered
12.6.4 SWOT Analysis
12.7 Wildlife Acoustics, Inc.
12.7.1 Company Overview
12.7.2 Financial
12.7.3 Products/ Services Offered
12.7.4 SWOT Analysis
12.8 HIKVISION
12.8.1 Company Overview
12.8.2 Financial
12.8.3 Products/ Services Offered
12.8.4 SWOT Analysis
12.9 Panasonic Corporation
12.9.1 Company Overview
12.9.2 Financial
12.9.3 Products/ Services Offered
12.9.4 SWOT Analysis
12.10 Reconyx Inc.
12.10.1 Company Overview
12.10.2 Financial
12.10.3 Products/ Services Offered
12.10.4 SWOT Analysis
13. Use Cases and Best Practices
14. Conclusion
An accurate research report requires proper strategizing as well as implementation. There are multiple factors involved in the completion of good and accurate research report and selecting the best methodology to compete the research is the toughest part. Since the research reports we provide play a crucial role in any company’s decision-making process, therefore we at SNS Insider always believe that we should choose the best method which gives us results closer to reality. This allows us to reach at a stage wherein we can provide our clients best and accurate investment to output ratio.
Each report that we prepare takes a timeframe of 350-400 business hours for production. Starting from the selection of titles through a couple of in-depth brain storming session to the final QC process before uploading our titles on our website we dedicate around 350 working hours. The titles are selected based on their current market cap and the foreseen CAGR and growth.
The 5 steps process:
Step 1: Secondary Research:
Secondary Research or Desk Research is as the name suggests is a research process wherein, we collect data through the readily available information. In this process we use various paid and unpaid databases which our team has access to and gather data through the same. This includes examining of listed companies’ annual reports, Journals, SEC filling etc. Apart from this our team has access to various associations across the globe across different industries. Lastly, we have exchange relationships with various university as well as individual libraries.
Step 2: Primary Research
When we talk about primary research, it is a type of study in which the researchers collect relevant data samples directly, rather than relying on previously collected data. This type of research is focused on gaining content specific facts that can be sued to solve specific problems. Since the collected data is fresh and first hand therefore it makes the study more accurate and genuine.
We at SNS Insider have divided Primary Research into 2 parts.
Part 1 wherein we interview the KOLs of major players as well as the upcoming ones across various geographic regions. This allows us to have their view over the market scenario and acts as an important tool to come closer to the accurate market numbers. As many as 45 paid and unpaid primary interviews are taken from both the demand and supply side of the industry to make sure we land at an accurate judgement and analysis of the market.
This step involves the triangulation of data wherein our team analyses the interview transcripts, online survey responses and observation of on filed participants. The below mentioned chart should give a better understanding of the part 1 of the primary interview.
Part 2: In this part of primary research the data collected via secondary research and the part 1 of the primary research is validated with the interviews from individual consultants and subject matter experts.
Consultants are those set of people who have at least 12 years of experience and expertise within the industry whereas Subject Matter Experts are those with at least 15 years of experience behind their back within the same space. The data with the help of two main processes i.e., FGDs (Focused Group Discussions) and IDs (Individual Discussions). This gives us a 3rd party nonbiased primary view of the market scenario making it a more dependable one while collation of the data pointers.
Step 3: Data Bank Validation
Once all the information is collected via primary and secondary sources, we run that information for data validation. At our intelligence centre our research heads track a lot of information related to the market which includes the quarterly reports, the daily stock prices, and other relevant information. Our data bank server gets updated every fortnight and that is how the information which we collected using our primary and secondary information is revalidated in real time.
Step 4: QA/QC Process
After all the data collection and validation our team does a final level of quality check and quality assurance to get rid of any unwanted or undesired mistakes. This might include but not limited to getting rid of the any typos, duplication of numbers or missing of any important information. The people involved in this process include technical content writers, research heads and graphics people. Once this process is completed the title gets uploader on our platform for our clients to read it.
Step 5: Final QC/QA Process:
This is the last process and comes when the client has ordered the study. In this process a final QA/QC is done before the study is emailed to the client. Since we believe in giving our clients a good experience of our research studies, therefore, to make sure that we do not lack at our end in any way humanly possible we do a final round of quality check and then dispatch the study to the client.
Key Segments:
By Type
Infrared Sensors
Motion Sensors
Camera Sensors
Acoustic Sensors
Others
By Application
Wildlife Monitoring
Traffic Management
Bridge Safety
Environmental Monitoring
Others
By Connectivity
Wired
Wireless
By End-User
Government Agencies
Conservation Organizations
Research Institutes
Infrastructure Companies
Others
Request for Segment Customization as per your Business Requirement: Segment Customization Request
Regional Coverage:
North America
US
Canada
Mexico
Europe
Germany
France
UK
Italy
Spain
Poland
Turkey
Rest of Europe
Asia Pacific
China
India
Japan
South Korea
Singapore
Australia
Taiwan
Rest of Asia Pacific
Middle East & Africa
UAE
Saudi Arabia
Qatar
South Africa
Rest of Middle East & Africa
Latin America
Brazil
Argentina
Rest of Latin America
Request for Country Level Research Report: Country Level Customization Request
Available Customization
With the given market data, SNS Insider offers customization as per the company’s specific needs. The following customization options are available for the report:
Detailed Volume Analysis
Criss-Cross segment analysis (e.g. Product X Application)
Competitive Product Benchmarking
Geographic Analysis
Additional countries in any of the regions
Customized Data Representation
Detailed analysis and profiling of additional market players