Fraud Detection and Prevention Market Report Scope & Overview:
Get More Information on Fraud Detection and Prevention Market - Request Sample Report
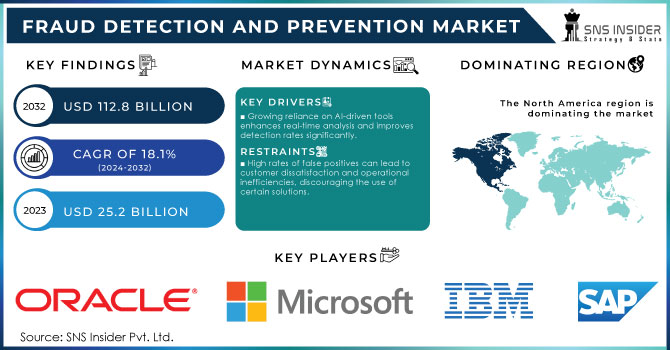
Fraud Detection and Prevention Market was valued at USD 25.2 billion in 2023 and is expected to reach USD 112.8 billion by 2032, growing at a CAGR of 18.1% from 2024-2032.
The fraud detection and prevention market is rapidly expanding, driven by the increasing frequency and sophistication of fraudulent activities across various sectors. As businesses and consumers move online, the financial losses associated with fraud have surged. The rising adoption of digital payment methods is a significant driver. With the global digital payment market projected to exceed $10 trillion by 2025, the need for robust fraud detection systems to safeguard transactions becomes imperative. The increasing volume of online transactions creates more opportunities for fraudsters, making advanced detection tools essential for businesses. Moreover, regulatory compliance is pushing organizations to invest in fraud detection solutions. Stricter regulations, such as the General Data Protection Regulation (GDPR) and the Payment Card Industry Data Security Standard (PCI DSS), necessitate the implementation of comprehensive fraud prevention measures. A survey by PwC found that 47% of organizations faced challenges in adhering to these regulations, highlighting the need for effective detection systems to mitigate compliance risks.
The growing sophistication of fraud schemes also fuels market growth. Cybercriminals are leveraging advanced technologies, such as AI and machine learning, to devise more complex fraud tactics. As a result, businesses are increasingly adopting AI-driven fraud detection tools. The use of machine learning algorithms, which can analyze large datasets in real time, is anticipated to improve detection rates significantly. Additionally, the rising awareness among consumers about fraud risks is prompting organizations to prioritize prevention measures. Businesses are investing in education and technology to build trust with their customers. The global push for enhanced customer experience further drives the adoption of sophisticated fraud detection solutions, ensuring seamless yet secure transactions.
Market Dynamics
Drivers
-
Growing reliance on AI-driven tools enhances real-time analysis and improves detection rates significantly.
-
Increased awareness of fraud risks prompts businesses to prioritize security measures, enhancing customer trust.
-
The rapid growth of online retail drives demand for robust fraud prevention solutions to protect transactions.
The rapid growth of online retail significantly impacts the demand for robust fraud prevention solutions, as e-commerce transactions become a prime target for fraudsters. The volume of online transactions continues to rise, leading to increased opportunities for fraudulent activities. According to a report from the Association of Certified Fraud Examiners, businesses in the retail sector lose about 1.5% of their revenue to fraud annually, emphasizing the need for effective prevention strategies.
As online sales surge, retailers face challenges such as payment fraud, account takeover, and return fraud. Increased awareness of fraud risks significantly influences businesses to prioritize security measures, thereby enhancing customer trust. A study by Experian revealed that 66% of consumers are concerned about online fraud, prompting businesses to invest in robust fraud detection solutions. With global cybercrime losses projected to reach $10.5 trillion by 2025, companies recognize that effective fraud prevention is crucial not only for safeguarding their assets but also for maintaining customer loyalty. According to a report by PwC, organizations that proactively address fraud risks see a 38% improvement in customer confidence. By implementing advanced technologies, such as machine learning and real-time analytics, businesses can better protect transactions and cultivate a secure shopping environment, ultimately driving customer satisfaction and retention.
Restraints
-
High rates of false positives can lead to customer dissatisfaction and operational inefficiencies, discouraging the use of certain solutions.
-
Constantly changing fraud tactics require continuous adaptation, making it challenging for solutions to keep pace.
-
Stringent data protection laws, such as GDPR, may limit the data available for analysis, affecting detection capabilities.
Stringent data protection laws, such as the General Data Protection Regulation (GDPR), impose strict guidelines on data collection and usage, which can limit the availability of data for fraud analysis. According to a survey by IBM, 75% of organizations report challenges in complying with GDPR, affecting their ability to access crucial customer information for fraud detection. Limited data can reduce the effectiveness of algorithms that rely on extensive datasets to identify patterns and anomalies. Consequently, while data protection is essential for consumer privacy, it presents a significant challenge for companies seeking to enhance their fraud detection and prevention capabilities effectively.
Constantly changing fraud tactics pose significant challenges for fraud detection and prevention solutions, necessitating continuous adaptation. Cybercriminals increasingly employ sophisticated methods, including AI-driven techniques, to bypass traditional security measures. According to the 2022 Verizon Data Breach Investigations Report, 82% of breaches involved a human element, highlighting the evolving strategies of attackers. As a result, businesses must invest in dynamic, adaptive solutions that can analyze and respond to emerging threats in real-time. Consequently, staying ahead of evolving fraud schemes is critical for maintaining security and protecting both company assets and customer trust.
Segment Analysis
By Component
The solution segment dominated the market and accounted for over 66% of the market share in 2023 and is expected to maintain its dominance throughout the forecast period. The rising incidence of Account Takeovers (ATO) and phishing attacks has driven enterprises to implement advanced tools and solutions that can detect fraudulent anomaly patterns at an early stage. These solutions are designed to process large datasets in real-time, significantly reducing detection time. In 2023, the authentication solutions segment dominated the market, accounting for more than 42% of the total revenue. Enterprises have increasingly turned to authentication solutions to protect customer credentials and sensitive information. However, as fraud attempts in customer-facing applications have become more sophisticated, organizations are now opting for advanced authentication solutions that incorporate single-factor and multi-factor authentication, as well as voice biometrics capabilities. Moreover, the fraud analytics solutions segment is expected to grow at the fastest CAGR during the forecast period.
The services segment is expected to experience the fastest CAGR of approximately 19.5% during the forecast period. Organizations in developing economies are increasingly adopting comprehensive fraud prevention strategies. to build a solid foundation, these organizations need fraud prevention service providers to offer integration, consulting, training, and support services. In 2023, the professional services segment captured the largest revenue share, accounting for nearly 73%, and is anticipated to maintain its leading position throughout the forecast period. This segment includes consulting, support, training, and development services. Vendors in this space provide dedicated teams of experts to assist organizations in deploying technologies and training their staff effectively.
However, the managed services segment is projected to grow at the fastest CAGR during the forecast period. Organizations looking to implement real-time preventive measures against fraud are increasingly adopting managed services. These providers monitor business transactions and detect unusual user behavior in real-time, leveraging the vast amounts of data generated across all touchpoints.
By Application
The payment fraud application represented the largest revenue share, exceeding 54% in 2023, and is expected to experience steady growth at a consistent CAGR during the forecast period. The increasing demand for cashless payment methods and e-wallets among consumers has opened up opportunities for fraudsters. Vulnerabilities or loopholes in these applications can grant easy access to banking and financial resources. The identity theft segment is expected to have the fastest growth, with a CAGR of over 19% throughout the forecast period. As criminals evolve their tactics to bypass authentication processes, incidents of identity theft are rising. The Federal Trade Commission’s “Consumer Sentinel Network” reported 4.8 million fraud and identity theft cases in 2020, marking a 45% increase from the previous year. Consequently, the urgent need to address escalating identity theft activities is expected to fuel growth in this segment.
By Vertical
The BFSI segment accounted for the largest revenue share of over 32% in 2023. The rapid digitization and electronification of operations have made banking and financial services an attractive target for cybercriminals. Additionally, the increasing consumer interest in products like stockbroking, insurance, and mutual funds, which are accessed digitally across various touchpoints, drives enterprises to implement preventive tools to monitor and combat fraud effectively.
The retail and e-commerce vertical segment is expected to achieve the fastest CAGR during the forecast period. Companies in this industry increasingly depend on electronic devices and digital platforms to enhance customer experience. However, the adoption of these solutions also heightens the risks of payment and digital fraud. As a result, the demand for authentication and other fraud prevention solutions is projected to rise significantly in this segment to safeguard customer information and strengthen security infrastructure.
By Organization Size
The large enterprise segment represented the largest revenue share, exceeding 73% in 2023. Fraudulent activities, including phishing, money laundering, and distributed denial-of-service attacks, are common among large enterprises and can significantly impact profitability. As a result, these organizations must implement preventive solutions and services. Investing in such measures is a critical business strategy to ensure the security of organizational data.
The SMEs segment is expected to achieve the highest growth rate of over 20% during the forecast period, driven by the rising incidence of fraud within these organizations. Their increasing reliance on digital solutions, combined with insufficient security frameworks, leaves SMEs vulnerable to cyber-attacks. Additionally, limited awareness of fraud risks and their potential impact on business profitability complicates compliance with data protection standards. Furthermore, the expansion of cross-border trade has led to a rise in fraudulent activities targeting these businesses.
Regional Analysis
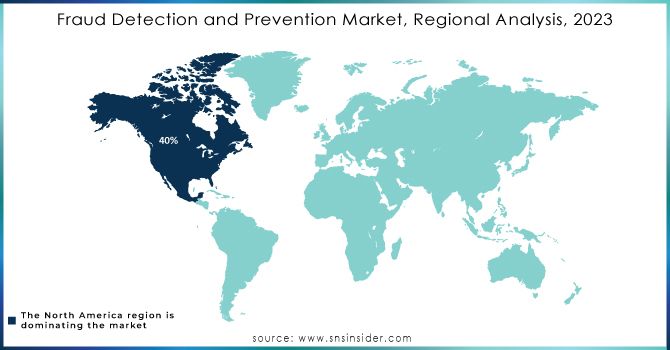
In 2023, North America dominated the market and accounted for over 40% of the fraud detection and prevention industry. This growth can be attributed to the presence of leading market players headquartered in the region, including IBM, Microsoft, and Oracle. Additionally, the U.S., as the world’s largest economy, has a high demand for fraud detection and prevention across various sectors such as IT, manufacturing, and healthcare. These factors are expected to drive the market's growth throughout the forecast period.
Asia Pacific region is expected to register the highest CAGR of more than 19.4% during the forecast period. Asia Pacific includes some of the world's largest economies, such as China, India, Japan, and South Korea, with several of these countries serving as major manufacturing hubs. The region is also home to key market players, including Fujitsu and NEC Corporation. Ongoing digitalization in developing economies, coupled with a substantial number of internet users in nations like China and India, has significantly contributed to the growth of the fraud detection and prevention market in the region.
Need any customization research on Fraud Detection and Prevention Market - Enquiry Now
KEY PLAYERS:
The major key players are
-
IBM – (IBM Watson for Cyber Security, IBM Security QRadar XDR)
-
Microsoft – (Microsoft Defender for Cloud, Microsoft Sentinel)
-
Oracle – (Oracle Financial Services Analytical Application, Oracle Cloud Infrastructure)
-
Fujitsu – (Fujitsu Security Operation Center (SOC) services, Fujitsu Fraud Prevention Solutions)
-
NEC Corporation – (NEC Biometrics Authentication, NEC Cyber Security Solutions)
-
SAS Institute - SAS Fraud Management, SAS Viya)
-
FICO – (FICO Falcon Fraud Manager, FICO Decision Management Suite)
-
ACI Worldwide – (ACI Fraud Management, ACI Universal Payments)
-
LexisNexis Risk Solutions – (LexisNexis Fraud & Risk Management Solutions, RiskNarrative Analytics)
-
Experian – (Experian Fraud Detection and Prevention, Experian Identity Verification)
-
TransUnion – (TransUnion IDVision, TransUnion Fraud Detection Services)
-
RSA Security – (RSA Fraud & Risk Intelligence, RSA SecurID Access)
-
PayPal – (PayPal Advanced Fraud Management, PayPal Commerce Platform)
-
Forter – (Forter’s Real-Time Fraud Prevention, Forter’s Chargeback Protection)
-
Riskified – (Riskified Chargeback Guarantee, Riskified Account Protection)
-
Signifyd – (Signifyd Commerce Protection, Signifyd Fraud Prevention)
-
Iovation – (iovation Device Recognition, iovation Fraud Prevention Solutions)
-
Sift Science – (Sift Digital Trust & Safety Platform, Sift’s Fraud Risk Management)
-
Kount – (Kount Complete, Kount’s Fraud Detection API)
-
CyberSource – (CyberSource Fraud Management, CyberSource Payment Gateway)
Recent Developments
-
In March 2024, FIS teamed up with Stratyfy, a graduate of the FIS Fintech Accelerator, to improve its SecurLOCK card fraud management system. This partnership aims to boost the accuracy of detecting and stopping fraudulent card transactions.
-
In November 2023, LexisNexis Risk Solutions formed a new partnership with Agenium, a company known for cutting-edge platform technology, to streamline the life insurance application process by integrating data and analytics through a flexible, no-code platform.
|
Report Attributes |
Details |
|
Market Size in 2023 |
US$ 25.2 Bn |
|
Market Size by 2032 |
US$ 112.8 Bn |
|
CAGR |
CAGR of 18.1% From 2024 to 2032 |
|
Base Year |
2023 |
|
Forecast Period |
2024-2032 |
|
Historical Data |
2020-2022 |
|
Report Scope & Coverage |
Market Size, Segments Analysis, Competitive Landscape, Regional Analysis, DROC & SWOT Analysis, Forecast Outlook |
|
Key Segments |
• By Component (Solutions and Services) |
|
Regional Analysis/Coverage |
North America (US, Canada, Mexico), Europe (Eastern Europe [Poland, Romania, Hungary, Turkey, Rest of Eastern Europe] Western Europe] Germany, France, UK, Italy, Spain, Netherlands, Switzerland, Austria, Rest of Western Europe]), Asia Pacific (China, India, Japan, South Korea, Vietnam, Singapore, Australia, Rest of Asia Pacific), Middle East & Africa (Middle East [UAE, Egypt, Saudi Arabia, Qatar, Rest of Middle East], Africa [Nigeria, South Africa, Rest of Africa], Latin America (Brazil, Argentina, Colombia, Rest of Latin America) |
|
Company Profiles |
IBM, Microsoft, Oracle, Fujitsu, NEC Corporation, SAS Institute, FICO, ACI Worldwide, LexisNexis Risk Solutions,Experian |
|
Key Drivers |
• Increased awareness of fraud risks prompts businesses to prioritize security measures, enhancing customer trust. |
|
Key Restraints |
• Constantly changing fraud tactics require continuous adaptation, making it challenging for solutions to keep pace. |
Get in Touch
