Sodium Silicate Market Report Scope & Overview
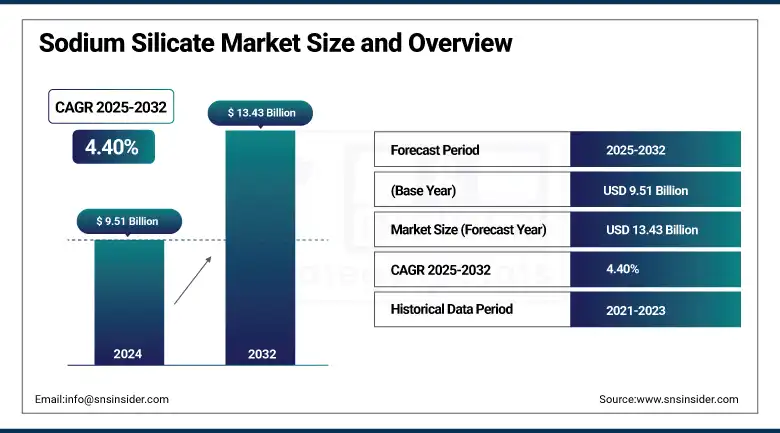
The Sodium Silicate Market size was USD 9.51 billion in 2024 and is expected to reach USD 13.43 million by 2032, growing at a CAGR of 4.40% over the forecast period of 2025-2032.
Sodium silicate market analysis highlights that increasing demand from the detergent industry is a key driver of sodium silicate market growth. The growth is driven by the liquid detergent and powder detergent with sodium silicate and its unique properties, such as alkalinity and emulsification of soil and the prevention of soil redeposition on fabrics, that are among the essential contents of these detergents. Due to the increasing environmental issues and the regulatory restrictions on phosphates, manufacturers are inclined towards more eco-friendly, economical sodium silicate-based formulations.
Market Size and Forecast:
-
Market Size in 2024: USD 9.51 Billion
-
Market Size by 2032: USD 13.43 Billion
-
CAGR: 4.40% from 2025 to 2032
-
Base Year: 2024
-
Forecast Period: 2025–2032
-
Historical Data: 2021–2023
To Get more information On Sodium Silicate Market - Request Free Sample Report
Furthermore, rising demand for household and industrial cleaning products is driving the market for sodium silicate, particularly in developing countries and rapidly urbanizing regions globally. As people become more and more conscious of hygiene and cleanliness globally, this trend is set to remain robust in the sodium silicate industry.
In January 2024, the Department of Chemicals and Petrochemicals publishes monthly production statistics for many chemicals. The production of chemicals is 840000 metric tonnes, 931200 metric tonnes. This aligns with the overall scale of the chemicals market, where sodium silicate is an important constituent based on its high consumption for detergent production.
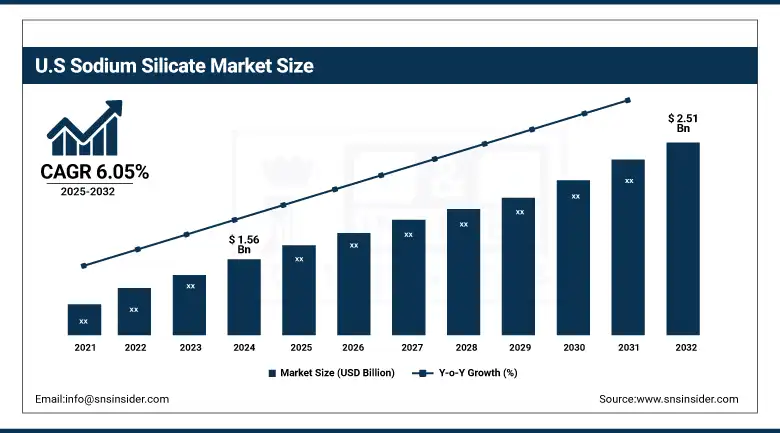
The U.S sodium silicate market size was USD 1.56 billion in 2024 and is expected to reach USD 2.51 billion by 2032 and grow at a CAGR of 6.05% over the forecast period of 2025-2032. The growth is driven by the presence of an established industrial setup and strong manufacturing sectors, coupled with high investments being made in the construction, automotive, and water treatment industries, U.S. sodium silicate market size held the largest market share. Sodium silicate is in high demand in the U.S. for its use as an industrial mineral, mainly in detergent, concrete, and rubber products. Phosphate regulations limited its usage, further enhancing the sodium silicate-based detergents demand in the country, which also emphasizes sustainability, along with eco-friendly alternatives.
Sodium Silicate Market Trends:
-
Increasing demand from detergents and cleaning products is driving steady market growth.
-
Rising application in construction chemicals and cement formulations is boosting consumption.
-
Growing use in water treatment plants due to its corrosion control and purification properties is expanding demand.
-
Expansion of pulp & paper and textile industries is supporting product adoption globally.
-
Increasing demand for eco-friendly and sustainable industrial chemicals is positively influencing market expansion.
-
Technological advancements in specialty grades of sodium silicate are enhancing performance across industrial applications.
Sodium Silicate Market Drivers:
-
Increase in Infrastructure and Construction Growth Drives the Market Growth
The increasing infrastructure and construction activities globally and in expanding economies, is a major factor driving the sodium silicate market. One of the main applications of sodium silicate is when it is used in different construction industries, such as cement additive, concrete hardening accelerator, and others. These properties, in turn, improve the durability, water resistance, and bonding strength of building materials, making them an indispensable component in civil engineering. The increasing urbanization, population growth, and government initiatives for smart cities and sustainable transportation networks, and housing, particularly in developing countries, are driving demand for construction materials incorporating sodium silicate. Moreover, the sodium silicate companies focused on the development and launched new infrastructure to sodium silicate market trends.
For instance, in 2025, Walker Corporation launched a USD 300 million residential tower at Maroochydore City Centre, which will form a part of regional housing and infrastructure expansion. Additionally, in 2025, Exact Contracting Pty Ltd won a USD 68 million contract that supported upgrades to the Carpentaria Highway, raising overall transport infrastructure in the Northern Territory.
Sodium Silicate Market Restraints:
-
Energy-intensive Production Process May Hamper Market Growth
The production process of sodium silicate is energy-intensive, which restricts the growth of the sodium silicate market to a relatively higher extent. Sodium silicate is normally produced by fusing silica sand and soda ash in 1,100 °C or higher large furnaces. Many of those steps are energy-intensive, relying heavily on fossil fuels, which leads to higher manufacturing costs and increased greenhouse gas emissions. Manufacturers are increasingly pressured to develop cleaner and energy-efficient production processes, as governments and environmental agencies begin to impose stricter regulations on carbon emissions globally.
Sodium Silicate Market Opportunities:
-
Increased Government Investment in Infrastructure Creates Opportunities in the Market
Strong government spending to improve infrastructure will drive the sodium silicate market. Large-scale infrastructure projects, including road construction, bridges and tunnels, and public housing across the developing world, are receiving massive funding as countries prioritize economic development and urbanization. The sodium silicate binders and thus their good bonding and sealing properties in turn make it an important binder, cement additive, and concrete hardener for the construction sector.
The rising number of investments made by governments in various areas, such as North America, Europe, and Asia-Pacific, for modernizing their infrastructure facilities by spending billions of dollars, is expected to create the demand for sodium silicate-based construction materials directly. The U.S. federal infrastructure bills and organic infrastructure initiatives in Europe to support improvements for transportation, water treatment, and sustainable building development, the three major sectors of sodium silicate product application, which drive the market growth.
For instance, in May 2023, BASF SE launched new sodium silicate products for enhanced concrete and mortars, thus proving its commitment to an innovative range of offerings for construction solutions.
Sodium Silicate Market Segmentation Analysis:
By Form
Liquid held the largest sodium silicate market share, around 67%, in 2024, owing to its versatility, ease of handling, and extremely competitive performance characteristics in the major end-user applications. Liquid sodium silicate differs from its solid variant in a way that it can be used as it is in industrial processes without the need for dissolution, which provides significant advantages to end-users. Due to its high adhesive, emulsifying, and corrosion inhibiting properties, it is extensively used in water treatment, water glass market, detergents, adhesives, construction, and pulp & paper industry, among others.
Solid held a significant sodium silicate market share, owing to its stability, economical nature, and longer shelf life as compared to the liquid form, solid sodium silicate accounted for a significant share in the sodium silicate market. As such, it is extensively used as a process in the manufacturing of detergents, catalysts, adhesives, and specialty chemicals, mainly when used where some precise dilution or tailor-made concentrations are needed. Solid sodium silicate does not require specialized containers for long-distance transport and storage, and therefore is suitable for regions with limited infrastructure.
By Application
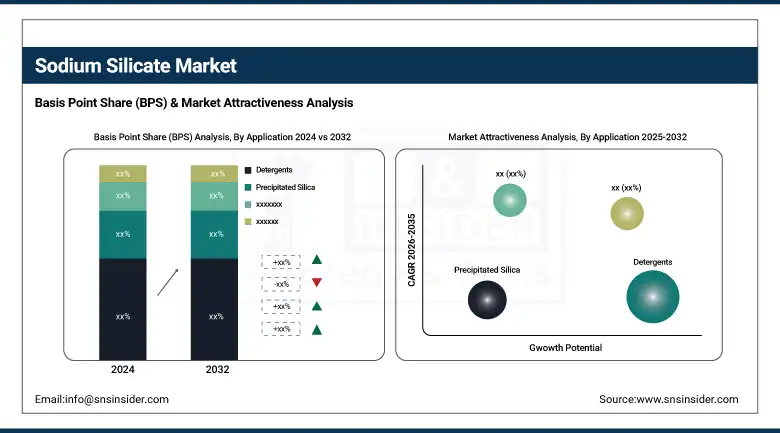
In 2024, detergents held the largest market share of around 24%. The segment’s growth is owing to their extensive use in both household and industrial cleaning applications. Due to the above reason, sodium silicate is an essential component in detergent formulation as it possesses outstanding alkalinity, emulsifying property, and water softening property, which helps to prevent redeposition of soil onto fabric. Sodium silicate has witnessed sufficient expansion in demand for use as a detergent due to increasing demand for efficient and biocompatible cleaning products globally, particularly in emerging nations driven by accelerating urbanization and increasing consciousness about cleanliness.
Precipitated silica held a significant market share owing to its diverse applications and high demand in food-grade applications for tires, rubber, and the personal care industries. Precipitated sodium silicate is a primary precursor for precipitated silica, one of the most commonly used carbon black replacing and reinforcing fillers for tires, with durability, fuel efficiency, and wet traction properties increased use of precipitated silica due to growth of automotive industry and high inclination towards use of high-performance tires It is also used in rubber goods, where it increases tensile strength, elasticity, and abrasion resistance.
Sodium Silicate Market Regional Analysis:
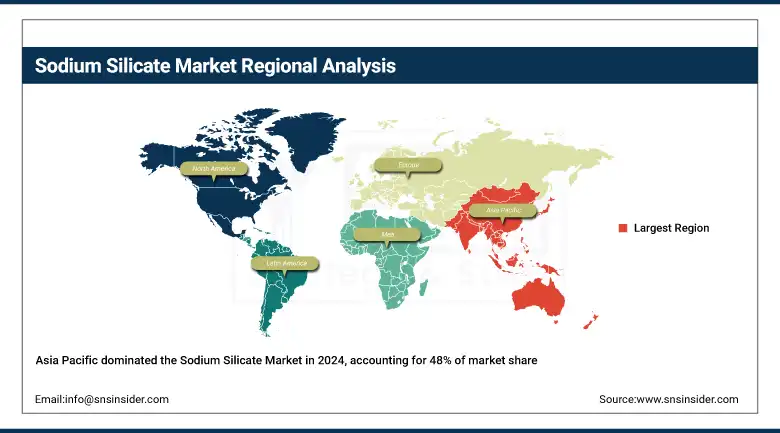
Asia Pacific held the largest market share, around 48%, in 2024. It is due to high industrial growth, accelerating urbanization, and thriving manufacturing sector. Asia Pacific is comprised of the globe’s vastest consumer markets led by China and India where consumption of sodium silicate is spurred by the booming construction, detergent, and water treatment industries. The burgeoning automotive and electronics sector in Asia Pacific also drives sodium silicate demand for use in tires, rubber, and precipitated silica. Additionally, the area is also experiencing lower production and labor costs, leading to it becoming a staple area for sodium silicate-based product manufacturing across the globe.
Get Customized Report as per Your Business Requirement - Enquiry Now
In December 2024, Tokuyama Corporation announced that it had established a subsidiary company named Tokuyama India Private Limited in Mumbai, India. The new unit will also assist Tokuyama with local marketing and for other businesses, including electronics, healthcare, and environmental in India. The subsidiary is expected to begin operations on April 1st, 2025.
North America held a significant market share and is the fastest-growing region during the forecast period owing to a strong industrial foundation, followed by a varied platform for applications, coupled with the shifting trends toward the increasing need for sodium silicate in various sectors. It is home to top sodium silicate manufacturers in the construction, automotive, detergent, and water treatment industries collectively. Rising government initiatives for infrastructure development projects, along with the increasing involvement of the private sector, are the factors driving the sodium silicate market for concrete and cement applications.
In January 2024, PQ Corporation acquired the vanBaerle Group specialty silicate business of Switzerland-based company vanBaerle Group, a manufacturer of quality silicates. This acquisition provides PQ with incremental specialty silicate product capability as well as new customers in new U.S. and other geographic markets.
Europe held a significant market share in the forecast period. It is owing to a healthy industrial base, adept manufacturing facilities, and high demand for sodium silicate in major industries, including automotive, construction, and detergents. Many of the top global manufacturers of sodium silicate-based products have production facilities in the region, specifically for tires and rubber, and specialty chemicals. Sodium silicate can be considered as an eco-friendly alternative in the EU due to stringent sustainability regulations regarding phosphates used in detergents.
Key Players:
PQ Corporation, CIECH, Tokuyama Corporation, BASF SE, Evonik Industries AG, W.R. Grace & Co., Nippon Chemical Industrial Co. Ltd., Kiran Global Chem Limited, Shanti Chemicals, and Oriental Silicas Corporation, are the leading players in the market.
Recent Developments:
-
In 2024, OxyChem announced the launch of a new line of water treatment solutions based on sodium silicate in response to the global sustainability demand for more sustainable water purification techniques. This resulted in a 10%-12% increase in its core product line.
-
In 2024, Sinchem Silica Gel introduced a very high-purity sodium silicate that is specifically designed for the electronics industry and conquered an additional 8%-10% of the market share in the Asia-Pacific region, predominantly South Korea and Japan.
| Report Attributes | Details |
|---|---|
| Market Size in 2024 | USD 9.51 Billion |
| Market Size by 2032 | USD 13.43 Billion |
| CAGR | CAGR of4.40% From 2025 to 2032 |
| Base Year | 2024 |
| Forecast Period | 2025-2032 |
| Historical Data | 2021-2023 |
| Report Scope & Coverage | Market Size, Segments Analysis, Competitive Landscape, Regional Analysis, DROC & SWOT Analysis, Forecast Outlook |
| Key Segments | •By Form (Liquid, Solid) • By End-Use Industry (Textile, Paper, Derivatives, Oil & gas, Cosmetics/personal care, Leather, Others) |
| Regional Analysis/Coverage | North America (US, Canada, Mexico), Europe (Germany, France, UK, Italy, Spain, Poland, Turkey, Rest of Europe), Asia Pacific (China, India, Japan, South Korea, Singapore, Australia, Rest of Asia Pacific), Middle East & Africa (UAE, Saudi Arabia, Qatar, South Africa, Rest of Middle East & Africa), Latin America (Brazil, Argentina, Rest of Latin America) |
| Company Profiles | BASF SE, Thermo Fisher Scientific Inc., WeylChem International GmbH, Zhonglan Industry Co., Ltd., Hubei Hongyuan Pharmaceutical Technology Co., Ltd., Amzole India Pvt. Ltd., Haihang Industry, Eastman Chemical Company, Dow Chemical Company, Huntsman Corporation. |
Frequently Asked Questions
Ans: Asia Pacific led the Sodium Silicate Market in the region with the highest revenue share in 2024.
Ans: Increasing the infrastructure and construction growth drives the market growth.
Ans: Liquid will grow rapidly in the Sodium Silicate Market from 2025 to 2032.
Ans: The expected CAGR of the global Sodium Silicate Market during the forecast period is 4.40%
Ans: The Sodium Silicate Market was valued at USD 9.51 billion in 2024.
Get in Touch
