Get More Information on Ethanolamine Market - Request Sample Report
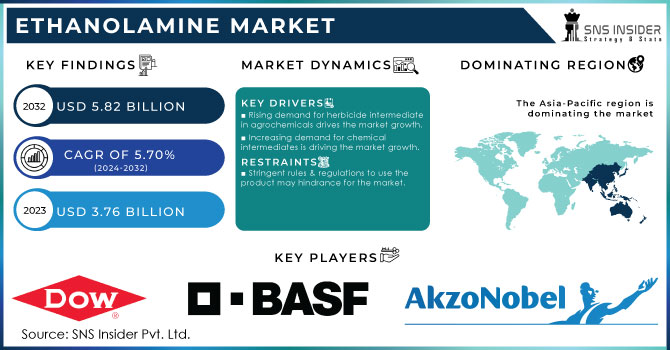
Ethanolamine Market Size was valued at USD 3.76 billion in 2023 and is expected to reach USD 5.82 billion by 2032 and grow at a CAGR of 5.70% over the forecast period 2024-2032.
Increasing demand for surfactant products drives the direct demand for ethanolamine consumption. Ethanolamine plays a vital role in the formulation of surfactants, which is essential ingredients in detergents, cleaning agents, and a wide range of personal care products. Therefore, the rising demand for necessary products is a major driver for ethanolamine consumption.
Moreover, a significant amount of ethanolamines is needed to produce a large number of herbicides, especially those that contain glyphosate. The necessity to produce more food to feed a growing population is driving the agriculture sector's enormous global growth. This, together with the continuous fight against weeds that pose a threat to crop harvests, is driving rising demand for ethanolamines in the market for agricultural herbicides.
For instance, in 2022, BASF invested in a new plant for alkyl ethanolamines in the Antwerp facility, bringing its yearly capacity to 140,000 metric tons worldwide. This investment helped the company to increase production.
Additionally, it is also used in personal care products such as shampoos, conditioners, and skin care formulations. Rising personal care product consumption drives the market growth in the market.
Drivers
Rising demand for herbicide intermediate in agrochemicals drives the market growth.
Agricultural products like herbicides and insecticides also include ethanolamine. The main advantage of using ethanolamine is that it increases a pesticide's aqueous solubility. Comparably, one of the essential raw materials required for the synthesis of glyphosate which helps produce high-quality herbicides is diethanolamine. China leads the world in agricultural economy contribution around 19.49 percent of total agricultural output, followed by India at 7.39 percent, according to data from "Statistics Times". Furthermore, ethanolamines can contaminate water by raising the total nitrogen count and chemical oxygen needed when they are introduced into aquatic environments.
Furthermore, new herbicides that target particular weeds without hurting crops have been developed as a result of improvements in agricultural operations and the demand for sustainable farming approaches. This has to increase its research and development activities that drive their demand in the agrochemical sector.
Increasing demand for chemical intermediates is driving the market growth.
The ethanolamine market is flourishing due to the ever-increasing demand for chemical intermediates. Ethanolamine, a versatile compound with a wide range of applications, serves as a critical building block across numerous industries. In the realm of cleaning products, ethanolamines are essential for the production of surfactants, which are the key ingredients in detergents and cleaning agents. Their ability to remove dirt and grime makes them irreplaceable in household cleaning solutions and industrial degreasers. Ethanolamines also play a crucial role in gas treatment, where they efficiently capture acid gases like carbon dioxide and hydrogen sulfide from natural gas streams. This purification process is essential for ensuring clean energy production and complying with stringent environmental regulations.
Beyond industrial applications, ethanolamines play a significant role in the booming personal care and cosmetics market. They function as emulsifiers, thickeners, and pH regulators, contributing to the luxurious textures and formulations of many popular personal care products. From shampoos and conditioners to lotions and creams, ethanolamines ensure a smooth and consistent product experience. The rising consumer interest in personal hygiene and self-care further intensifies the demand for ethanolamines in this sector.
Restraint
Stringent rules & regulations to use the product may hindrance for the market.
Stringent environmental and safety regulations pose a significant challenge to the ethanolamine market. To comply with these mandates, manufacturers must invest in waste management systems, safety equipment, and process modifications. These investments increase operational costs, including those for compliance audits and certifications. As a result, profit margins for ethanolamine producers are reduced, impacting overall market profitability.
By Type
In 2023, monoethanolamine dominated the global demand and held a market share of more than 39.19% in the ethanolamine industry. This dominance stems from its multifaceted functionality across diverse industries, well-honed and cost-efficient production processes, and longstanding market presence. Compared to other ethanolamine types, MEA boasts a broader application spectrum, catering to a wider range of needs. Additionally, its established customer base and well-oiled distribution network solidify its leading position.
By Application
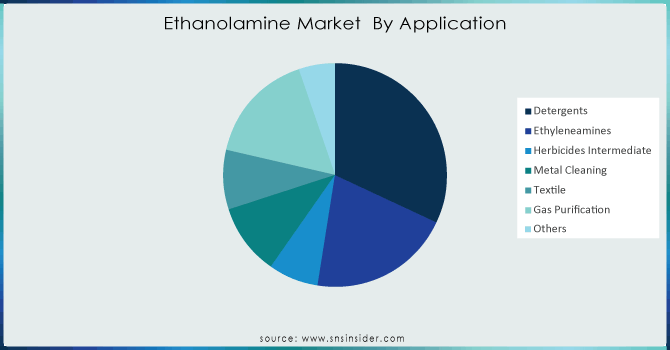
Based on the application detergents segment held the largest market share of around 32.22% in 2023. Heightened awareness of personal and environmental hygiene, along with rapid urbanization, has led to a significant increase in detergent consumption. This trend is further amplified by the growth of the middle class in many regions, as rising disposable incomes allow for more discretionary spending on household products. Additionally, evolving lifestyles are contributing to the trend. For example, the fast-fashion movement and our increasingly active lives lead to more frequent laundry cycles, necessitating the use of more detergent.
Need any customization research on Ethanolamine Market - Enquiry Now
Regional Analysis
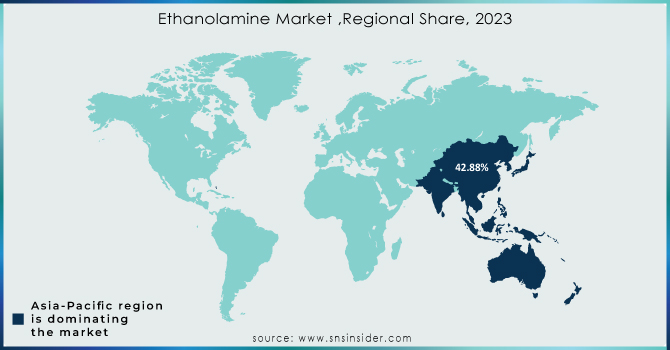
Asia Pacific dominated the ethanolamine market in 2023 with the highest market share around 42.88%. Asia-Pacific's advantageous economic conditions, accessibility to raw materials, and cheaper labor prices make it a major hub for the manufacturing of detergents and cleaning products. Numerous manufacturing facilities that create a wide range of cleaning goods for both domestic and international markets are located in countries like China, India, and Japan. The significant use of ethanolamines, which are essential components of these goods, is driven by this vast manufacturing capacity. The region's vast production infrastructure enables it to produce a large amount of cleaning products and detergents, which in turn fuels the strong need for ethanolamines.North America is estimated the fastest-growing region in the market and more grow in the upcoming times. The demand is increasing due to the rising demand for gas purification and metal cleaning application which it will drive the ethanolamine consumption in the region.
The Ethanolamine Market is highly competitive and consolidated there are many companies available in the market. Some of the key players focus on expansion and innovation to enhance the performance of its product. This strategy helps the industry to accelerate its growth in the global market. Some of the key players are listed below:
BASF SE, Dow Chemical Corporation, Akzo Nobel N.V., Huntsman Corporation LLC, SABIC, Kanto Kagaku, Jay Dinesh Chemicals, INEOS, Nouryon, OUCC, and Others
Recent Development:
In June 2024, Nouryon announced that its Stenungsund, Sweden facility is now certified to the International Sustainability and Carbon Certification standard ISCC PLUS for producing green ethanolamines, and ethylene amines, as well as the surfactants made from these raw materials.
In November 2023, BASF and SINOPEC expanded their production in chemical plants. This expansion will help the BASF to produce high-quality chemicals such as, ethanolamines, propionic acid, and many more.
In December 2023, the company and production facilities of LyondellBasell Ethylene Oxide and Derivatives in Bayport, Texas, were acquired by INEOS for a sum of USD 700. The motive of this expansion is to increase its presence in the U.S. market
Report Attributes | Details |
Market Size in 2023 | US$ 3.76 Billion |
Market Size by 2032 | US$ 5.82 Billion |
CAGR | CAGR of 5.70 % From 2024 to 2032 |
Base Year | 2023 |
Forecast Period | 2024-2032 |
Historical Data | 2020-2022 |
Report Scope & Coverage | Market Size, Segments Analysis, Competitive Landscape, Regional Analysis, DROC & SWOT Analysis, Forecast Outlook |
Key Segments | •By Type (Monoethanolamine Triethanolamine, Diethanolamine), •By Application (Detergents, Ethyleneamines, Herbicides Intermediate, Metal Cleaning, Textile, Gas Purification, and Others) |
Regional Analysis/Coverage | North America (US, Canada, Mexico), Europe (Eastern Europe [Poland, Romania, Hungary, Turkey, Rest of Eastern Europe] Western Europe] Germany, France, UK, Italy, Spain, Netherlands, Switzerland, Austria, Rest of Western Europe]), Asia Pacific (China, India, Japan, South Korea, Vietnam, Singapore, Australia, Rest of Asia Pacific), Middle East & Africa (Middle East [UAE, Egypt, Saudi Arabia, Qatar, Rest of Middle East], Africa [Nigeria, South Africa, Rest of Africa], Latin America (Brazil, Argentina, Colombia, Rest of Latin America) |
Company Profiles | Cathay Biotech Inc., Evonik Industries AG, Nantong Senos Biotechnology Co. Ltd, Henan Junheng Industrial Group Biotechnology Co., Ltd, Capot Chemical Co., Ltd., INVISTA, AECOCHEM, Shandong Guangtong New Materials Co., Ltd., Shandong Hilead Biotechnology, DAYANG CHEM, Corvay, and Others. |
Key Drivers | • Rising demand for herbicide intermediate in agrochemicals drives the market growth |
RESTRAINTS | •Stringent rules & regulations to use the product may hindrance for the market |
Ans: The expected CAGR of the global Ethanolamine Market during the forecast period is 5.70% .
Ans: The Detergents segment will grow rapidly in the Ethanolamine Market from 2024-2032.
Ans: Factors such as stringent rules & regulations, and technology limitations, can restrict the growth of the Ethanolamine market.
Ans: Rising demand for herbicide intermediate in agrochemicals drives the market growth.
Ans: The U.S. led the largest share in the North American region with the highest revenue share in 2023.
Table of Contents
1. Introduction
1.1 Market Definition
1.2 Scope
1.3 Research Assumptions
2. Industry Flowchart
3. Research Methodology
4. Market Dynamics
4.1 Drivers
4.2 Restraints
4.3 Opportunities
4.4 Challenges
5. Porter’s 5 Forces Model
6. Pest Analysis
7. Ethanolamine Market Segmentation, By Type
7.1 Introduction
7.2 Monoethanolamine
7.3 Triethanolamine
7.4 Diethanolamine
8. Ethanolamine Market Segmentation, By Application
8.1 Introduction
8.2 Detergents
8.3 Ethyleneamines
8.4 Herbicides Intermediate
8.5 Metal Cleaning
8.6 Textile
8.7 Gas Purification
8.8 Others
9. Regional Analysis
9.1 Introduction
9.2 North America
9.2.1 Trend Analysis
9.2.2 North America Ethanolamine Market by Country
9.2.3 North America Ethanolamine Market By Type
9.2.4 North America Ethanolamine Market By Application
9.2.5 USA
9.2.5.1 USA Ethanolamine Market By Type
9.2.5.2 USA Ethanolamine Market By Application
9.2.6 Canada
9.2.6.1 Canada Ethanolamine Market By Type
9.2.6.2 Canada Ethanolamine Market By Application
9.2.7 Mexico
9.2.7.1 Mexico Ethanolamine Market By Type
9.2.7.2 Mexico Ethanolamine Market By Application
9.3 Europe
9.3.1 Trend Analysis
9.3.2 Eastern Europe
9.3.2.1 Eastern Europe Ethanolamine Market by Country
9.3.2.2 Eastern Europe Ethanolamine Market By Product
9.3.2.3 Eastern Europe Ethanolamine Market By Application
9.3.2.4 Poland
9.3.2.4.1 Poland Ethanolamine Market By Type
9.3.2.4.2 Poland Ethanolamine Market By Application
9.3.2.5 Romania
9.3.2.5.1 Romania Ethanolamine Market By Type
9.3.2.5.2 Romania Ethanolamine Market By Application
9.3.2.6 Hungary
9.3.2.6.1 Hungary Ethanolamine Market By Type
9.3.2.6.2 Hungary Ethanolamine Market By Application
9.3.2.7 Turkey
9.3.2.7.1 Turkey Ethanolamine Market By Type
9.3.2.7.2 Turkey Ethanolamine Market By Application
9.3.2.8 Rest of Eastern Europe
9.3.2.8.1 Rest of Eastern Europe Ethanolamine Market By Type
9.3.2.8.2 Rest of Eastern Europe Ethanolamine Market By Application
9.3.3 Western Europe
9.3.3.1 Western Europe Ethanolamine Market by Country
9.3.3.2 Western Europe Ethanolamine Market By Type
9.3.3.3 Western Europe Ethanolamine Market By Application
9.3.3.4 Germany
9.3.3.4.1 Germany Ethanolamine Market By Type
9.3.3.4.2 Germany Ethanolamine Market By Application
9.3.3.5 France
9.3.3.5.1 France Ethanolamine Market By Type
9.3.3.5.2 France Ethanolamine Market By Application
9.3.3.6 UK
9.3.3.6.1 UK Ethanolamine Market By Type
9.3.3.6.2 UK Ethanolamine Market By Application
9.3.3.7 Italy
9.3.3.7.1 Italy Ethanolamine Market By Type
9.3.3.7.2 Italy Ethanolamine Market By Application
9.3.3.8 Spain
9.3.3.8.1 Spain Ethanolamine Market By Type
9.3.3.8.2 Spain Ethanolamine Market By Application
9.3.3.9 Netherlands
9.3.3.9.1 Netherlands Ethanolamine Market By Type
9.3.3.9.2 Netherlands Ethanolamine Market By Application
9.3.3.10 Switzerland
9.3.3.10.1 Switzerland Ethanolamine Market By Type
9.3.3.10.2 Switzerland Ethanolamine Market By Application
9.3.3.11 Austria
9.3.3.11.1 Austria Ethanolamine Market By Type
9.3.3.11.2 Austria Ethanolamine Market By Application
9.3.3.12 Rest of Western Europe
9.3.3.12.1 Rest of Western Europe Ethanolamine Market By Type
9.3.2.12.2 Rest of Western Europe Ethanolamine Market By Application
9.4 Asia-Pacific
9.4.1 Trend Analysis
9.4.2 Asia Pacific Ethanolamine Market by Country
9.4.3 Asia Pacific Ethanolamine Market By Type
9.4.4 Asia Pacific Ethanolamine Market By Application
9.4.5 China
9.4.5.1 China Ethanolamine Market By Type
9.4.5.2 China Ethanolamine Market By Application
9.4.6 India
9.4.6.1 India Ethanolamine Market By Type
9.4.6.2 India Ethanolamine Market By Application
9.4.7 Japan
9.4.7.1 Japan Ethanolamine Market By Type
9.4.7.2 Japan Ethanolamine Market By Application
9.4.8 South Korea
9.4.8.1 South Korea Ethanolamine Market By Type
9.4.8.2 South Korea Ethanolamine Market By Application
9.4.9 Vietnam
9.4.9.1 Vietnam Ethanolamine Market By Type
9.4.9.2 Vietnam Ethanolamine Market By Application
9.4.10 Singapore
9.4.10.1 Singapore Ethanolamine Market By Type
9.4.10.2 Singapore Ethanolamine Market By Application
9.4.11 Australia
9.4.11.1 Australia Ethanolamine Market By Type
9.4.11.2 Australia Ethanolamine Market By Application
9.4.12 Rest of Asia-Pacific
9.4.12.1 Rest of Asia-Pacific Ethanolamine Market By Type
9.4.12.2 Rest of Asia-Pacific Ethanolamine Market By Application
9.5 Middle East & Africa
9.5.1 Trend Analysis
9.5.2 Middle East
9.5.2.1 Middle East Ethanolamine Market by Country
9.5.2.2 Middle East Ethanolamine Market By Type
9.5.2.3 Middle East Ethanolamine Market By Application
9.5.2.4 UAE
9.5.2.4.1 UAE Ethanolamine Market By Type
9.5.2.4.2 UAE Ethanolamine Market By Application
9.5.2.5 Egypt
9.5.2.5.1 Egypt Ethanolamine Market By Type
9.5.2.5.2 Egypt Ethanolamine Market By Application
9.5.2.6 Saudi Arabia
9.5.2.6.1 Saudi Arabia Ethanolamine Market By Type
9.5.2.6.2 Saudi Arabia Ethanolamine Market By Application
9.5.2.7 Qatar
9.5.2.7.1 Qatar Ethanolamine Market By Type
9.5.2.7.2 Qatar Ethanolamine Market By Application
9.5.2.8 Rest of Middle East
9.5.2.8.1 Rest of Middle East Ethanolamine Market By Type
9.5.2.8.2 Rest of Middle East Ethanolamine Market By Application
9.5.3 Africa
9.5.3.1 Africa Ethanolamine Market by Country
9.5.3.2 Africa Ethanolamine Market By Type
9.5.3.3 Africa Ethanolamine Market By Application
9.5.2.4 Nigeria
9.5.2.4.1 Nigeria Ethanolamine Market By Type
9.5.2.4.2 Nigeria Ethanolamine Market By Application
9.5.2.5 South Africa
9.5.2.5.1 South Africa Ethanolamine Market By Type
9.5.2.5.2 South Africa Ethanolamine Market By Application
9.5.2.6 Rest of Africa
9.5.2.6.1 Rest of Africa Ethanolamine Market By Type
9.5.2.6.2 Rest of Africa Ethanolamine Market By Application
9.6 Latin America
9.6.1 Trend Analysis
9.6.2 Latin America Ethanolamine Market by Country
9.6.3 Latin America Ethanolamine Market By Type
9.6.4 Latin America Ethanolamine Market By Application
9.6.5 Brazil
9.6.5.1 Brazil Ethanolamine Market By Type
9.6.5.2 Brazil Ethanolamine Market By Application
9.6.6 Argentina
9.6.6.1 Argentina Ethanolamine Market By Type
9.6.6.2 Argentina Ethanolamine Market By Application
9.6.7 Colombia
9.6.7.1 Colombia Ethanolamine Market By Type
9.6.7.2 Colombia Ethanolamine Market By Application
9.6.8 Rest of Latin America
9.6.8.1 Rest of Latin America Ethanolamine Market By Type
9.6.8.2 Rest of Latin America Ethanolamine Market By Application
10. Company Profiles
10.1 BASF SE
10.1.1 Company Overview
10.1.2 Financial
10.1.3 Products/ Services Offered
10.1.4 The SNS View
10.2 Dow Chemical Corporation
10.2.1 Company Overview
10.2.2 Financial
10.2.3 Products/ Services Offered
10.2.4 The SNS View
10.3 Akzo Nobel N.V
10.3.1 Company Overview
10.3.2 Financial
10.3.3 Products/ Services Offered
10.3.4 The SNS View
10.4 Huntsman Corporation LLC
10.4.1 Company Overview
10.4.2 Financial
10.4.3 Products/ Services Offered
10.4.4 The SNS View
10.5 SABIC
10.5.1 Company Overview
10.5.2 Financial
10.5.3 Products/ Services Offered
10.5.4 The SNS View
10.6 Kanto Kagaku
10.6.1 Company Overview
10.6.2 Financial
10.6.3 Products/ Services Offered
10.6.4 The SNS View
10.7. Jay Dinesh Chemicals
10.7.1 Company Overview
10.7.2 Financial
10.7.3 Products/ Services Offered
10.7.4 The SNS View
10.8 INEOS
10.8.1 Company Overview
10.8.2 Financial
10.8.3 Products/ Services Offered
10.8.4 The SNS View
10.9 Nouryon
10.9.1 Company Overview
10.9.2 Financial
10.9.3 Products/ Services Offered
10.9.4 The SNS View
10.10 OUCC,
10.10.1 Company Overview
10.10.2 Financial
10.10.3 Products/ Services Offered
10.10.4 The SNS View
11. Competitive Landscape
11.1 Competitive Benchmarking
11.2 Market Share Analysis
11.3 Recent Developments
11.3.1 Industry News
11.3.2 Company News
11.3.3 Mergers & Acquisitions
12. Use Cases and Best Practices
13. Conclusion
An accurate research report requires proper strategizing as well as implementation. There are multiple factors involved in the completion of good and accurate research report and selecting the best methodology to compete the research is the toughest part. Since the research reports we provide play a crucial role in any company’s decision-making process, therefore we at SNS Insider always believe that we should choose the best method which gives us results closer to reality. This allows us to reach at a stage wherein we can provide our clients best and accurate investment to output ratio.
Each report that we prepare takes a timeframe of 350-400 business hours for production. Starting from the selection of titles through a couple of in-depth brain storming session to the final QC process before uploading our titles on our website we dedicate around 350 working hours. The titles are selected based on their current market cap and the foreseen CAGR and growth.
The 5 steps process:
Step 1: Secondary Research:
Secondary Research or Desk Research is as the name suggests is a research process wherein, we collect data through the readily available information. In this process we use various paid and unpaid databases which our team has access to and gather data through the same. This includes examining of listed companies’ annual reports, Journals, SEC filling etc. Apart from this our team has access to various associations across the globe across different industries. Lastly, we have exchange relationships with various university as well as individual libraries.
Step 2: Primary Research
When we talk about primary research, it is a type of study in which the researchers collect relevant data samples directly, rather than relying on previously collected data. This type of research is focused on gaining content specific facts that can be sued to solve specific problems. Since the collected data is fresh and first hand therefore it makes the study more accurate and genuine.
We at SNS Insider have divided Primary Research into 2 parts.
Part 1 wherein we interview the KOLs of major players as well as the upcoming ones across various geographic regions. This allows us to have their view over the market scenario and acts as an important tool to come closer to the accurate market numbers. As many as 45 paid and unpaid primary interviews are taken from both the demand and supply side of the industry to make sure we land at an accurate judgement and analysis of the market.
This step involves the triangulation of data wherein our team analyses the interview transcripts, online survey responses and observation of on filed participants. The below mentioned chart should give a better understanding of the part 1 of the primary interview.
Part 2: In this part of primary research the data collected via secondary research and the part 1 of the primary research is validated with the interviews from individual consultants and subject matter experts.
Consultants are those set of people who have at least 12 years of experience and expertise within the industry whereas Subject Matter Experts are those with at least 15 years of experience behind their back within the same space. The data with the help of two main processes i.e., FGDs (Focused Group Discussions) and IDs (Individual Discussions). This gives us a 3rd party nonbiased primary view of the market scenario making it a more dependable one while collation of the data pointers.
Step 3: Data Bank Validation
Once all the information is collected via primary and secondary sources, we run that information for data validation. At our intelligence centre our research heads track a lot of information related to the market which includes the quarterly reports, the daily stock prices, and other relevant information. Our data bank server gets updated every fortnight and that is how the information which we collected using our primary and secondary information is revalidated in real time.
Step 4: QA/QC Process
After all the data collection and validation our team does a final level of quality check and quality assurance to get rid of any unwanted or undesired mistakes. This might include but not limited to getting rid of the any typos, duplication of numbers or missing of any important information. The people involved in this process include technical content writers, research heads and graphics people. Once this process is completed the title gets uploader on our platform for our clients to read it.
Step 5: Final QC/QA Process:
This is the last process and comes when the client has ordered the study. In this process a final QA/QC is done before the study is emailed to the client. Since we believe in giving our clients a good experience of our research studies, therefore, to make sure that we do not lack at our end in any way humanly possible we do a final round of quality check and then dispatch the study to the client.
Key Segments:
By Type
Monoethanolamine
Triethanolamine
Diethanolamine
By Application
Detergents
Ethyleneamines
Herbicides Intermediate
Metal Cleaning
Textile
Gas Purification
Others
Request for Segment Customization as per your Business Requirement: Segment Customization Request
Regional Coverage:
North America
US
Canada
Mexico
Europe
Eastern Europe
Poland
Romania
Hungary
Turkey
Rest of Eastern Europe
Western Europe
Germany
France
UK
Italy
Spain
Netherlands
Switzerland
Austria
Rest of Western Europe
Asia Pacific
China
India
Japan
South Korea
Vietnam
Singapore
Australia
Rest of Asia Pacific
Middle East & Africa
Middle East
UAE
Egypt
Saudi Arabia
Qatar
Rest of Middle East
Africa
Nigeria
South Africa
Rest of Africa
Latin America
Brazil
Argentina
Colombia
Rest of Latin America
Request for Country Level Research Report: Country Level Customization Request
Available Customization
With the given market data, SNS Insider offers customization as per the company’s specific needs. The following customization options are available for the report:
Product Analysis
Criss-Cross segment analysis (e.g. Product X Application)
Product Matrix which gives a detailed comparison of product portfolio of each company
Geographic Analysis
Additional countries in any of the regions
Company Information
Detailed analysis and profiling of additional market players (Up to five)
The Alkyl Polyglucosides Market size was valued at USD 1.1 Billion in 2023. It is expected to grow to USD 1.9 Billion by 2032 and grow at a CAGR of 6.5% over the forecast period of 2024-2032.
The Decarbonization Market was worth USD 311.71 billion in 2023 and is expected to grow to USD 3.54 trillion by 2032, with a CAGR of 31.24% by 2024-2032.
The Activated Carbon Market Size was valued at USD 4.9 billion in 2023 and is expected to reach USD 9.2 billion by 2032 and grow at a CAGR of 7.3% over the forecast period 2024-2032.
The Copper Fungicides Market size was valued at USD 335.65 million in 2023. It is expected to grow to USD 500.26 million by 2031 and grow at a CAGR of 5.1% over the forecast period of 2024-2031.
The Nanocellulose Market Size was valued at USD 492.4 million in 2023 and will reach USD 2690.3 Million by 2032 and grow at a CAGR of 20.8% by 2024-2032.
The Methanol Market Size was valued at USD 33.7 billion in 2023, and expected to reach USD 54.5 billion by 2032, and grow at a CAGR of 5.5% over the forecast period 2024-2032.
Hi! Click one of our member below to chat on Phone