image

Soft Facility Management Market Size, Share & Segmentation By Offering (Outsourced, In-house), Soft Services (Office Support and Security Services, Cleaning Services, Catering Services, Other), Organization Size (Large Enterprises, Small & Medium Enterprises), End Use (Business & Corporate, Healthcare, Retail, Education, Travel & Hospitality, Construction & Real Estate, Government & Public Sector, Manufacturing, Military & Defense, Others), Region | Global Forecast 2025-2032

Date: July 2025 Report Code: SNS/ICT/7987 Page 320

Soft Facility Management Market Report Scope & Overview:

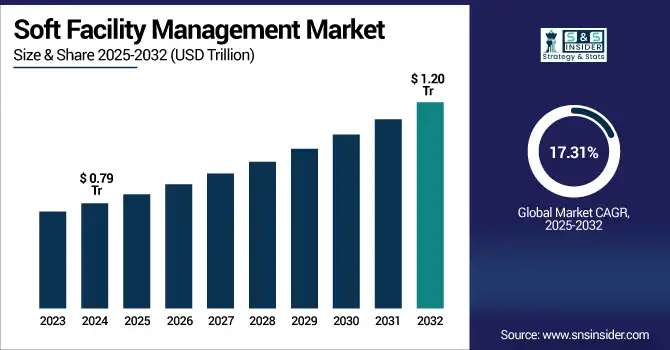
Soft Facility Management Market size was valued at USD 0.79 trillion in 2024 and is expected to reach USD 1.20 trillion by 2032, growing at a CAGR of 17.31% from 2025-2032. 

The Soft Facility Management Market growth is driven by increasing demand for outsourced services, rising emphasis on workplace hygiene and safety, and growing adoption of integrated facility management solutions. As organizations focus on cost-efficiency and core business operations, the shift toward third-party management of services like cleaning, catering, and security is accelerating. Additionally, advancements in digital technologies such as IoT and cloud platforms are enhancing operational transparency and service quality. Rapid urbanization, expansion of commercial infrastructure, and the need for sustainable, flexible, and employee-centric workplaces are further propelling market growth across diverse sectors including healthcare, education, and corporate enterprises.

  • According to the U.S. International Trade Commission (USITC), professional services including facility management, catering, security, and cleaning accounted for USD 378.2 billion in cross-border U.S. exports and USD 184.7 billion in imports in 2023, underscoring the significant global trade and reliance on outsourced services.

U.S. Soft Facility Management Market size was valued at USD 0.20 trillion in 2024 and is expected to reach USD 0.30 trillion by 2032, growing at a CAGR of 5.25% from 2025-2032. 

The U.S. Soft Facility Management Market is growing due to increasing corporate outsourcing, rising demand for workplace safety and cleanliness, and greater focus on employee well-being. Growth is further supported by regulatory compliance needs, expansion of healthcare and commercial sectors, and the adoption of tech-driven facility management solutions across industries.

Market Dynamics

Drivers

  • Growing demand for cost-effective, outsourced facility solutions across commercial and industrial sectors is driving soft FM adoption globally.

As businesses come under more pressure to cut operational overheads, many are opting to outsource non-core functions such as cleaning, catering and landscaping. Soft facility management (FM) services are elected by organizations as a strategic decision for maintaining hygiene, safety, and customer experience keeping the direct labor or infrastructure cost at bay. The flexibility of service contracts, packaged services, and scalability across different environments (retail, education, healthcare and offices), makes outsourced soft FM very attractive. As a result, the adoption of soft FM has continued to grow in developed and developing economies.

  • The National Institute of Standards and Technology (NIST) quantified $15.8 billion annually in inefficiencies due to poor interoperability in the U.S. capital facilities sector (including commercial, institutional, and industrial facilities), noting that two-thirds of these costs fall on facility owners and operators.

Restraints

  • Low awareness and lack of standardization in developing regions hinder widespread soft FM adoption and market penetration.

Many developing nations continue to rely on informal or unorganized facility service arrangements with only a limited awareness of structured FM models at enterprise levels. The lack of regulatory enforcement, clear meter service standards, and metering workforce credentialing undermines the confidence in outsourced solutions. Across these regions, SMEs either consider setting up formal contracts as too expensive, or have issues of trust/haship. As a result, service providers are unable to scale or reach these markets, limiting total market growth and preventing service providers from capturing latent demand in under-exploited regions.

Opportunities

  • Increased digitalization and IoT-enabled facility solutions present massive growth potential for soft FM service differentiation and automation.

The usage of digital tools like smart sensors, mobile workforce apps, and CAFM (Computer-Aided Facility Management) for real-time monitoring, and automation of soft FM tasks. They contribute to quality service, transparency, and cost efficiency by allowing management to keep track of cleaning schedules, waste levels, and room occupancy, among other data. Enterprise tech providers can leverage technology-driven service capabilities in order to address smart buildings, airports, hospitals, and many more sectors thereby winning larger contracts by delivering greater value faster. With digital transformation gaining momentum across verticals, combining data-driven soft FM opens up avenues for new revenue streams and enhanced client engagement for service providers.

  • In a 2022 survey, 78% of facilities had deployed smart-building technologies and the same share reported energy efficiency gains and cost reductions as a result. However, 94% of adopters collect data, yet 34% say they lack the skills to fully leverage analytics highlighting a key challenge in realizing full value.

  • According to GEP, IoT solutions in facility settings can cut maintenance costs by up to 20%, lower unplanned downtime by up to 50%, and extend asset lifespan by 25%, reinforcing the strong ROI of automation

Challenges

  • High workforce dependency and labor shortages limit scalability and service quality in the soft FM industry.

Soft FM services like cleaning, catering and concierge are still low tech and manpower-intensive, leeching on a large low-skilled workforce. Service providers are unable to manage quality and speed of service due to increasing labor shortages in both developed economies and a few developing economies. Wage inflation, unionization, and immigration restrictions are also making it challenging to manage the workforce. Moreover, changing personnel entails retraining costs and inconsistencies in quality. These issues pertaining to workforce services are a choke point in scaling up operations, keeping clients engaged and ensuring continuity of services across locations.

Segment Analysis

By Organization Size

Large enterprises dominated the Soft Facility Management market due to their extensive infrastructure, high operational complexity, and need for consistent service quality across multiple locations. These organizations prefer comprehensive, long-term FM contracts that ensure compliance, brand reputation, and efficiency. Their substantial budgets allow investment in integrated FM solutions, supporting large-scale outsourcing and tech adoption to streamline operations across diverse corporate, industrial, and institutional environments.

Small and medium enterprises are expected to grow fastest due to increasing awareness of cost-efficiency and professionalism through outsourced FM services. As SMEs scale operations and adopt formal management practices, demand rises for structured facility support. The trend toward digital transformation and flexible service contracts enables SMEs to access high-quality FM solutions without heavy capital expenditure, driving strong growth across sectors like retail, co-working spaces, and regional office setups.

By Offering

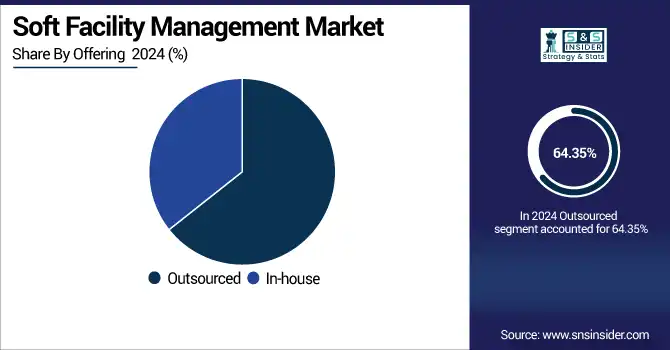
Outsourced services dominate the market because organizations prioritize core business focus while reducing costs and compliance burdens through third-party expertise. Outsourcing offers access to trained personnel, latest tools, and scalable services without managing internal teams. This model also ensures better service accountability and performance through defined contracts and KPIs, especially in sectors like IT parks, airports, hospitals, and malls requiring specialized, 24/7 facility management.

In-house FM is projected to grow fastest as some organizations seek greater control over service quality, branding, and data security. This is particularly true in sensitive sectors such as government institutions, defense, and critical infrastructure, where internal teams ensure confidentiality. Moreover, advancements in digital FM tools are enabling in-house teams to efficiently manage and monitor operations, leading to a resurgence in insourcing trends for strategic FM needs.

By End Use

The business and corporate segment led the market due to the vast number of commercial offices, tech campuses, and administrative buildings requiring regular soft FM services. These environments prioritize high standards of cleanliness, hospitality, security, and landscaping to support employee satisfaction and brand image. The segment’s consistent demand for year-round, high-volume services drives substantial revenue generation for FM providers.

The construction and real estate segment is projected to grow the fastest due to ongoing urbanization and infrastructure development. With rising demand for residential complexes, commercial spaces, and property management, FM providers are increasingly engaged in maintaining new builds. Additionally, developers and property managers outsource FM to ensure efficient operations, tenant satisfaction, and asset value preservation, especially across Asia-Pacific and the Middle East regions.

By Soft Services

Office support and security services held the largest share due to continuous, non-discretionary demand across all business sectors. Services like reception, mail handling, visitor management, and manned guarding are essential for daily operations, compliance, and risk mitigation. Security remains a top concern in offices, data centers, and high-rise buildings, prompting organizations to invest steadily in this segment for peace of mind and business continuity.

Cleaning services are expected to expand fastest due to heightened post-pandemic hygiene awareness across public, healthcare, and work environments. Organizations now demand frequent deep-cleaning, sanitization, and specialized services like HVAC cleaning and disinfection. Regulatory standards and employee wellness initiatives are driving higher budgets for cleaning. Furthermore, automation, eco-friendly products, and outcome-based cleaning models are attracting both new contracts and technology-driven upgrades across industries.

Regional Analysis

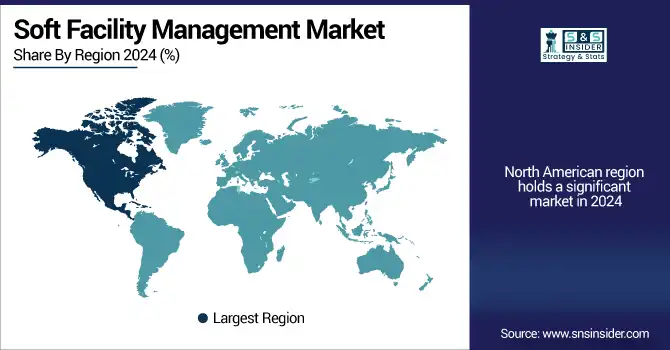
North America dominated the Soft Facility Management market due to its mature infrastructure, high outsourcing penetration, and strong presence of multinational corporations demanding professional FM services. The region benefits from advanced technology adoption, stringent regulatory standards, and a well-established service provider ecosystem. Sectors like corporate offices, healthcare, education, and retail consistently invest in premium soft FM solutions, ensuring continued market leadership and recurring contract-based revenue generation.

The U.S. is dominating the Soft Facility Management market in North America due to its vast commercial infrastructure and high outsourcing adoption.

Asia Pacific is projected to grow fastest owing to rapid urbanization, infrastructure expansion, and increasing outsourcing trends across emerging economies. Rising awareness of organized facility services, growing commercial real estate, and rising foreign investment in industrial parks fuel demand. Governments across India, China, and Southeast Asia are also pushing for smart cities and modern public infrastructure, creating significant opportunities for soft FM providers to scale operations and tap into underserved markets.

Europe holds a major position in the Soft Facility Management market due to mature infrastructure, strict compliance standards, and widespread outsourcing practices across commercial, institutional, and public sectors, driving consistent demand for integrated and specialized facility services.

The U.K. is dominating the Soft Facility Management market in Europe due to its advanced FM practices, outsourcing maturity, and strong corporate demand.

Middle East & Africa and Latin America are witnessing steady growth in the Soft Facility Management market, driven by expanding infrastructure, rising urbanization, and increasing outsourcing in commercial and institutional sectors, supported by growing awareness of organized facility services and hygiene standards.

Key Players

AHI Facility Services Inc., Aramark, CBRE Group Inc., Compass Group, Cushman & Wakefield plc, Guardian Service Industries Inc., ISS A/S, SMI Facility Services, Sodexo Inc., Tenon Group, Mitie Group plc, Securitas AB, ABM Industries Inc., OCS Group, Serco Group plc, Atalian Global Services, Vinci Facilities, Brookfield Global Integrated Solutions (BGIS), JLL (Jones Lang LaSalle Incorporated), Cleansing Service Group (CSG).


Recent Developments:

  • 2025: ISS A/S signed a new multi‑country facility services agreement with a global technology client, expanding coverage into three European countries, valued at over DKK 100 million annually over three years, effective July 2025.

  • 2023: CBRE Group Inc. deployed its AI‑powered Nexus platform across 1 billion sq ft for Smart FM, improving maintenance efficiency, reducing energy costs by ~20% and technician dispatches by ~25%.

Soft Facility Management Market Report Scope:

Report Attributes Details
Market Size in 2024 USD 0.79 Trillion 
Market Size by 2032 USD 1.20 Trillion 
CAGR CAGR of 5.51% From 2025 to 2032
Base Year 2024
Forecast Period 2025-2032
Historical Data 2021-2023
Report Scope & Coverage Market Size, Segments Analysis, Competitive Landscape, Regional Analysis, DROC & SWOT Analysis, Forecast Outlook
Key Segments • By Offering (Outsourced, In-house)
• By Soft Services (Office Support and Security Services, Cleaning Services, Catering Services, Other)
• By Organization Size (Large Enterprises, Small & Medium Enterprises)
• By End Use (Business & Corporate, Healthcare, Retail, Education, Travel & Hospitality, Construction & Real Estate, Government & Public Sector, Manufacturing, Military & Defense, Others)
Regional Analysis/Coverage North America (US, Canada), Europe (Germany, UK, France, Italy, Spain, Russia, Poland, Rest of Europe), Asia Pacific (China, India, Japan, South Korea, Australia, ASEAN Countries, Rest of Asia Pacific), Middle East & Africa (UAE, Saudi Arabia, Qatar, South Africa, Rest of Middle East & Africa), Latin America (Brazil, Argentina, Mexico, Colombia, Rest of Latin America).
Company Profiles AHI Facility Services Inc., Aramark, CBRE Group Inc., Compass Group, Cushman & Wakefield plc, Guardian Service Industries Inc., ISS A/S, SMI Facility Services, Sodexo Inc., Tenon Group, Mitie Group plc, Securitas AB, ABM Industries Inc., OCS Group, Serco Group plc, Atalian Global Services, Vinci Facilities, Brookfield Global Integrated Solutions (BGIS), JLL (Jones Lang LaSalle Incorporated), Cleansing Service Group (CSG)

Frequently Asked Questions

Ans: The Soft Facility Management Market is expected to grow at a CAGR of 17.31% from 2025 to 2032, driven by rising demand for outsourced services.

Ans: The Soft Facility Management Market was valued at USD 0.79 trillion in 2024, with strong demand across commercial and institutional sectors

Ans: Growing preference for cost-efficient outsourced services, focus on hygiene, and digital integration are driving strong growth in the soft FM market.

Ans: The Outsourced segment dominated the market with a 69% share in 2024, as businesses prioritize third-party expertise and operational efficiency.

Ans: North America dominated the market in 2024, accounting for 35% share, supported by mature infrastructure and high outsourcing penetration.

Table Of Contents

1. Introduction

1.1 Market Definition & Scope

 1.2 Research Assumptions & Abbreviations

 1.3 Research Methodology

2. Executive Summary

2.1 Market Snapshot

 2.2 Market Absolute $ Opportunity Assessment & Y-o-Y Analysis, 2021–2032

 2.3 Market Size & Forecast, By Segmentation, 2021–2032

  2.3.1 Market Size By Offering

  2.3.2 Market Size By Soft Services

         2.3.3 Market Size By Organization Size

  2.3.4 Market Size By End Use

 2.4 Market Share & Bps Analysis By Region, 2024

 2.5 Industry Growth Scenarios – Conservative, Likely & Optimistic

 2.6 Industry CxO’s Perspective

3. Market Overview

3.1 Market Dynamics

  3.1.1 Drivers

  3.1.2 Restraints

  3.1.3 Opportunities

  3.1.4 Key Market Trends

 3.2 Industry PESTLE Analysis

 3.3 Key Industry Forces (Porter’s) Impacting Market Growth

 3.4 Industry Supply Chain Analysis

  3.4.1 Raw Material Suppliers

  3.4.2 Manufacturers

  3.4.3 Distributors/Suppliers

  3.4.4 Customers/End-Users

 3.5 Industry Life Cycle Assessment

 3.6 Parent Market Overview

 3.7 Market Risk Assessment

4. Statistical Insights & Trends Reporting

4.1 Operational & Service Delivery Metrics

4.1.1 Number of Outsourced Soft FM Contracts (by Country or Sector)
4.1.2 Average Contract Duration (Years)
4.1.3 % of Facilities Utilizing Integrated Soft FM Services
4.1.4 Vendor Retention or Contract Renewal Rate (%)
4.1.5 Average Response Time for Service Requests (Minutes/Hours)

4.2 Workforce & Staffing Metrics

4.2.1 Number of Soft FM Professionals Employed (Global / Regional)
4.2.2 Average Training Hours per Employee per Year
4.2.3 Gender Diversity Ratio in Soft FM Roles
4.2.4 Staff Turnover Rate (%) in Soft FM Companies
4.2.5 Ratio of Permanent vs. Contractual Workers

4.3 Technology Adoption Metrics

4.3.1 % Facilities Using IoT-based Cleaning or Security Solutions
4.3.2 CMMS / CAFM System Adoption Rate (%)
4.3.3 % Automation in Helpdesk and Work Order Management
4.3.4 Energy & Waste Monitoring Software Penetration (%)
4.3.5 Mobile App Utilization Rate for Field Service Management

4.4 Cost & Efficiency Metrics

4.4.1 Average Annual Soft FM Spend per Facility (USD)
4.4.2 Cost Savings Achieved via Outsourced Soft FM (%)
4.4.3 Cleaning Service Cost per Square Meter (USD)
4.4.4 Security Service Cost per Employee or Site (USD)
4.4.5 Waste Disposal or Recycling Cost per Ton (USD)

4.5 Sustainability & ESG Metrics

4.5.1 % Facilities with Green Cleaning Certifications
4.5.2 Emission Reduction Achieved via Sustainable FM Practices (%)
4.5.3 Recycling Rate Achieved by FM Providers (%)
4.5.4 % Eco-Friendly Consumables Used in Janitorial Services
4.5.5 Average Carbon Footprint per Facility Managed

4.6 Compliance, Quality & Risk Metrics

4.6.1 % Facilities Audited for FM Compliance (ISO, OSHA, etc.)
4.6.2 Number of Compliance Violations per 100 Facilities
4.6.3 Customer Satisfaction Score (CSAT) Across FM Services
4.6.4 Net Promoter Score (NPS) of FM Providers
4.6.5 Average Facility Risk Mitigation Incidents (Security or Hygiene)

5. Soft Facility Management Market Segmental Analysis & Forecast, By Offering, 2021 – 2032, Value (USD Trillion)

5.1 Introduction

 5.2 Outsourced

  5.2.1 Key Trends

  5.2.2 Market Size & Forecast, 2021 – 2032

 5.3 In-house

  5.3.1 Key Trends

  5.3.2 Market Size & Forecast, 2021 – 2032

6. Soft Facility Management Market Segmental Analysis & Forecast, By Soft Services, 2021 – 2032, Value (USD Trillion)

    6.1 Introduction

 6.2 Office Support and Security Services

  6.2.1 Key Trends

  6.2.2 Market Size & Forecast, 2021 – 2032

 6.3 Cleaning Services

  6.3.1 Key Trends

  6.3.2 Market Size & Forecast, 2021 – 2032

 6.4 Catering Services

  6.4.1 Key Trends

  6.4.2 Market Size & Forecast, 2021 – 2032

 6.5 Other

  6.5.1 Key Trends

  6.5.2 Market Size & Forecast, 2021 – 2032

7. Soft Facility Management Market Segmental Analysis & Forecast, By Organization Size, 2021 – 2032, Value (USD Trillion)

    7.1 Introduction

 7.2 Large Enterprises

  7.2.1 Key Trends

  7.2.2 Market Size & Forecast, 2021 – 2032

 7.3 Small & Medium Enterprises

  7.3.1 Key Trends

  7.3.2 Market Size & Forecast, 2021 – 2032

8. Soft Facility Management Market Segmental Analysis & Forecast, By End Use, 2021 – 2032, Value (USD Trillion)

    8.1 Introduction

         8.2 Business & Corporate

    8.2.1 Key Trends

    8.2.2 Market Size & Forecast, 2021 – 2032

  8.3 Healthcare

    8.3.1 Key Trends

    8.3.2 Market Size & Forecast, 2021 – 2032

  8.4 Retail

    8.4.1 Key Trends

    8.4.2 Market Size & Forecast, 2021 – 2032

  8.5 Education

    8.5.1 Key Trends

    8.5.2 Market Size & Forecast, 2021 – 2032

  8.6 Travel & Hospitality

    8.6.1 Key Trends

    8.6.2 Market Size & Forecast, 2021 – 2032

  8.7 Construction & Real Estate

    8.7.1 Key Trends

    8.7.2 Market Size & Forecast, 2021 – 2032

  8.8 Government & Public Sector

    8.8.1 Key Trends

    8.8.2 Market Size & Forecast, 2021 – 2032

  8.9 Manufacturing

    8.9.1 Key Trends

    8.9.2 Market Size & Forecast, 2021 – 2032

  8.10 Military & Defense

    8.10.1 Key Trends

    8.10.2 Market Size & Forecast, 2021 – 2032

  8.11 Others

    8.11.1 Key Trends

    8.11.2 Market Size & Forecast, 2021 – 2032

9. Soft Facility Management Market Segmental Analysis & Forecast By Region, 2021 – 2025, Value (USD Trillion)

9.1 Introduction

9.2 North America

 9.2.1 Key Trends

 9.2.2 Soft Facility Management Market Size & Forecast, By Offering, 2021 – 2032

 9.2.3 Soft Facility Management Market Size & Forecast, By Soft Services, 2021 – 2032

 9.2.4 Soft Facility Management Market Size & Forecast, By Organization Size, 2021 – 2032

 9.2.5 Soft Facility Management Market Size & Forecast, By End Use, 2021 – 2032

 9.2.6 Soft Facility Management Market Size & Forecast, By Country, 2021 – 2032

  9.2.6.1 USA

   9.2.6.1.1 Soft Facility Management Market Size & Forecast, By Offering, 2021 – 2032

   9.2.6.1.2 Soft Facility Management Market Size & Forecast, By Soft Services, 2021 – 2032

   9.2.6.1.3 Soft Facility Management Market Size & Forecast, By Organization Size, 2021 – 2032

   9.2.6.1.4 Soft Facility Management Market Size & Forecast, By End Use, 2021 – 2032

  9.2.6.2 Canada

   9.2.6.2.1 Soft Facility Management Market Size & Forecast, By Offering, 2021 – 2032

   9.2.6.2.2 Soft Facility Management Market Size & Forecast, By Soft Services, 2021 – 2032

   9.2.6.2.3 Soft Facility Management Market Size & Forecast, By Organization Size, 2021 – 2032

   9.2.6.2.4 Soft Facility Management Market Size & Forecast, By End Use, 2021 – 2032

9.3 Europe

 9.3.1 Key Trends

 9.3.2 Soft Facility Management Market Size & Forecast, By Offering, 2021 – 2032

 9.3.3 Soft Facility Management Market Size & Forecast, By Soft Services, 2021 – 2032

 9.3.4 Soft Facility Management Market Size & Forecast, By Organization Size, 2021 – 2032

 9.3.5 Soft Facility Management Market Size & Forecast, By End Use, 2021 – 2032

 9.3.6 Soft Facility Management Market Size & Forecast, By Country, 2021 – 2032

  9.3.6.1 Germany

   9.3.6.1.1 Soft Facility Management Market Size & Forecast, By Offering, 2021 – 2032

   9.3.6.1.2 Soft Facility Management Market Size & Forecast, By Soft Services, 2021 – 2032

   9.3.6.1.3 Soft Facility Management Market Size & Forecast, By Organization Size, 2021 – 2032

   9.3.6.1.4 Soft Facility Management Market Size & Forecast, By End Use, 2021 – 2032

  9.3.6.2 UK

   9.3.6.2.1 Soft Facility Management Market Size & Forecast, By Offering, 2021 – 2032

   9.3.6.2.2 Soft Facility Management Market Size & Forecast, By Soft Services, 2021 – 2032

   9.3.6.2.3 Soft Facility Management Market Size & Forecast, By Organization Size, 2021 – 2032

   9.3.6.2.4 Soft Facility Management Market Size & Forecast, By End Use, 2021 – 2032

  9.3.6.3 France

   9.3.6.3.1 Soft Facility Management Market Size & Forecast, By Offering, 2021 – 2032

   9.3.6.3.2 Soft Facility Management Market Size & Forecast, By Soft Services, 2021 – 2032

   9.3.6.3.3 Soft Facility Management Market Size & Forecast, By Organization Size, 2021 – 2032

   9.3.6.3.4 Soft Facility Management Market Size & Forecast, By End Use, 2021 – 2032

  9.3.6.4 Italy

   9.3.6.4.1 Soft Facility Management Market Size & Forecast, By Offering, 2021 – 2032

   9.3.6.4.2 Soft Facility Management Market Size & Forecast, By Soft Services, 2021 – 2032

   9.3.6.4.3 Soft Facility Management Market Size & Forecast, By Organization Size, 2021 – 2032

   9.3.6.4.4 Soft Facility Management Market Size & Forecast, By End Use, 2021 – 2032

  9.3.6.5 Spain

   9.3.6.5.1 Soft Facility Management Market Size & Forecast, By Offering, 2021 – 2032

   9.3.6.5.2 Soft Facility Management Market Size & Forecast, By Soft Services, 2021 – 2032

   9.3.6.5.3 Soft Facility Management Market Size & Forecast, By Organization Size, 2021 – 2032

   9.3.6.5.4 Soft Facility Management Market Size & Forecast, By End Use, 2021 – 2032

  9.3.6.6 Russia

   9.3.6.6.1 Soft Facility Management Market Size & Forecast, By Offering, 2021 – 2032

   9.3.6.6.2 Soft Facility Management Market Size & Forecast, By Soft Services, 2021 – 2032

   9.3.6.6.3 Soft Facility Management Market Size & Forecast, By Organization Size, 2021 – 2032

   9.3.6.6.4 Soft Facility Management Market Size & Forecast, By End Use, 2021 – 2032

  9.3.6.7 Poland

   9.3.6.7.1 Soft Facility Management Market Size & Forecast, By Offering, 2021 – 2032

   9.3.6.7.2 Soft Facility Management Market Size & Forecast, By Soft Services, 2021 – 2032

   9.3.6.7.3 Soft Facility Management Market Size & Forecast, By Organization Size, 2021 – 2032

   9.3.6.7.4 Soft Facility Management Market Size & Forecast, By End Use, 2021 – 2032

  9.3.6.8 Rest of Europe

   9.3.6.8.1 Soft Facility Management Market Size & Forecast, By Offering, 2021 – 2032

   9.3.6.8.2 Soft Facility Management Market Size & Forecast, By Soft Services, 2021 – 2032

   9.3.6.8.3 Soft Facility Management Market Size & Forecast, By Organization Size, 2021 – 2032

   9.3.6.8.4 Soft Facility Management Market Size & Forecast, By End Use, 2021 – 2032   

9.4 Asia-Pacific

 9.4.1 Key Trends

 9.4.2 Soft Facility Management Market Size & Forecast, By Offering, 2021 – 2032

 9.4.3 Soft Facility Management Market Size & Forecast, By Soft Services, 2021 – 2032

 9.4.4 Soft Facility Management Market Size & Forecast, By Organization Size, 2021 – 2032

 9.4.5 Soft Facility Management Market Size & Forecast, By End Use, 2021 – 2032

 9.4.6 Soft Facility Management Market Size & Forecast, By Country, 2021 – 2032

  9.4.6.1 China

   9.4.6.1.1 Soft Facility Management Market Size & Forecast, By Offering, 2021 – 2032

   9.4.6.1.2 Soft Facility Management Market Size & Forecast, By Soft Services, 2021 – 2032

   9.4.6.1.3 Soft Facility Management Market Size & Forecast, By Organization Size, 2021 – 2032

   9.4.6.1.4 Soft Facility Management Market Size & Forecast, By End Use, 2021 – 2032

  9.4.6.2 India

   9.4.6.2.1 Soft Facility Management Market Size & Forecast, By Offering, 2021 – 2032

   9.4.6.2.2 Soft Facility Management Market Size & Forecast, By Soft Services, 2021 – 2032

   9.4.6.2.3 Soft Facility Management Market Size & Forecast, By Organization Size, 2021 – 2032

   9.4.6.2.4 Soft Facility Management Market Size & Forecast, By End Use, 2021 – 2032

  9.4.6.3 Japan

   9.4.6.3.1 Soft Facility Management Market Size & Forecast, By Offering, 2021 – 2032

   9.4.6.3.2 Soft Facility Management Market Size & Forecast, By Soft Services, 2021 – 2032

   9.4.6.3.3 Soft Facility Management Market Size & Forecast, By Organization Size, 2021 – 2032

   9.4.6.3.4 Soft Facility Management Market Size & Forecast, By End Use, 2021 – 2032

  9.4.6.4 South Korea

   9.4.6.4.1 Soft Facility Management Market Size & Forecast, By Offering, 2021 – 2032

   9.4.6.4.2 Soft Facility Management Market Size & Forecast, By Soft Services, 2021 – 2032

   9.4.6.4.3 Soft Facility Management Market Size & Forecast, By Organization Size, 2021 – 2032

   9.4.6.4.4 Soft Facility Management Market Size & Forecast, By End Use, 2021 – 2032

  9.4.6.5 Australia

   9.4.6.5.1 Soft Facility Management Market Size & Forecast, By Offering, 2021 – 2032

   9.4.6.5.2 Soft Facility Management Market Size & Forecast, By Soft Services, 2021 – 2032

   9.4.6.5.3 Soft Facility Management Market Size & Forecast, By Organization Size, 2021 – 2032

   9.4.6.5.4 Soft Facility Management Market Size & Forecast, By End Use, 2021 – 2032

  9.4.6.6 ASEAN Countries

   9.4.6.6.1 Soft Facility Management Market Size & Forecast, By Offering, 2021 – 2032

   9.4.6.6.2 Soft Facility Management Market Size & Forecast, By Soft Services, 2021 – 2032

   9.4.6.6.3 Soft Facility Management Market Size & Forecast, By Organization Size, 2021 – 2032

   9.4.6.6.4 Soft Facility Management Market Size & Forecast, By End Use, 2021 – 2032

  9.4.6.7 Rest of Asia-Pacific

   9.4.6.7.1 Soft Facility Management Market Size & Forecast, By Offering, 2021 – 2032

   9.4.6.7.2 Soft Facility Management Market Size & Forecast, By Soft Services, 2021 – 2032

   9.4.6.7.3 Soft Facility Management Market Size & Forecast, By Organization Size, 2021 – 2032

   9.4.6.7.4 Soft Facility Management Market Size & Forecast, By End Use, 2021 – 2032

9.5 Latin America

 9.5.1 Key Trends

 9.5.2 Soft Facility Management Market Size & Forecast, By Offering, 2021 – 2032

 9.5.3 Soft Facility Management Market Size & Forecast, By Soft Services, 2021 – 2032

 9.5.4 Soft Facility Management Market Size & Forecast, By Organization Size, 2021 – 2032

 9.5.5 Soft Facility Management Market Size & Forecast, By End Use, 2021 – 2032

 9.5.6 Soft Facility Management Market Size & Forecast, By Country, 2021 – 2032

  9.5.6.1 Brazil

   9.5.6.1.1 Soft Facility Management Market Size & Forecast, By Offering, 2021 – 2032

   9.5.6.1.2 Soft Facility Management Market Size & Forecast, By Soft Services, 2021 – 2032

   9.5.6.1.3 Soft Facility Management Market Size & Forecast, By Organization Size, 2021 – 2032

   9.5.6.1.4 Soft Facility Management Market Size & Forecast, By End Use, 2021 – 2032

  9.5.6.2 Argentina

   9.5.6.2.1 Soft Facility Management Market Size & Forecast, By Offering, 2021 – 2032

   9.5.6.2.2 Soft Facility Management Market Size & Forecast, By Soft Services, 2021 – 2032

   9.5.6.2.3 Soft Facility Management Market Size & Forecast, By Organization Size, 2021 – 2032

   9.5.6.2.4 Soft Facility Management Market Size & Forecast, By End Use, 2021 – 2032

  9.5.6.3 Mexico

   9.5.6.3.1 Soft Facility Management Market Size & Forecast, By Offering, 2021 – 2032

   9.5.6.3.2 Soft Facility Management Market Size & Forecast, By Soft Services, 2021 – 2032

   9.5.6.3.3 Soft Facility Management Market Size & Forecast, By Organization Size, 2021 – 2032

   9.5.6.3.4 Soft Facility Management Market Size & Forecast, By End Use, 2021 – 2032

  9.5.6.4 Colombia

   9.5.6.4.1 Soft Facility Management Market Size & Forecast, By Offering, 2021 – 2032

   9.5.6.4.2 Soft Facility Management Market Size & Forecast, By Soft Services, 2021 – 2032

   9.5.6.4.3 Soft Facility Management Market Size & Forecast, By Organization Size, 2021 – 2032

   9.5.6.4.4 Soft Facility Management Market Size & Forecast, By End Use, 2021 – 2032

  9.5.6.5 Rest of Latin America

   9.5.6.5.1 Soft Facility Management Market Size & Forecast, By Offering, 2021 – 2032

   9.5.6.5.2 Soft Facility Management Market Size & Forecast, By Soft Services, 2021 – 2032

   9.5.6.5.3 Soft Facility Management Market Size & Forecast, By Organization Size, 2021 – 2032

   9.5.6.5.4 Soft Facility Management Market Size & Forecast, By End Use, 2021 – 2032

9.6 Middle East & Africa

 9.6.1 Key Trends

 9.6.2 Soft Facility Management Market Size & Forecast, By Offering, 2021 – 2032

 9.6.3 Soft Facility Management Market Size & Forecast, By Soft Services, 2021 – 2032

 9.6.4 Soft Facility Management Market Size & Forecast, By Organization Size, 2021 – 2032

 9.6.5 Soft Facility Management Market Size & Forecast, By End Use, 2021 – 2032

 9.6.6 Soft Facility Management Market Size & Forecast, By Country, 2021 – 2032

  9.6.6.1 UAE

   9.6.6.1.1 Soft Facility Management Market Size & Forecast, By Offering, 2021 – 2032

   9.6.6.1.2 Soft Facility Management Market Size & Forecast, By Soft Services, 2021 – 2032

   9.6.6.1.3 Soft Facility Management Market Size & Forecast, By Organization Size, 2021 – 2032

   9.6.6.1.4 Soft Facility Management Market Size & Forecast, By End Use, 2021 – 2032

  9.6.6.2 Saudi Arabia

   9.6.6.2.1 Soft Facility Management Market Size & Forecast, By Offering, 2021 – 2032

   9.6.6.2.2 Soft Facility Management Market Size & Forecast, By Soft Services, 2021 – 2032

   9.6.6.2.3 Soft Facility Management Market Size & Forecast, By Organization Size, 2021 – 2032

   9.6.6.2.4 Soft Facility Management Market Size & Forecast, By End Use, 2021 – 2032

  9.6.6.3 Qatar

   9.6.6.3.1 Soft Facility Management Market Size & Forecast, By Offering, 2021 – 2032

   9.6.6.3.2 Soft Facility Management Market Size & Forecast, By Soft Services, 2021 – 2032

   9.6.6.3.3 Soft Facility Management Market Size & Forecast, By Organization Size, 2021 – 2032

   9.6.6.3.4 Soft Facility Management Market Size & Forecast, By End Use, 2021 – 2032

  9.6.6.4 Egypt

   9.6.6.4.1 Soft Facility Management Market Size & Forecast, By Offering, 2021 – 2032

   9.6.6.4.2 Soft Facility Management Market Size & Forecast, By Soft Services, 2021 – 2032

   9.6.6.4.3 Soft Facility Management Market Size & Forecast, By Organization Size, 2021 – 2032

   9.6.6.4.4 Soft Facility Management Market Size & Forecast, By End Use, 2021 – 2032

  9.6.6.5 South Africa

   9.6.6.5.1 Soft Facility Management Market Size & Forecast, By Offering, 2021 – 2032

   9.6.6.5.2 Soft Facility Management Market Size & Forecast, By Soft Services, 2021 – 2032

   9.6.6.5.3 Soft Facility Management Market Size & Forecast, By Organization Size, 2021 – 2032

   9.6.6.5.4 Soft Facility Management Market Size & Forecast, By End Use, 2021 – 2032

  9.6.6.6 Rest of Middle East & Africa

   9.6.6.6.1 Soft Facility Management Market Size & Forecast, By Offering, 2021 – 2032

   9.6.6.6.2 Soft Facility Management Market Size & Forecast, By Soft Services, 2021 – 2032

   9.6.6.6.3 Soft Facility Management Market Size & Forecast, By Organization Size, 2021 – 2032

   9.6.6.6.4 Soft Facility Management Market Size & Forecast, By End Use, 2021 – 2032

10. Competitive Landscape

 10.1 Key Players' Positioning

 10.2 Competitive Developments

  10.2.1 Key Strategies Adopted (%), By Key Players, 2024

  10.2.2 Year-Wise Strategies & Development, 2021 – 2025

  10.2.3 Number Of Strategies Adopted By Key Players, 2024

 10.3 Market Share Analysis, 2024

 10.4 Product/Service & Application Benchmarking

  10.4.1 Product/Service Specifications & Features By Key Players

  10.4.2 Product/Service Heatmap By Key Players

  10.4.3 Application Heatmap By Key Players

 10.5 Industry Start-Up & Innovation Landscape

 10.6 Key Company Profiles

10.6 Key Company Profiles

10.6.1 AHI Facility Services Inc.

  10.6.1.1 Company Overview & Snapshot

  10.6.1.2 Product/Service Portfolio

  10.6.1.3 Key Company Financials

  10.6.1.4 SWOT Analysis

10.6.2 Aramark

  10.6.2.1 Company Overview & Snapshot

  10.6.2.2 Product/Service Portfolio

  10.6.2.3 Key Company Financials

  10.6.2.4 SWOT Analysis

10.6.3 CBRE Group Inc.

  10.6.3.1 Company Overview & Snapshot

  10.6.3.2 Product/Service Portfolio

  10.6.3.3 Key Company Financials

  10.6.3.4 SWOT Analysis

10.6.4 Compass Group

  10.6.4.1 Company Overview & Snapshot

  10.6.4.2 Product/Service Portfolio

  10.6.4.3 Key Company Financials

  10.6.4.4 SWOT Analysis

10.6.5 Cushman & Wakefield plc

  10.6.5.1 Company Overview & Snapshot

  10.6.5.2 Product/Service Portfolio

  10.6.5.3 Key Company Financials

  10.6.5.4 SWOT Analysis

10.6.6 Guardian Service Industries Inc.

  10.6.6.1 Company Overview & Snapshot

  10.6.6.2 Product/Service Portfolio

  10.6.6.3 Key Company Financials

  10.6.6.4 SWOT Analysis

10.6.7 ISS A/S

  10.6.7.1 Company Overview & Snapshot

  10.6.7.2 Product/Service Portfolio

  10.6.7.3 Key Company Financials

  10.6.7.4 SWOT Analysis

10.6.8 SMI Facility Services

  10.6.8.1 Company Overview & Snapshot

  10.6.8.2 Product/Service Portfolio

  10.6.8.3 Key Company Financials

  10.6.8.4 SWOT Analysis

10.6.9 Sodexo Inc.

  10.6.9.1 Company Overview & Snapshot

  10.6.9.2 Product/Service Portfolio

  10.6.9.3 Key Company Financials

  10.6.9.4 SWOT Analysis

10.6.10 Tenon Group

  10.6.10.1 Company Overview & Snapshot

  10.6.10.2 Product/Service Portfolio

  10.6.10.3 Key Company Financials

  10.6.10.4 SWOT Analysis

10.6.11 Mitie Group plc

  10.6.11.1 Company Overview & Snapshot

  10.6.11.2 Product/Service Portfolio

  10.6.11.3 Key Company Financials

  10.6.11.4 SWOT Analysis

10.6.12 Securitas AB

  10.6.12.1 Company Overview & Snapshot

  10.6.12.2 Product/Service Portfolio

  10.6.12.3 Key Company Financials

  10.6.12.4 SWOT Analysis

10.6.13 ABM Industries Inc.

  10.6.13.1 Company Overview & Snapshot

  10.6.13.2 Product/Service Portfolio

  10.6.13.3 Key Company Financials

  10.6.13.4 SWOT Analysis

10.6.14 OCS Group

  10.6.14.1 Company Overview & Snapshot

  10.6.14.2 Product/Service Portfolio

  10.6.14.3 Key Company Financials

  10.6.14.4 SWOT Analysis

10.6.15 Serco Group plc

  10.6.15.1 Company Overview & Snapshot

  10.6.15.2 Product/Service Portfolio

  10.6.15.3 Key Company Financials

  10.6.15.4 SWOT Analysis

10.6.16 Atalian Global Services

  10.6.16.1 Company Overview & Snapshot

  10.6.16.2 Product/Service Portfolio

  10.6.16.3 Key Company Financials

  10.6.16.4 SWOT Analysis

10.6.17 Vinci Facilities

  10.6.17.1 Company Overview & Snapshot

  10.6.17.2 Product/Service Portfolio

  10.6.17.3 Key Company Financials

  10.6.17.4 SWOT Analysis

10.6.18 Brookfield Global Integrated Solutions (BGIS)

  10.6.18.1 Company Overview & Snapshot

  10.6.18.2 Product/Service Portfolio

  10.6.18.3 Key Company Financials

  10.6.18.4 SWOT Analysis

10.6.19 JLL (Jones Lang LaSalle Incorporated)

  10.6.19.1 Company Overview & Snapshot

  10.6.19.2 Product/Service Portfolio

  10.6.19.3 Key Company Financials

  10.6.19.4 SWOT Analysis

10.6.20 Cleansing Service Group (CSG)

  10.6.20.1 Company Overview & Snapshot

  10.6.20.2 Product/Service Portfolio

  10.6.20.3 Key Company Financials

  10.6.20.4 SWOT Analysis

11. Analyst Recommendations

 11.1 SNS Insider Opportunity Map

 11.2 Industry Low-Hanging Fruit Assessment

 11.3 Market Entry & Growth Strategy

 11.4 Analyst Viewpoint & Suggestions On Market Growth

12. Assumptions

13. Disclaimer

14. Appendix

 14.1 List Of Tables

 14.2 List Of Figures

An accurate research report requires proper strategizing as well as implementation. There are multiple factors involved in the completion of good and accurate research report and selecting the best methodology to compete the research is the toughest part. Since the research reports we provide play a crucial role in any company’s decision-making process, therefore we at SNS Insider always believe that we should choose the best method which gives us results closer to reality. This allows us to reach at a stage wherein we can provide our clients best and accurate investment to output ratio.

Each report that we prepare takes a timeframe of 350-400 business hours for production. Starting from the selection of titles through a couple of in-depth brain storming session to the final QC process before uploading our titles on our website we dedicate around 350 working hours. The titles are selected based on their current market cap and the foreseen CAGR and growth.


The 5 steps process:

Step 1: Secondary Research:

Secondary Research or Desk Research is as the name suggests is a research process wherein, we collect data through the readily available information. In this process we use various paid and unpaid databases which our team has access to and gather data through the same. This includes examining of listed companies’ annual reports, Journals, SEC filling etc. Apart from this our team has access to various associations across the globe across different industries. Lastly, we have exchange relationships with various university as well as individual libraries.

Secondary Research

Step 2: Primary Research

When we talk about primary research, it is a type of study in which the researchers collect relevant data samples directly, rather than relying on previously collected data.  This type of research is focused on gaining content specific facts that can be sued to solve specific problems. Since the collected data is fresh and first hand therefore it makes the study more accurate and genuine.

We at SNS Insider have divided Primary Research into 2 parts.

Part 1 wherein we interview the KOLs of major players as well as the upcoming ones across various geographic regions. This allows us to have their view over the market scenario and acts as an important tool to come closer to the accurate market numbers. As many as 45 paid and unpaid primary interviews are taken from both the demand and supply side of the industry to make sure we land at an accurate judgement and analysis of the market.

This step involves the triangulation of data wherein our team analyses the interview transcripts, online survey responses and observation of on filed participants. The below mentioned chart should give a better understanding of the part 1 of the primary interview.

Primary Research

Part 2: In this part of primary research the data collected via secondary research and the part 1 of the primary research is validated with the interviews from individual consultants and subject matter experts.

Consultants are those set of people who have at least 12 years of experience and expertise within the industry whereas Subject Matter Experts are those with at least 15 years of experience behind their back within the same space. The data with the help of two main processes i.e., FGDs (Focused Group Discussions) and IDs (Individual Discussions). This gives us a 3rd party nonbiased primary view of the market scenario making it a more dependable one while collation of the data pointers.

Step 3: Data Bank Validation

Once all the information is collected via primary and secondary sources, we run that information for data validation. At our intelligence centre our research heads track a lot of information related to the market which includes the quarterly reports, the daily stock prices, and other relevant information. Our data bank server gets updated every fortnight and that is how the information which we collected using our primary and secondary information is revalidated in real time.

Data Bank Validation

Step 4: QA/QC Process

After all the data collection and validation our team does a final level of quality check and quality assurance to get rid of any unwanted or undesired mistakes. This might include but not limited to getting rid of the any typos, duplication of numbers or missing of any important information. The people involved in this process include technical content writers, research heads and graphics people. Once this process is completed the title gets uploader on our platform for our clients to read it.

Step 5: Final QC/QA Process:

This is the last process and comes when the client has ordered the study. In this process a final QA/QC is done before the study is emailed to the client. Since we believe in giving our clients a good experience of our research studies, therefore, to make sure that we do not lack at our end in any way humanly possible we do a final round of quality check and then dispatch the study to the client.

Key Segments: 

By Offering

    • Outsourced

    • In-house

By Soft Services

    • Office Support and Security Services

    • Cleaning Services

    • Catering Services

    • Other

By Organization Size

    • Large Enterprises

    • Small & Medium Enterprises

By End Use

    • Business & Corporate

    • Healthcare

    • Retail

    • Education

    • Travel & Hospitality

    • Construction & Real Estate

    • Government & Public Sector

    • Manufacturing

    • Military & Defense

    • Others


Request for Segment Customization as per your Business Requirement: Segment Customization Request

Regional Coverage: 

North America

  • US

  • Canada

Europe

  • Germany

  • France

  • UK

  • Italy

  • Spain

  • Poland

  • Russia

  • Rest of Europe

Asia Pacific

  • China

  • India

  • Japan

  • South Korea

  • Australia

  • ASEAN Countries

  • Rest of Asia Pacific

Middle East & Africa

  • UAE

  • Saudi Arabia

  • Qatar

  • South Africa

  • Rest of Middle East & Africa

Latin America

  • Brazil

  • Argentina

  • Mexico

  • Colombia

  • Rest of Latin America

Request for Country Level Research Report: Country Level Customization Request

Available Customization 

With the given market data, SNS Insider offers customization as per the company’s specific needs. The following customization options are available for the report: 

  • Detailed Volume Analysis 

  • Criss-Cross segment analysis (e.g. Product X Application) 

  • Competitive Product Benchmarking 

  • Geographic Analysis 

  • Additional countries in any of the regions 

  • Customized Data Representation 

  • Detailed analysis and profiling of additional market players

Explore Key Insights.


  • Analyzes market trends, forecasts, and regional dynamics
  • Covers core offerings, innovations, and industry use cases
  • Profiles major players, value chains, and strategic developments
  • Highlights innovation trends, regulatory impacts, and growth opportunities
Request an Analyst Call