Soft Starter Market Report Scope & Overview:
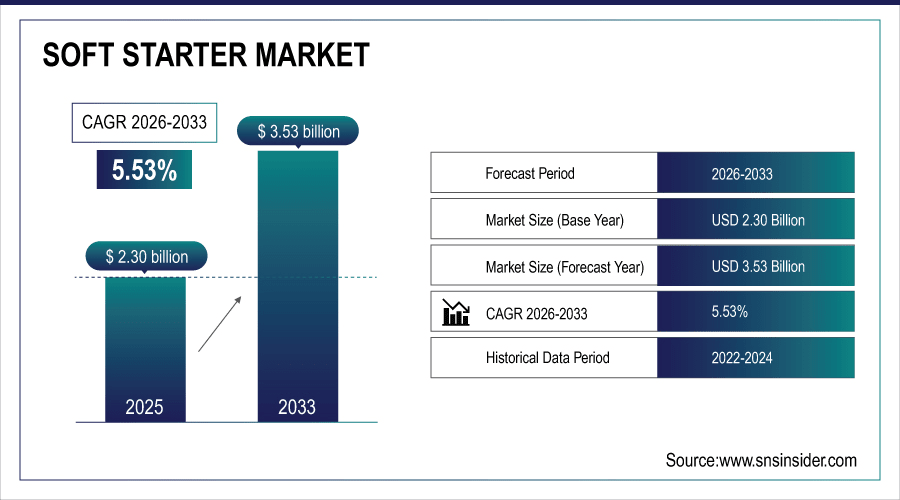
The Soft Starter Market Size was valued at USD 2.30 Billion in 2025E and is expected to reach USD 3.53 Billion by 2033 and grow at a CAGR of 5.53% over the forecast period 2026-2033.
The Soft Starter Market growth is due to the increasing demand for energy-efficient motor control solutions in several industries. The growing automation across the various industrial domains, the rapid expansion of urbanization, and the infrastructure developments are driving the usage of soft starters across pump, fan, & compressor applications. Moreover, increasing requirement to eliminate mechanical stress from motors, avoid inrush current and prolong life span of equipment is driving the growth of soft starter. Increased government initiatives across sectors focusing on energy efficiency and sustainable industrial practices are also fueling the growth of the market, especially across North America and Asia Pacific. According to study, Over 60% of industrial facilities are now investing in energy-efficient motor control solutions, boosting soft starter adoption.
To Get More Information On Soft Starter Market - Request Free Sample Report
Market Size and Forecast:
-
Market Size in 2025: USD 2.30 Billion
-
Market Size by 2033: USD 3.53 Billion
-
CAGR: 5.53% from 2026 to 2033
-
Base Year: 2025
-
Forecast Period: 2026–2033
-
Historical Data: 2022–2024
Soft Starter Market Trends
-
Increasing adoption of energy-efficient motor control solutions across industrial sectors worldwide.
-
Growing focus on smooth motor startups to reduce mechanical stress and wear.
-
Rising integration of soft starters with predictive maintenance and monitoring systems.
-
Expansion of IoT-enabled smart soft starters in automated manufacturing facilities.
-
Shift toward sustainable operations driving demand for energy-efficient motor solutions.
-
Early adoption of smart soft starters improving efficiency in industrial processes.
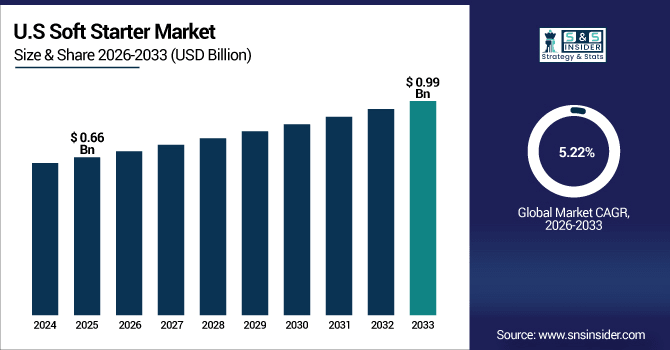
The U.S. Soft Starter Market size was USD 0.66 Billion in 2025E and is expected to reach USD 0.99 Billion by 2033, growing at a CAGR of 5.22% over the forecast period of 2026-2033, due to by advanced industrial automation, energy-efficient motor control adoption, and strong infrastructure. Leading companies focus on smart starters, predictive maintenance, and operational efficiency, driving steady growth across manufacturing, oil & gas, and energy sectors.
Soft Starter Market Growth Drivers:
-
Rising Demand for Energy-Efficient Motor Control Drives Market Expansion
The primary driver fueling the Soft Starter Market growth in adoption of energy efficient motor control solutions in industries such as mining, oil & gas, water treatment, manufacturing. By reducing electrical stress on motors, soft starters aid in lowering energy consumption, and thus, the operational costs while enhancing the lifespan of equipment. This turns them into a great investment for a company looking to streamline efficiency. Furthermore, the simultaneous proliferation of sustainable practices across the globe, in addition to government programs aimed towards the encouragement of efficient energy systems is accelerating the use of soft starters, as observed in the North America and Asia Pacific.
Industrial automation adoption has increased by approximately 5–7% annually, correlating with higher soft starter integration in factories.
Soft Starter Market Restraints:
-
High Initial Investment Costs Pose Challenges to Market Adoption Growth
Despite the benefits, the high initial cost of soft starters remains a significant restraint. The initial investment cost for small and medium-sized enterprises to buy and set up the soft starter can be a significant amount, particularly when considering medium to high voltage units. Moreover, installation and integration with existing motor systems may require hired expertise, further adding to labor expenses. It can delay market penetration, especially in more price-sensitive markets and regions with lower levels of industrial automation adoption like parts of the Latin America and Middle East & Africa.
Soft Starter Market Opportunities:
-
IoT-Enabled Smart Soft Starters Offer Exciting Growth Opportunities Globally
One of the prominent growth opportunity among soft starter manufacturers is upsurge in adoption of IoT-enabled soft starters. Today, soft starters talk to smart monitoring systems embedded in other bits and pieces of equipment or predictive maintenance software, making it easy to track how a motor performs, how much energy it uses, or to diagnose faults in real-time. This approach not only enhances operational efficiency but also helps avoid maintenance and reduction in its down time. As industries embrace digitalization and automation, the growing importance of soft starters in advanced manufacturing, and smart factories, and renewable energy projects, characterized a significant segment for soft starters.
Smart soft starters allow real-time tracking of 90% of motor operational parameters, enabling proactive maintenance.
Soft Starter Market Segmentation Analysis:
-
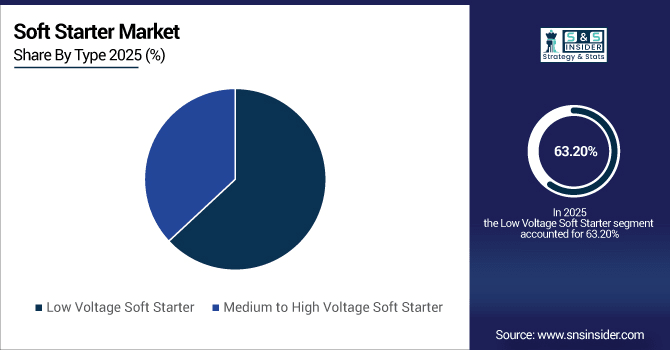
By Type: In 2025, Low Voltage Soft Starter led the market with largest share 63.20%, while Medium to High Voltage Soft Starter is the fastest-growing segment with a CAGR 7.24%.
-
By Market Phase: In 2025, Three Phase led the market with largest share 70.24%, while Single Phase is the fastest-growing segment with a CAGR 6.50%.
-
By Application: In 2025, Pumps led the market with largest share 48.60%, while is Compressors the fastest-growing segment with a CAGR 7.30%.
-
By End Use Industry: In 2025, Oil and Gas led the market with largest share 37.67%, while Mining and Metal is the fastest-growing segment with a CAGR 7.04%.
By Type, Low Voltage Soft Starter Leads Market and Medium to High Voltage Soft Starter Fastest Growth
The Low Voltage Soft Starter segment is currently a market leader in the Soft Starter Market, capturing a majority of the share owing to its wide application in most small- to medium-sized industrial motors, along with a low price for normal operation. In industries where reliable motor control for pumps, fans, and compressors is a must, these starters are favored for a smoother startup and mechanical stress reduction. Conversely, Medium to High Voltage Soft Starter segment is expected to grow at the fastest rate in the projection period. The growth is fueled by rising demand for heavy industries like mining, oil & gas, and energy, which are all spaces where big motors need high-capacity, efficient motors starters. The growth trend is also driven by technological advancements and industrial automation.
By Market Phase, Three Phase Leads Market and Single Phase Fastest Growth
In the Soft Starter Market, the Three Phase segment dominates the Soft Starter Market, accounting for the largest market share due to its wide application in industrial and commercial motor applications that require greater efficiency, reliability, and power handling capabilities. Heavy operations for three-phase soft starters, such as pumps, compressors, and another big fan, are primarily using it due to the need for a smooth start-up without the mechanical stress these machines typically put through. Meanwhile, the Single Phase segment is expected to witness the fastest growth during the forecast period. The rising focus on energy-efficient motor control solutions with higher performance in a smaller footprint along with increasing adoption for residential & small commercial applications along with growing demand for energy efficient devices from various emerging markets are some factors that tends to drive the electric motor market place. This rapid expansion is also being enabled by technological advancements and ease of integration.
By Application, Pumps Leads Market and Compressors Fastest Growth
In the Soft Starter Market, the Pumps segment holds the largest share of the Soft Starter Market in terms of value and volume, primarily due to the large usage of pump applications across industries such as water treatment, oil & gas, chemical industry, etc. Pumps Soft Starters Low and Medium Voltages Pumps require reliable motor control with a soft start to operate smoothly, minimize mechanical stresses, and operate at maximum efficiency all of which can be achieved by using low and medium voltage soft starters. On the other hand, the Compressors segment is estimated to be growing at the highest CAGR during the forecast period. This growth is driven by increased adoption in HVAC systems, refrigeration, and industrial air compression applications, where energy-efficient motor control and diminished downtime are becoming increasingly critical. Integration of technology along with automation is another factor that contributes to the growth of this segment.
End Use Industry, Oil and Gas Leads Market while Mining and Metal Fastest Growth
The Oil and gas segment holds the largest share of the Soft Starter Market, mainly due to the extensive use of soft starters for most large-scale pumping, compression, and drilling operations. These starters are critical in providing operational efficiency in a harsh and demanding environment by reducing the mechanical stress and inrush current, thus assuring a non-interruption in production. On the flip side, Mining and Metal segment is projected to grow at the highest rate through the forecast period. Factors such as rising industrialization, expansion of mining activities, and demand for energy-efficient motor control solutions to drive heavy-duty equipment and machinery are responsible to create this growth. This trend of fast adoption is further supported by technological advancements and the automation integration.
Soft Starter Market Regional Analysis:
North America Soft Starter Market Insights:
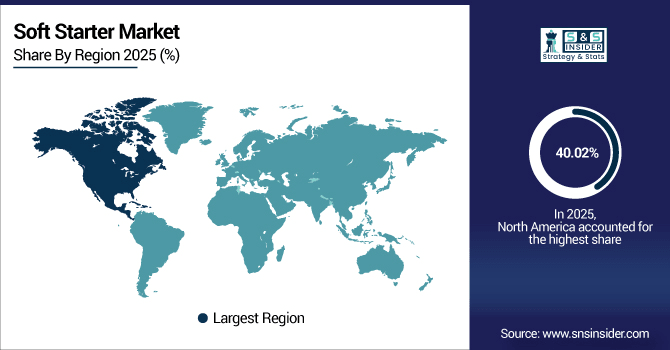
The Soft Starter Market in North America held the largest share 40.02% in 2025, driven by advanced due to its prominent industrial infrastructure, adoption of automation, and increasing government regulations for the energy-efficient policies by the government. Soft starters play a major role in the region’s manufacturing, oil & gas and energy sectors and help in reducing mechanical load and inrush current which improves the life of the motors. For instance, growing investments towards the edge of industrial upgrades and towards smart factories will create a potential market opportunity. For instance, companies, such as Siemens AG, Schneider Electric SE, ABB Ltd., and Rockwell Automation Inc. are actively expanding their presence and introducing innovative low and medium voltage soft starters. Continuous technological advancements and the focus on sustainable operations ensure sustained market growth in North America over the forecast period.
Get Customized Report as Per Your Business Requirement - Enquiry Now
U.S. Dominates Soft Starter Market with Advanced Technological Adoption
The U.S. leads the Soft Starter Market due to widespread automation, energy-efficient motor control adoption, industrial upgrades, and innovative solutions by key companies driving sustainable growth and operational efficiency.
Asia-Pacific Soft Starter Market Insights
In 2025, Asia-Pacific is the fastest-growing region in the Soft Starter Market, projected to expand at a CAGR of 6.57%, due to the high development rate of industrialization and urbanization and infrastructure development in countries like China, India, and Japan. There is a growing demand for energy-efficient motor control solutions in manufacturing, mining, oil & gas, and water treatment industries which is driving the market growth. Moreover, rising automation along with smart factory projects is bolstering the growth of low and medium voltage soft starters market. Sustainable energy usage to industrial modernisation supported by government policies further drives the growth. Top global and regional companies are expanding their presence, launching new products, and entering into technology partnerships to take advantage of the significant growth opportunity in the region.
China and India Propel Rapid Growth in Soft Starter Market
Rapid industrialization, urbanization, and adoption of energy-efficient motor control solutions in China and India drive significant Soft Starter Market growth across manufacturing, mining, and infrastructure sectors.
Europe Soft Starter Market Insights
Europe holds a significant position in the Soft Starter Market, driven by mature industrial infrastructure, advanced practices of manufacturing crossing the implications of stringent energy-efficiency regulations. The increasing need to minimize the energy consumption and operational expenditure in automotive, food & beverage, and energy & power sectors is encouraging the installation of soft starters in the region. Soft starters for three-phase and low voltage are commonly used in most applications to provide a smoother start, reduce mechanical stress and extend the lifespan of the motor. Europe remains steady in terms of market share and is anticipated to register a steady growth during the forecast period owing to constant introduction of innovative solution by leading players such as Siemens AG, Schneider Electric SE, and ABB Ltd., which are also actively pursuing expansion of the area of presence and continuously capitalizing on smart monitoring technologies.
Germany and U.K. Lead Soft Starter Market Expansion Across Europe
Strong industrial base, advanced manufacturing practices, and high adoption of energy-efficient motor control solutions in Germany and the U.K. drive significant Soft Starter Market growth, supporting automation and sustainable operations across key European industries.
Latin America (LATAM) and Middle East & Africa (MEA) Soft Starter Market Insights
The Soft Starter Market in Latin America and Middle East & Africa is witnessing steady growth, driven by increasing industrialization, urban infrastructure development, and rising adoption of energy-efficient motor control solutions. In LATAM, countries such as Brazil and Mexico are investing in manufacturing, mining, and water treatment projects, boosting demand for low and medium voltage soft starters. Similarly, MEA markets, led by Saudi Arabia, UAE, and South Africa, are focusing on industrial modernization, renewable energy projects, and automation initiatives. Despite challenges like limited technical expertise and price sensitivity, regional growth is supported by strategic investments, technological adoption, and expansion by key global and regional companies.
Soft Starter Market Competitive Landscape
Schneider Electric SE focuses on advanced soft starter solutions under its Altivar series, offering reliable motor protection, energy efficiency, and reduced downtime. Its products cater to industrial automation, mining, and water treatment sectors. Continuous innovation and digital integration with IoT monitoring enhance operational efficiency and support sustainable industrial growth globally.
-
In June 2025, Schneider Electric SE launched the new generation Altivar Soft Starter ATS430 and ATS490 ranges in Anglophone Africa to enhance motor control and reduce downtime.
CG Power and Industrial Solutions Ltd. offers a range of soft starters focused on motor protection and lifespan enhancement. Their solutions reduce electrical stress, optimize energy usage, and improve industrial process efficiency. Widely adopted in energy, mining, and manufacturing sectors, CG Power continues to expand through technological upgrades and industrial automation initiatives.
-
In July 2025, CG Power and Industrial Solutions Ltd. introduced a soft starter series focused on reducing electrical stress and improving motor longevity across industries.
Rockwell Automation Inc. provides smart soft starters, including the M100 series, designed for space-efficient, cost-effective motor control. Their solutions ensure smooth startups, minimize mechanical stress, and enable predictive maintenance. With strong adoption in manufacturing and industrial sectors, Rockwell drives efficiency improvements, automation, and digital transformation in motor management applications worldwide.
-
In March 2025, Rockwell Automation Inc. unveiled the M100 Electronic Motor Starter, offering space-efficient, cost-effective solutions for intelligent motor control and improved operational performance.
Soft Starter Market Key Players:
Some of the Soft Starter Market Companies are:
-
Siemens AG
-
Schneider Electric SE
-
Eaton Corporation PLC
-
Rockwell Automation Inc.
-
ABB Ltd.
-
Danfoss Group
-
Fairford Electronics Inc.
-
Toshiba International Corporation
-
CG Power and Industrial Solutions Ltd.
-
IGEL Electric GmbH
-
AuCom Electronics Ltd.
-
WEG S.A.
-
Fuji Electric Co., Ltd.
-
Mitsubishi Electric Corporation
-
Carlo Gavazzi Holding AG
-
Larsen & Toubro Limited
-
SOLCON Industries Ltd.
-
Phasetronics Inc.
-
Lovato Electric S.p.A.
-
Benshaw Inc.
| Report Attributes | Details |
|---|---|
| Market Size in 2025 | USD 2.30 Billion |
| Market Size by 2033 | USD 3.53 Billion |
| CAGR | CAGR of 5.53% From 2026 to 2033 |
| Base Year | 2025 |
| Forecast Period | 2026-2033 |
| Historical Data | 2022-2024 |
| Report Scope & Coverage | Market Size, Segments Analysis, Competitive Landscape, Regional Analysis, DROC & SWOT Analysis, Forecast Outlook |
| Key Segments | •By Type (Low Voltage Soft Starter, Medium to High Voltage Soft Starter) •By Market Phase (Single Phase, Three Phase) •By Application (Pumps, Fans and Blowers, Compressors) •By End-use Industry (Mining and Metal, Food and Beverage, Energy and Power, Oil and Gas, Others) |
| Regional Analysis/Coverage | North America (US, Canada), Europe (Germany, UK, France, Italy, Spain, Russia, Poland, Rest of Europe), Asia Pacific (China, India, Japan, South Korea, Australia, ASEAN Countries, Rest of Asia Pacific), Middle East & Africa (UAE, Saudi Arabia, Qatar, South Africa, Rest of Middle East & Africa), Latin America (Brazil, Argentina, Mexico, Colombia, Rest of Latin America). |
| Company Profiles | Siemens AG, Schneider Electric SE, Eaton Corporation PLC, Rockwell Automation Inc., ABB Ltd., Danfoss Group, Fairford Electronics Inc. , Toshiba International Corporation, CG Power and Industrial Solutions Ltd., IGEL Electric GmbH, AuCom Electronics Ltd. , WEG S.A., Fuji Electric Co., Ltd., Mitsubishi Electric Corporation, Carlo Gavazzi Holding AG, Larsen & Toubro Limited, SOLCON Industries Ltd., Phasetronics Inc., Lovato Electric S.p.A., Benshaw Inc., and Others. |
Frequently Asked Questions
North America dominated the Soft Starter Market in 2025.
The Low Voltage Soft Starter segment dominated the Soft Starter Market.
The major growth factor of the Soft Starter Market is the increasing demand for energy-efficient motor control solutions across industries.
The Soft Starter Market size was USD 2.30 billion in 2025 and is expected to reach USD 3.53 billion by 2033.
The Soft Starter Market is expected to grow at a CAGR of 5.53% during 2026-2033.
Get in Touch
