Somatostatin Analogs Market Report Scope & Overview:
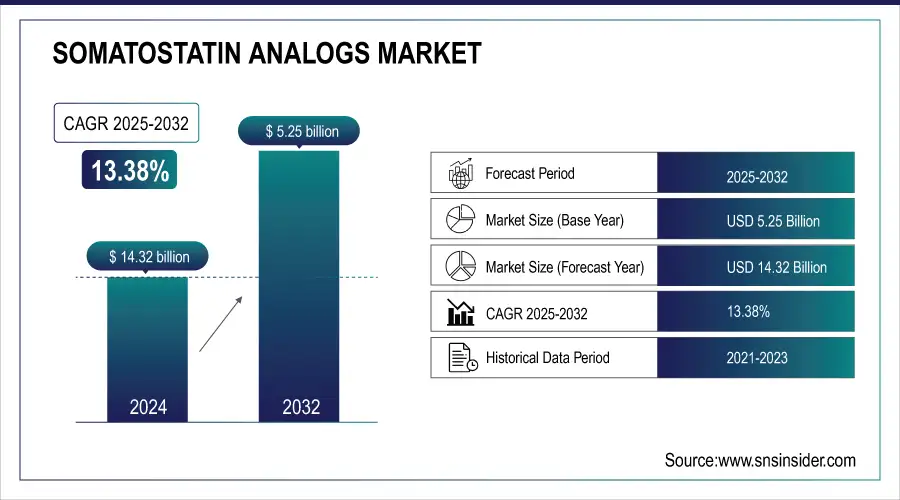
The Somatostatin Analogs Market size was valued at USD 5.25 billion in 2024 and is expected to reach USD 14.32 billion by 2032, growing at a CAGR of 13.38% over 2025-2032.
The global somatostatin analogs market is growing due to the increasing incidence of acromegaly, neuroendocrine tumors (NETs), and Cushing’s disease. In the past decade, there has been a 5–to 10-fold increase in somatostatin analogs requested due to higher diagnosis rates and new imaging techniques, and better knowledge of the disease. Moreover, the somatostatin analogs market growth is attributed to the increasing healthcare infrastructure, especially in emerging markets, and the growing number of specialty care centers.
To Get more information on Somatostatin Analogs Market - Request Free Sample Report
Somatostatin Analogs Market Size and Forecast:
-
Market Size in 2024: USD 5.25 billion
-
Market Size by 2032: USD 14.32 billion
-
CAGR: 13.38% from 2025 to 2032
-
Base Year: 2024
-
Forecast Period: 2025–2032
-
Historical Data: 2021–2023
In March 2025, Ipsen announced positive results from an extended Asian clinical trial, as part of the company’s expansion strategy in the U.S. somatostatin analogs and Asian territories.
Investment in pharmaceutical R&D has massively increased, but after development by all major pharmaceutical companies, long-term clinical trials for newer analogs, including those by Novartis and Ipsen, are underway to improve analog performance. Global R&D investment in endocrine and oncology-based medicine has grown at double-digit rates each year. Regulatory authorities such as the U.S. FDA and EMA have developed expedited approval programs for orphan drugs against rare endocrine disorders, leading to faster market access. With the growing penetration of extended-release formulations and patient-friendly delivery mechanisms, somatostatin analogs industry trends are experiencing diversification in adherence to treatment and patient outcomes. There is a growing focus on biosimilars by companies in their bid to reduce treatment costs, which, in turn, will propel the demand for somatostatin analogs globally.
In May 2024, Novartis started a Phase III study with an oral somatostatin analog, evidence of the trend toward non-injection treatments.
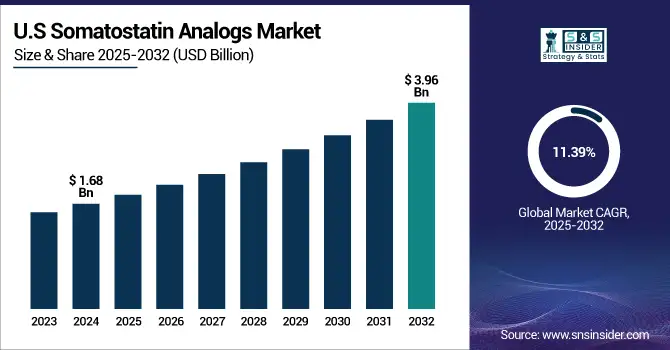
The U.S. somatostatin analogs market size was valued at USD 1.68 billion in 2024 and is expected to reach USD 3.96 billion by 2032, growing at a CAGR of 11.39% over 2025-2032.
Somatostatin Analogs Market Trends:
-
Increasing prevalence of neuroendocrine tumors (NETs) and acromegaly is significantly driving the demand for somatostatin analog therapies for effective disease management.
-
Growing adoption of long-acting formulations such as depot injections is improving patient compliance and treatment outcomes in chronic conditions.
-
Advancements in targeted therapies and peptide-based drug development are enhancing the efficacy and specificity of somatostatin analogs.
-
Rising awareness and early diagnosis of hormonal disorders are contributing to higher treatment rates and market expansion globally.
-
Expansion of healthcare infrastructure and improved access to specialty care in emerging markets are supporting market growth.
-
Strategic collaborations and product innovations by pharmaceutical companies are accelerating the development of next-generation somatostatin analog drugs.
-
Increasing focus on personalized medicine and combination therapies is improving clinical outcomes and expanding therapeutic applications.
Market Dynamics:
Drivers:
-
Rising Therapeutic Demand And R&D Investments Are Propelling Somatostatin Analogs Market Growth
The somatostatin analogs market growth is largely influenced by the increasing prevalence of neuroendocrine tumors (NETs), carcinoid syndrome, and acromegaly. Approximately 12,000 new cases of NETs are diagnosed each year in the United States, creating a demand for better, longer-acting analogs.
Moreover, key players are increasing R&D spend, with companies such as Crinetics Pharmaceuticals investing over USD 100 million in 2023 in oral somatostatin analogs. The somatostatin analogs market is experiencing strong growth, driven by advancements in drug reformulation and the rising adoption of personalized medicine. There are also regulatory nods: the FDA cleared Camurus for its octreotide SC depot for long-term acromegaly in 2024. Furthermore, at the pipeline level, pipeline expansion and patent expiry of branded products are being replaced by biosimilars, augmenting reach and, in turn, increasing the somatostatin analogs market growth. With an expanding elderly population and improved endocrine diagnostics, global demand continues to increase, particularly as injectable and oral routes of administration multiply.
Restraints:
-
Regulatory Complexity, Cost Burden, And Drug Shortages Are Impeding Somatostatin Analogs Market Growth
Although the potential is promising for the somatostatin analogs market, there are a few restraints that hinder its growth. A major challenge is the costs of somatostatin analog treatment, which can exceed USD 75,000 per patient annually for long-acting formulations, making it inaccessible, particularly in low- and middle-income countries. Furthermore, shortages of supply, including supply chain discrepancies and raw material shortages, such as those experienced during the global peptide supply crisis of 2022, persist, making it difficult to access drugs. It is also a significant bottleneck in terms of regulation.
While orphan status will fast-track some approvals, the difficult pharmacokinetics of analogues often mean that a long duration of safety and efficacy data-gathering will delay commercialisation. Additionally, the somatostatin analogs market analysis suggests non-uniform reimbursement systems in the countries, which also result in variability of patient coverage.
In 2023, Europe claimed access delays of 6–12 months for initiation of treatment and organization of effective health technology assessments. There is also increasing competition from newer targeted therapies, such as peptide receptor radionuclide therapy (PRRT), and new classes of somatostatin analogs. These challenges also constitute entry and expansion barriers, limiting somatostatin analogs market trends in some sections.
Segmentation Analysis:
By Type
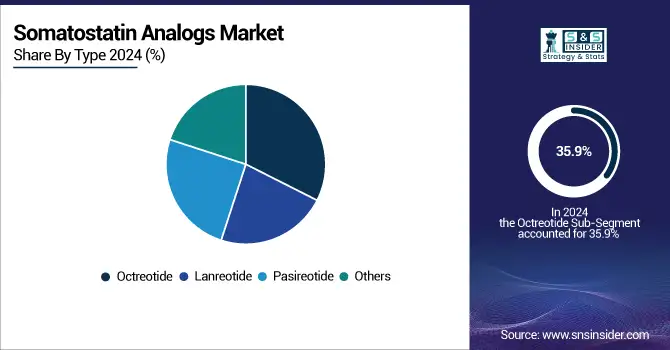
Octreotide led the market for somatostatin analogs in 2024 and contributed to 35.9% of the revenue share. Its approval for the treatment of acromegaly, neuroendocrine tumors (NETs), and the carcinoid syndrome, and the existence of long-acting forms (e.g., Sandostatin LAR) have also played a role in making it a leader. With its proven efficacy, good safety profile, and global availability, it is regarded as the treatment of choice as the first-line therapy. Meanwhile, Pasireotide is becoming the fastest-growing somatostatin analog (SSA) due to its greater receptor-binding affinity and its potential for treating resistant forms of Cushing’s disease and acromegaly. Its combined activity on various somatostatin receptor subtypes is leading to an increased use, including in patients refractory to other therapies.
By Application
The NET (Neuroendocrine tumors) segment dominated the global somatostatin analogs market in 2024, receiving maximum revenue share on account of growing GI (gastrointestinal) and pancreatic NETs (neuroendocrine tumors) detection that are primarily treated with somatostatin analogs. This need is also reinforced by increasing awareness, screening programs, and the efficiency of analogs in the control of symptoms and tumor stabilization. The acromegaly segment is expected to grow at a booming rate due to enhanced diagnostic methods, patient knowledge, and increasing indications of extended-acting somatostatin analogs, including lanreotide, pasireotide, for the treatment of growth hormone-producing tumors.
By End Use
Hospitals were the leading end-use in the somatostatin analogs market in 2024 due to the high number of patient admissions and the presence of advanced treatment infrastructure that provides multidisciplinary care for complex endocrine disorders. They also facilitate infusion-based therapies and post-treatment monitoring, vital for the delivery of somatostatin analog therapy. However, clinics are projected to grow with the highest CAGR in the coming years due to the rising demand for the decentralization of healthcare facilities, easy access in urban and semi-urban areas, and rising penetration of injectable therapies for outpatient use.
Regional Analysis:
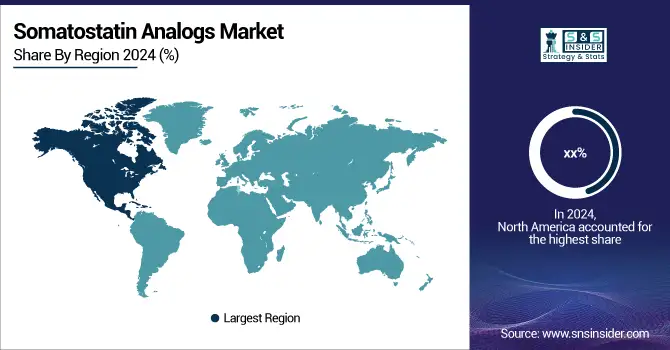
North America accounted for the largest share of the somatostatin analogs market in 2024, primarily due to high awareness and increasing adoption of therapeutic products, lower healthcare expenses, and the presence of a large patient population base for NETs and acromegaly. The U.S accounts for a major share in the region due to high R&D investments, high prevalence of advanced therapies, and the presence of key companies such as Novartis and Crinetics Pharmaceuticals in the region. More than 75% of NET diagnoses in North America are treated with somatostatin analogs, which explains why the region prevails. Canada is seeing greater clinical trials and government-sponsored drug coverage, and Mexico is opening up access to specialty drugs with healthcare reforms. The U.S. is also a hotbed for regulatory innovation in the form of orphan drug designations and breakthrough therapy status granted by the FDA to novel analogs, which helped improve accessibility to medications and boosted the somatostatin analogs market estimates.
Get Customized Report as per Your Business Requirement - Enquiry Now
The second largest somatostatin analogs market share in 2024 was attributed to Europe on the basis of the increasing number of patients with NETs and favorable reimbursement policies in several countries. In 2024, Germany was the largest market of somatostatin analogs in Europe, owing to its sophisticated clinical research infrastructure, early adoption of biosimilars, and increasing incidence of endocrine tumors. Long-acting analogues are now increasingly available as injectables across the national health services in the UK and France. The most rapidly rising country in Europe was Poland, where broader diagnosis initiatives and a bigger supply of drugs under public health systems have both contributed to the increase. European regulatory harmonization and active clinical trials throughout Italy and Spain also aid in regional expansion.
The somatostatin analogs market in the Asia Pacific region is projected to grow at the highest CAGR during the forecast period, driven by increasing population, rising cancer prevalence, improved healthcare infrastructure, and a growing proportion of the population with government insurance in the region. Japan is the largest market in the region due to higher spending on healthcare and early induction of somatostatin analogues for treating NET. Japan’s PMDA has been accelerating approvals of advanced therapies, including lanreotide, which has fed into market opportunities. China is emerging southwest with an increasing NET awareness, and several important analogues have been added to the public insurance list. India, on the other hand, is developing as a result of increasing detection of disorders of hormonal systems and the growth of private specialty clinics (poor affordability is an issue, however). There are also local investments in peptide production and in biosimilar development made in the region, further lifting the somatostatin analogs industry in Asia Pacific.
Key Players:
Leading somatostatin analogs companies in the market comprise Novo Nordisk A/S, Pfizer Inc., Eli Lilly and Company, Medical Device Business Services, Inc., Johnson & Johnson Services, Inc., Stryker Corporation, Ultragenyx Pharmaceutical Inc., Alexion Pharmaceuticals, Inc., Sun Pharmaceutical Industries Ltd., and Ipsen Biopharmaceuticals.
Recent Developments:
-
In Jan 2024, the FDA accepted the abbreviated new drug application (ANDA) submitted by POINT Biopharma Global Inc. for 177Lu-PNT2003, a radiolabeled somatostatin analog targeting SSTR-positive gastroenteropancreatic neuroendocrine tumors (GEP-NETs), highlighting regulatory progress in targeted NET therapies.
-
In June 2023, the FDA approved Pfizer Inc.’s Ngenla, a once-weekly, long-acting treatment for pediatric growth hormone deficiency, marking a significant step forward in endocrine care with improved dosing convenience.
| Report Attributes | Details |
|---|---|
| Market Size in 2024 | USD 5.25 billion |
| Market Size by 2032 | USD 14.32 billion |
| CAGR | CAGR of 13.38% From 2025 to 2032 |
| Base Year | 2024 |
| Forecast Period | 2025-2032 |
| Historical Data | 2021-2023 |
| Report Scope & Coverage | Market Size, Segments Analysis, Competitive Landscape, Regional Analysis, DROC & SWOT Analysis, Forecast Outlook |
| Key Segments | • By Type (Octreotide, Lanreotide, Pasireotide, and Others) • By Application (Acromegaly, NET, and Others) • By End Use (Hospitals, Clinics, and Others) |
| Regional Analysis/Coverage | North America (US, Canada, Mexico), Europe (Germany, France, UK, Italy, Spain, Poland, Turkey, Rest of Europe), Asia Pacific (China, India, Japan, South Korea, Singapore, Australia, Rest of Asia Pacific), Middle East & Africa (UAE, Saudi Arabia, Qatar, South Africa, Rest of Middle East & Africa), Latin America (Brazil, Argentina, Rest of Latin America) |
| Company Profiles | Novo Nordisk A/S, Pfizer Inc., Eli Lilly and Company, Medical Device Business Services, Inc., Johnson & Johnson Services, Inc., Stryker Corporation, Ultragenyx Pharmaceutical Inc., Alexion Pharmaceuticals, Inc., Sun Pharmaceutical Industries Ltd., and Ipsen Biopharmaceuticals. |
Frequently Asked Questions
Ans: Key future somatostatin analogs market trends include the development of oral formulations, increased use of depot and sustained-release injections, and growing integration with companion diagnostics for targeted therapy.
Ans: North America, led by the U.S., dominates the global supply due to its advanced healthcare infrastructure, high diagnosis rates, and regulatory efficiency. Europe follows closely, with Germany, France, and the UK being major contributors. Asia Pacific, particularly Japan and China, is rapidly emerging as a manufacturing and demand hub, driven by expanding healthcare access and increasing NET incidence.
Ans: Key players in the global somatostatin analogs market include Novo Nordisk A/S, Pfizer Inc., Eli Lilly and Company, Ipsen Biopharmaceuticals, Crinetics Pharmaceuticals, Chiasma Inc., Sun Pharmaceutical Industries Ltd., and Camurus AB.
Ans: The growth of the somatostatin analogs market is primarily driven by the rising prevalence of neuroendocrine tumors (NETs), acromegaly, and Cushing’s disease, alongside increasing awareness and improved diagnostic capabilities.
Ans: The somatostatin analogs market size was valued at USD 5.25 billion in 2024 and is expected to reach USD 14.32 billion by 2032, growing at a CAGR of 13.38% over 2025-2032.
Get in Touch
