Steam and Hydrogen Peroxide Biological Indicators Market Size Analysis:
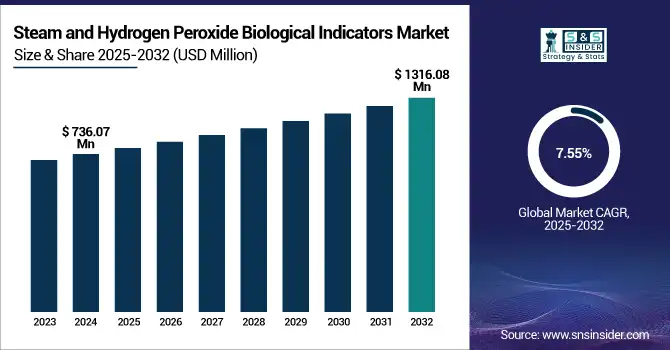
The Steam and Hydrogen Peroxide Biological Indicators Market size was valued at USD 736.07 million in 2024 and is expected to reach USD 1316.08 million by 2032, growing at a CAGR of 7.55% over the forecast period of 2025-2032.
The steam and hydrogen peroxide biological indicators market is seeing tremendous growth due to stringent regulatory compliance and rising infection control and sterilization requirements worldwide.
To Get more information on Steam and Hydrogen Peroxide Biological Indicators Market - Request Free Sample Report
In fact, according to the U.S. Centers for Disease Control and Prevention (CDC), 1 in 31 hospitalized patients has at least 1 healthcare-associated infection (HAI) every year and almost 99,000 people in the U.S. die from HAIs, highlighting the importance of sterilization monitoring tools such as biological indicators for sterilization in healthcare facilities.
The stringent sterilization validation indicators requirements imposed by ISO 11138 and the U.S. Food and Drug Administration (FDA) have peaked the adoption rate of steam sterilization indicators and hydrogen peroxide sterilization indicators among hospitals and pharmaceutical manufacturing.
The U.S. Steam and Hydrogen Peroxide Biological Indicators Market was valued at USD 226.29 million in 2024 and its expected to reach USD 400.79 million by 2032 growing with a CAGR of 7.42% over the forecast period of 2024-2032, it accounted for the largest share reflecting the country’s leadership in infection control and sterilization best practices.
The steam and hydrogen peroxide biological indicators market growth is benefiting from government-funded initiatives towards reducing HAIs and improving the best practices for sterilization in healthcare institutes. Using direct, consistent measures of sterilization performance through biological indicator incubation times and spore viability tests, the worldwide steam and hydrogen peroxide biological indicators market plays a key role in infection control and sterilizing assurance goods. Essential in verifying steam sterilization and low-temperature sterilization techniques, including vaporized hydrogen peroxide sterilization, extensively utilized in the healthcare and pharmaceutical sectors, these biological indicators for sterilization help to validate these processes.
Steam and Hydrogen Peroxide Biological Indicators Market Dynamics
Drivers
-
Increase in Healthcare-Associated Infections and Rise in Sterilization Monitoring Drive Demand for Biological Indicators
Despite advances in medical technology, healthcare-associated infections (HAIs) continue to be a major problem to overcome; Steam and hydrogen peroxide biological indicators are reliable choices to perform sterilization validations. Despite significant declines in the rates of multiple infection types-including a 15% reduction in central line-associated bloodstream infections (CLABSIs) and 16% in methicillin-resistant Staphylococcus aureus (MRSA)-nearly 1 in 31 hospital patients still has at least 1 HAI on any given day, a statistic levied by the Centers for Disease Control and Prevention (CDC) in its 2023 National and State HAI Progress Report. Such a constant infection threat drives the need for careful sterilization monitoring in healthcare facilities to guarantee patient safety and adhere to regulations.
Biological indicators are the gold standard for all sterilization process verification tests, but on the other hand, few sterilizers, such as steam and hydrogen peroxide sterilizers, may not be able to destroy all the microbial contaminants. The increased adoption of these indicators, particularly in hospitals and outpatient settings, is attributable to the continued push for infection control, which has only been further accelerated by the pandemic. There are strict exposure limits for hydrogen peroxide being sterilized by regulatory bodies such as OSHA. These factors, individually and collectively, promote utilization, eyeing a growth trend for the market as they emphasize the need for biological indicators to save health care outcomes and reduce HAIs.
Restraints
High upfront costs and infrastructure hurdles to the adoption of sophisticated biological markers in resource-limited settings
Steam and hydrogen peroxide biological indicators may be expensive due to infrastructure needs, which hamper their adoption, especially in developing parts of the world. These indicators require significant capital investment, including the purchase of sterilizers, biological indicator kits, and staff training, which is also included in an advanced sterilization system with these indicators. However, in many low-and middle income countries, tight budgets mean these technologies remain difficult to implement or upgrade even when they are proven to be effective. Recent steam and hydrogen peroxide biological indicators market analysis suggests that around 20% of global medical institutions may still have a lack of access to hydrogen peroxide vapor sterilization due to economic and additional infrastructural obstacles.
Moreover, the development of standardized protocols and regulatory harmonization is still in its early stages, and implementation and validation of the guidelines are often complicated and infeasible across regions. The financial and operational burden of using biological indicators hinders their market penetration in economically constrained areas, despite an increasing awareness of their critical role in infection prevention and control, consequently restricting the global penetration of biological indicators. Addressing these challenges will require new financing models and scalable system designs that can improve access to effective sterilization monitoring.
Steam and Hydrogen Peroxide Biological Indicators Market Segmentation Analysis
By Product Type
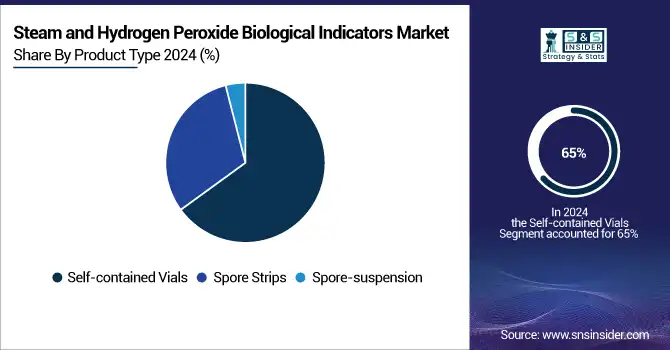
The self-contained vials segment held the largest 2024 steam and hydrogen peroxide biological indicators market share at approximately 65% of the revenue, with significant CAGR growth. Thanks to the closed design of the vial that minimizes the risk of contamination and premature activation, this segment has been leading in sterilization monitoring reliability. Moreover, healthcare industries and pharmaceutical manufacturing continue to have the use of self-contained biological indicators for sterilization, a requirement that regulatory authorities such as the FDA and the CDC have further emphasized over the past decade, therefore contributing to the flourishing of this segment. For instance, the FDA's new guidelines on the validation of sterilization will be released in 2024 and suggest that steam sterilization processes utilize self-contained vials for the biological indicator format, due to their superior sterility assurance and the convenience of incubation.
Recent technological developments include rapid readout biological indicators within this segment that deliver results in as little as 5 to 20 minutes, accelerating sterilization cycles and improving hospital workflows. One such innovation is the Superfast 20 Biological Indicators launched by Getinge in 2020, which complies with ISO 11138 and is applicable on steam and hydrogen peroxide sterilizers and helps towards quicker release of sterile instruments releasing and minimizing the risk of HAIs. These tools for rapid sterilization monitoring are increasingly being adopted, partly because they are supported by government infection control programs that recognize their role in reducing opportunities for cross-contamination and in increasing patient safety.
By Application
The healthcare facilities segment held the major share of the global steam and hydrogen peroxide biological indicators market in 2024, owing to awareness regarding hospital-acquired infection (HAI) prevention and the rise in a number of surgical procedures across the globe. According to the CDC, there is a serious impact of HAIs on 1 in 31 patients admitted to hospitals in the U.S. For this reason, hospitals now focus on implementing advanced sterilization validation indicators, including biological indicator for sterilization just one of them, as regulatory compliance and risk of infections reduces. The adoption of sterilization monitoring tools, which include steam sterilization indicators and hydrogen peroxide sterilization indicators, is being accelerated by initiatives taken by the government to fund policies for improving healthcare sterilization best practices in hospitals and outpatient surgical centers.
Notably, as demand for safe sterilization assurance products increases due to an impending healthcare crisis caused by growing volumes of surgical interventions (over 313 million annually worldwide), demand for reliable sterilization assurance products to maintain patient safety while remaining compliant with industry regulations continues to grow. To improve operational efficiency by shortening the incubation time of biological indicators, the rapid-readout biological indicators are being increasingly utilized by healthcare facilities to reduce the overall time needed for the sterilization cycle. These sterilization validation indicators (benefit indicators) are promoted by government agencies to be integrated with electronic monitoring systems for higher traceability and lower human error (manufacturing error) blunders for a particular sterilization process.
The segment of pharmaceutical and medical device companies is expected to witness significant growth during the forecast years, owing to the strict regulations by the FDA and the standards by ISO 11138 that lay down the strictest sterility validation requirements. Considerable growth in sterile injectable drugs, vaccines, and implantable implants. The need for biological indicators for sterility assurance of such items is to ensure product safety and regulatory requirements. Recent steam and hydrogen peroxide biological indicators market trends have indicated that there are stricter inspections and audits from the government observing facilities that manufacture pharmaceutical products, forcing industries to utilize superior sterilization employee tools (such as rapid readout biological indicators) to prevent high-cost recalls and stay viable in the market.
Regional Insights
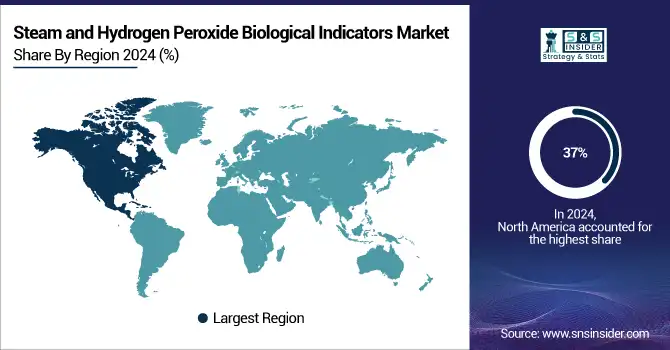
The steam and hydrogen peroxide biological indicators market share is mainly dominated by North America, with around 37% market share. The U.S. dominates this due to advanced healthcare infrastructure, compliance with U.S. FDA and ISO 11138 regulations, and huge government investments in infection control and sterilization monitoring tools. The increasing cases of surgical site infections and the rising need for maintaining healthcare sterilization best practices. The region further owes itself to the continuous innovation by biological indicator manufacturers and the rapid adoption of rapid readout biological indicators and sterilization assurance products by hospitals and pharmaceutical companies.
The region commands a significant share of the global market due to an effective regulatory framework from the European Medicines Agency (EMA) along with an efficient healthcare system in place. In Europe, national policies promote infection control and sterilization validation indicators to limit hospital-acquired infections (HAIs). Growth in the pharmaceutical and medical device industries across the region has also been instrumental in the progress of hydrogen peroxide sterilization indicators and steam sterilization indicators.
The Asia-Pacific (APAC) region is expected to record the highest CAGR through the forecast period, largely owing to the rapid development of healthcare infrastructure and the pharmaceutical industry in emerging states such as China, India, Japan, and South Korea. The increasing incidence of HAIs, preparedness to invest in effective infection control and sterilization methods, and scaling pharmaceutical manufacturing capabilities are the primary factors supporting the steam and hydrogen peroxide biological indicators market growth in APAC. Nations such as China and India are heavily investing in their healthcare infrastructure and regulatory frameworks, with increasing adoption of steam and hydrogen peroxide sterilization indicator products. In addition, the government initiatives to enhance the quality and safety of healthcare delivery in the Asian region act as a benefactor to the growth of the APAC market of sterilization monitoring tools, rapid readout biological indicators.
Emerging economy regions such as Latin America, the Middle East, and Africa (LAMEA) continue to witness steady growth owing to improving healthcare infrastructure coupled with the rising level of attention towards preventing souring infection. While their market share in comparison to North America, Europe, and the APAC regions is smaller, the higher penetration of government-supported infection prevention programs, coupled with the WHO initiatives, has spurred the adoption of biological indicators in sterilization applications. This is due to the gradual reinforcement of regulatory compliance frameworks in these regions, and as a result, it will stimulate the demand for steam and hydrogen peroxide biological indicators in the healthcare & pharmaceutical sectors.
Get Customized Report as per Your Business Requirement - Enquiry Now
Key Players
The key Steam and Hydrogen Peroxide Biological Indicators Companies are Steris Corporation, Bioquell Limited (Ecolab Solution), Etigam, Terragene S. A., Getinge AB (Carl Bennet AB), GKE Australia, Liofilchem S.r.l., Mesa Laboratories Inc., 3M Company, Tuttnauer, and others.
Recent Developments:
-
The U.S. Department of Health and Human Services (HHS) announced new financing in January 2025 to upgrade infection control systems in healthcare facilities, therefore supporting enhanced biological indicators for sterilization validation to lower HAIs.
-
In June 2022, 3M received marketing approval for its Attest Rapid Readout Biological Indicator 1295, designed for routine monitoring of vaporized hydrogen peroxide sterilization.
| Report Attributes | Details |
|---|---|
| Market Size in 2024 | USD 736.07 Million |
| Market Size by 2032 | USD 1316.08 Million |
| CAGR | CAGR of 7.55% From 2025 to 2032 |
| Base Year | 2024 |
| Forecast Period | 2025-2032 |
| Historical Data | 2021-2023 |
| Report Scope & Coverage | Market Size, Segments Analysis, Competitive Landscape, Regional Analysis, DROC & SWOT Analysis, Forecast Outlook |
| Key Segments | • By Product Type (Spore Strips, Self-contained Vials, and Spore-suspension) • By Application (Healthcare Facilities, Pharmaceutical & Medical Device Companies, and Others) |
| Regional Analysis/Coverage | North America (US, Canada, Mexico), Europe (Germany, France, UK, Italy, Spain, Poland, Turkey, Rest of Europe), Asia Pacific (China, India, Japan, South Korea, Singapore, Australia, Rest of Asia Pacific), Middle East & Africa (UAE, Saudi Arabia, Qatar, South Africa, Rest of Middle East & Africa), Latin America (Brazil, Argentina, Rest of Latin America) |
| Company Profiles | Steris Corporation, Bioquell Limited (Ecolab Solution), Etigam, Terragene S. A., Getinge AB (Carl Bennet AB), GKE Australia, Liofilchem S.r.l., Mesa Laboratories Inc., 3M Company, Tuttnauer, and others |
Frequently Asked Questions
Ans: The Self-contained Vials segment dominated the Steam and Hydrogen Peroxide Biological Indicators Market.
Ans: High upfront costs and infrastructure hurdles to the adoption of sophisticated biological markers in resource-limited settings
Ans. The CAGR of the Steam and Hydrogen Peroxide Biological Indicators Market is 7.55% during the forecast period of 2025-2032.
Ans: The North America region dominated the Steam and Hydrogen Peroxide Biological Indicators Market in 2024.
Ans. The projected market size for the Steam and Hydrogen Peroxide Biological Indicators Market is USD 1316.08 million by 2032.
Get in Touch
