Get More Information on Steam Trap Market - Request Sample Report
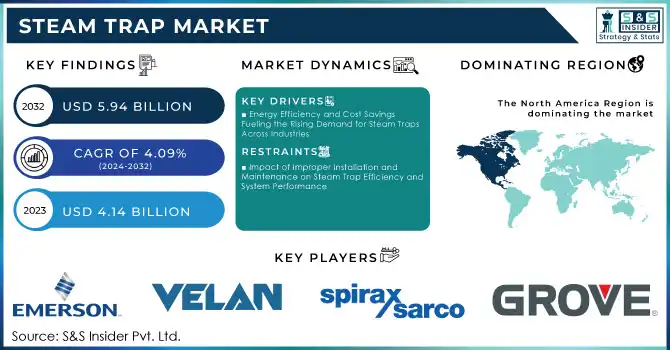
The Steam Trap Market size was valued at USD 3.75 billion in 2022 and is expected to grow to USD 5.038 billion by 2030 and grow at a CAGR of 3.76% over the forecast period of 2023-2030.
Due to its effectiveness in removing condensate and non-condensable gases from steam distribution lines, which ensures that only dry steam travels to designated processes or machines, the process industry segment held a significant commercial share in 2022 and is anticipated to achieve 6.4% increase through 2030. Industries that care about the environment concentrate on the effective distribution of dry steam to improve system performance and reduce energy losses. Steam traps are essential in such situations for removing condensate and pollutants from steam, ensuring that the steam utilized in various processes maintains the required purity & quality standards, and by 2030, will experience growth. About 60% of the steam trap market share in 2022 was dominated by the steam distribution industry. Many different industries and applications that require proper steam distribution & management use steam distribution traps on a regular basis. Steam traps for condensate recovery are typically used in processes like steam heating systems, industrial processes, and power plants that produce large amounts of condensate. Each type's utilization is dependent on system design, energy-Condensate load, efficiency objectives, and particular application requirements. by 2030, consequently influencing market development.
Report Attributes | Details |
---|---|
Key Segments | • By Product (Mechanical, Thermodynamics, Thermostatic) • By Body Material (Steel, Iron, Others) • By Application (Tracing Application, Drip Application, Process Application) • By End-User Industry (Chemicals, Energy & Power, Food & Beverages, Oil & Gas, Pharmaceuticals, Others) |
Regional Coverage | North America (US, Canada, Mexico), Europe (Eastern Europe [Poland, Romania, Hungary, Turkey, Rest of Eastern Europe] Western Europe] Germany, France, UK, Italy, Spain, Netherlands, Switzerland, Austria, Rest of Western Europe]), Asia Pacific (China, India, Japan, South Korea, Vietnam, Singapore, Australia, Rest of Asia Pacific), Middle East & Africa (Middle East [UAE, Egypt, Saudi Arabia, Qatar, Rest of Middle East], Africa [Nigeria, South Africa, Rest of Africa], Latin America (Brazil, Argentina, Colombia, Rest of Latin America) |
Company Profiles | Spirax-Sarco Engineering plc (UK), Emerson Electric Co. (US), Schlumberger Limited (US), Thermax Limited (India), Velan Inc. (Canada), Watts Water Technologies, Inc. (US), Armstrong International Inc. (US), TLV CO., LTD. (Japan), Forbes Marshall (India), and Xylem Inc. (US) |
Increased need for energy-efficient solutions
The market for steam traps is expanding due to the increased need for energy-efficient solutions across a variety of sectors. Steam traps are crucial for optimizing steam systems because they effectively remove condensate while minimizing steam leakage. As enterprises try to increase energy efficiency and reduce costs, the demand for steam traps is growing more and more significant. Due to stringent environmental sustainability and energy saving rules, the steam trap sector is expanding. Due to the increased attention being paid to process optimization and the goal to decrease carbon, businesses are investing in steam trap systems. The market for steam traps is growing thanks to footprints.
Decreased operational costs
RESTRAIN:
The growing use of alternative energy sources and technology
In an effort to reduce their carbon footprint and implement more sustainable practices, businesses and organizations are moving toward renewable energy and energy-efficient technology. Because steam traps are most commonly used in This action is a difficulty for the steam trap industry because it uses typical steam-based equipment. The steam trap industry could suffer if companies look into and invest in alternative heating and energy options. To remain competitive, steam trap manufacturers must vary their product offerings and adjust to the changing market conditions competitive.
High costs of installation
OPPORTUNITY:
The creation of steam traps using loT sensor technology
Market participants are actively creating battery-free loT systems integrated with steam traps to offer cost-effective solutions in various industrial settings. The University of Michigan and University of Virginia researchers are concentrating on creating the semiconductor design technology to address the battery issue with a variety of self-powered, maintenance-free sensing devices. The market participants are focusing on creating oT sensors.
CHALLENGES:
Increased focus on renewable energy sources turbines
Malfunctioning and decreased efficacy
There are three basic avenues through which impacts will move. One is that increased inflation due to increasing pricing for basic necessities like food and electricity will erode the purchasing power of incomes and reduce demand. Two, there will be a significant impact on adjacent economies due to the disruption of commerce, supply chains, and remittances as well as the unprecedented increase in refugee movements. The third factor is that lower investor confidence and lower corporate confidence will have an impact on asset values, tightening financial conditions and perhaps causing capital outflows from emerging markets. Major producers of commodities, Russia and Ukraine have seen their prices surge due to interruptions, particularly for natural gas and oil. Food prices have increased, with wheat prices reaching a record, with Ukraine and Russia accounting for 30% of global exports.
IMPACT OF ONGOING RECESSION
The prognosis for the steam trap market was impacted by pandemic-related limitations on the movement of people and commodities as well as facility and border closures, which caused delays in manufacture and distribution and a shortage of the product in the industry. The quarantine regulations and reduced product necessity caused a slowing and temporary halt of operations in a number of industries, including production, oil & gas, and chemicals. Because of the slowdown in commercial activity and the delay of steam trap installations, the market for the product also declined. The majority of manufacturing facilities focused on crucial processes and cost-cutting measures while suspending or limiting repair activities like steam trap audits and replacements, which reduced the need for new steam trap installations and aftermarket services. However, the decrease in COVID-19 cases and subsequent government legislation Nongovernmental organizations (NGOs).
By Product
Mechanical
Thermodynamics
Thermostatic
By Body Material
Steel
Iron
Others
By Application
Tracing Application
Drip Application
Process Application
By End-User Industry
Chemicals
Energy & Power
Food & Beverages
Oil & Gas
Pharmaceuticals
Others
Get Customized Report as Per Your Business Requirement - Request For Customized Report
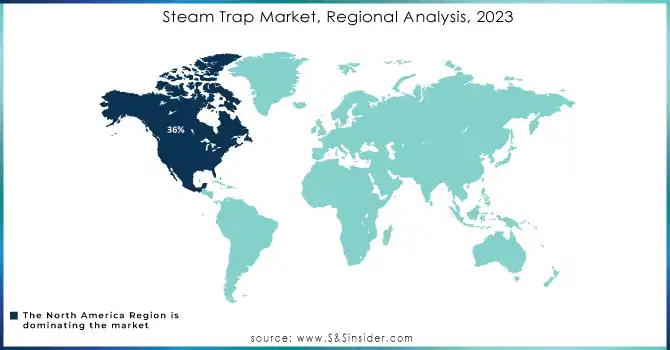
With a significant revenue of USD 1.4 billion in 2022, the U.S. dominated North America, and between 2023 and 2030, it is expected to increase rapidly. Energy conservation and sustainability are given priority in North America. The adoption of numerous laws and regulations by the government to save energy and reduce greenhouse gas emissions would increase demand for power effective tools like steam traps. The market for steam traps will be supported by the prosperous industrial environment in North America, which includes the manufacturing, oil and gas, chemical processing, food and beverage sectors. The region's renovation and retrofitting of ancient buildings for energy conservation is another element driving the popularity of the product. These factors will enhance the steam trap by 2030, the growth of the North American market.
REGIONAL COVERAGE:
North America
US
Canada
Mexico
Europe
Eastern Europe
Poland
Romania
Hungary
Turkey
Rest of Eastern Europe
Western Europe
Germany
France
UK
Italy
Spain
Netherlands
Switzerland
Austria
Rest of Western Europe
Asia Pacific
China
India
Japan
South Korea
Vietnam
Singapore
Australia
Rest of Asia Pacific
Middle East & Africa
Middle East
UAE
Egypt
Saudi Arabia
Qatar
Rest of Middle East
Africa
Nigeria
South Africa
Rest of Africa
Latin America
Brazil
Argentina
Colombia
Rest of Latin America
Some of Key players in the steam trap market are Spirax-Sarco Engineering plc (UK), Emerson Electric Co. (US), Schlumberger Limited (US), Thermax Limited (India), Velan Inc. (Canada), Watts Water Technologies, Inc. (US), Armstrong International Inc. (US), TLV CO., LTD. (Japan), Forbes Marshall (India), and Xylem Inc. (US) and other players are listed in a final report.
Emerson Electric Co. (US)-Company Financial Analysis
In September 2022, steam technology expert TLV CO., LTD. unveiled the F32 line of free-float steam traps. These steam traps are made for use in vulcanizers, heat exchangers, jacketed pans, and other process equipment. These steam traps have a QuickTrap connection, a universal feature that makes removal, maintenance, and reuse quick, easy, and effective.
For US$18 million in January 2022, Spirax-Sarco Engineering plc purchased Cotopaxi Limited (UK), an expert in digital energy optimization. This action supports Spirax-Sarco's Steam Specialties division, which specializes in effective steam solutions. The digital know-how of Cotopaxi will increase waste reduction and steam system efficiency, taking use of Steam Specialties' global sales network in 67 countries.
Report Attributes | Details |
Market Size in 2022 | US$ 3.75 billion |
Market Size by 2030 | US$ 5.038 billion |
CAGR | CAGR of 3.76% From 2023 to 2030 |
Base Year | 2022 |
Forecast Period | 2023-2030 |
Historical Data | 2019-2021 |
Report Scope & Coverage | Market Size, Segments Analysis, Competitive Landscape, Regional Analysis, DROC & SWOT Analysis, Forecast Outlook |
Key Drivers | • Increased need for energy-efficient solutions • Decreased operational costs |
Market Restrains | •High costs of installation |
The growing use of alternative energy sources and technology and High costs of installation.
Increased need for energy-efficient solutions and decreased operational costs.
North America is dominating the Steam Trap Market.
Steam Trap Market size was valued at 3.75 billion in 2022
Steam Trap Market is anticipated to expand by 3.76% from 2023 to 2030.
TABLE OF CONTENT
1. Introduction
1.1 Market Definition
1.2 Scope
1.3 Research Assumptions
2. Research Methodology
3. Market Dynamics
3.1 Drivers
3.2 Restraints
3.3 Opportunities
3.4 Challenges
4. Impact Analysis
4.1 Impact of the Ukraine- Russia war
4.2 Impact of ongoing Recession
4.2.1 Introduction
4.2.2 Impact on major economies
4.2.2.1 US
4.2.2.2 Canada
4.2.2.3 Germany
4.2.2.4 France
4.2.2.5 United Kingdom
4.2.2.6 China
4.2.2.7 Japan
4.2.2.8 South Korea
4.2.2.9 Rest of the World
5. Value Chain Analysis
6. Porter’s 5 forces model
7. PEST Analysis
8. Steam Trap Market Segmentation, By Product
8.1 Mechanical
8.2 Thermodynamics
8.3 Thermostatic
9. Steam Trap Market Segmentation, By Body Material
9.1 Steel
9.2 Iron
9.3 Others
10. Steam Trap Market Segmentation, By Application
10.1 Drip Application
10.2 Process Application
10.3 Tracing Application
11. Steam Trap Market Segmentation, By End-User Industry
11.1 Chemicals
11.2 Energy & Power
11.3 Food & Beverages
11.4 Oil & Gas
11.5 Pharmaceuticals
11.6 Others
12. Regional Analysis
12.1 Introduction
12.2 North America
12.2.1 North America Steam Trap Market by Country
12.2.2North America Steam Trap Market by Product
12.2.3 North America Steam Trap Market by Body Material
12.2.4 North America Steam Trap Market by Application
12.2.5 North America Steam Trap Market by End-User Industry
12.2.6 USA
12.2.6.1 USA Steam Trap Market by Product
12.2.6.2 USA Steam Trap Market by Body Material
12.2.6.3 USA Steam Trap Market by Application
12.2.6.4 USA Steam Trap Market by End-User Industry
12.2.7 Canada
12.2.7.1 Canada Steam Trap Market by Product
12.2.7.2 Canada Steam Trap Market by Body Material
12.2.7.3 Canada Steam Trap Market by Application
12.2.7.4 Canada Steam Trap Market by End-User Industry
12.2.8 Mexico
12.2.8.1 Mexico Steam Trap Market by Product
12.2.8.2 Mexico Steam Trap Market by Body Material
12.2.8.3 Mexico Steam Trap Market by Application
12.2.8.4 Mexico Steam Trap Market by End-User Industry
12.3 Europe
12.3.1 Eastern Europe
12.3.1.1 Eastern Europe Steam Trap Market by Country
12.3.1.2 Eastern Europe Steam Trap Market by Product
12.3.1.3 Eastern Europe Steam Trap Market by Body Material
12.3.1.4 Eastern Europe Steam Trap Market by Application
12.3.1.5 Eastern Europe Steam Trap Market by End-User Industry
12.3.1.6 Poland
12.3.1.6.1 Poland Steam Trap Market by Product
12.3.1.6.2 Poland Steam Trap Market by Body Material
12.3.1.6.3 Poland Steam Trap Market by Application
12.3.1.6.4 Poland Steam Trap Market by End-User Industry
12.3.1.7 Romania
12.3.1.7.1 Romania Steam Trap Market by Product
12.3.1.7.2 Romania Steam Trap Market by Body Material
12.3.1.7.3 Romania Steam Trap Market by Application
12.3.1.7.4 Romania Steam Trap Market by End-User Industry
12.3.1.8 Hungary
12.3.1.8.1 Hungary Steam Trap Market by Product
12.3.1.8.2 Hungary Steam Trap Market by Body Material
12.3.1.8.3 Hungary Steam Trap Market by Application
12.3.1.8.4 Hungary Steam Trap Market by End-User Industry
12.3.1.9 Turkey
12.3.1.9.1 Turkey Steam Trap Market by Product
12.3.1.9.2 Turkey Steam Trap Market by Body Material
12.3.1.9.3 Turkey Steam Trap Market by Application
12.3.1.9.4 Turkey Steam Trap Market by End-User Industry
12.3.1.10 Rest of Eastern Europe
12.3.1.10.1 Rest of Eastern Europe Steam Trap Market by Product
12.3.1.10.2 Rest of Eastern Europe Steam Trap Market by Body Material
12.3.1.10.3 Rest of Eastern Europe Steam Trap Market by Application
12.3.1.10.4 Rest of Eastern Europe Steam Trap Market by End-User Industry
12.3.2 Western Europe
12.3.2.1 Western Europe Steam Trap Market by Country
12.3.2.2 Western Europe Steam Trap Market by Product
12.3.2.3 Western Europe Steam Trap Market by Body Material
12.3.2.4 Western Europe Steam Trap Market by Application
12.3.2.5 Western Europe Steam Trap Market by End-User Industry
12.3.2.6 Germany
12.3.2.6.1 Germany Steam Trap Market by Product
12.3.2.6.2 Germany Steam Trap Market by Body Material
12.3.2.6.3 Germany Steam Trap Market by Application
12.3.2.6.4 Germany Steam Trap Market by End-User Industry
12.3.2.7 France
12.3.2.7.1 France Steam Trap Market by Product
12.3.2.7.2 France Steam Trap Market by Body Material
12.3.2.7.3 France Steam Trap Market by Application
12.3.2.7.4 France Steam Trap Market by End-User Industry
12.3.2.8 UK
12.3.2.8.1 UK Steam Trap Market by Product
12.3.2.8.2 UK Steam Trap Market by Body Material
12.3.2.8.3 UK Steam Trap Market by Application
12.3.2.8.4 UK Steam Trap Market by End-User Industry
12.3.2.9 Italy
12.3.2.9.1 Italy Steam Trap Market by Product
12.3.2.9.2 Italy Steam Trap Market by Body Material
12.3.2.9.3 Italy Steam Trap Market by Application
12.3.2.9.4 Italy Steam Trap Market by End-User Industry
12.3.2.10 Spain
12.3.2.10.1 Spain Steam Trap Market by Product
12.3.2.10.2 Spain Steam Trap Market by Body Material
12.3.2.10.3 Spain Steam Trap Market by Application
12.3.2.10.4 Spain Steam Trap Market by End-User Industry
12.3.2.11 Netherlands
12.3.2.11.1 Netherlands Steam Trap Market by Product
12.3.2.11.2 Netherlands Steam Trap Market by Body Material
12.3.2.11.3 Netherlands Steam Trap Market by Application
12.3.2.11.4 Netherlands Steam Trap Market by End-User Industry
12.3.2.12 Switzerland
12.3.2.12.1 Switzerland Steam Trap Market by Product
12.3.2.12.2 Switzerland Steam Trap Market by Body Material
12.3.2.12.3 Switzerland Steam Trap Market by Application
12.3.2.12.4 Switzerland Steam Trap Market by End-User Industry
12.3.2.13 Austria
12.3.2.13.1 Austria Steam Trap Market by Product
12.3.2.13.2 Austria Steam Trap Market by Body Material
12.3.2.13.3 Austria Steam Trap Market by Application
12.3.2.13.4 Austria Steam Trap Market by End-User Industry
12.3.2.14 Rest of Western Europe
12.3.2.14.1 Rest of Western Europe Steam Trap Market by Product
12.3.2.14.2 Rest of Western Europe Steam Trap Market by Body Material
12.3.2.14.3 Rest of Western Europe Steam Trap Market by Application
12.3.2.14.4 Rest of Western Europe Steam Trap Market by End-User Industry
12.4 Asia-Pacific
12.4.1 Asia Pacific Steam Trap Market by Country
12.4.2 Asia Pacific Steam Trap Market by Product
12.4.3 Asia Pacific Steam Trap Market by Body Material
12.4.4 Asia Pacific Steam Trap Market by Application
12.4.5 Asia Pacific Steam Trap Market by End-User Industry
12.4.6 China
12.4.6.1 China Steam Trap Market by Product
12.4.6.2 China Steam Trap Market by Body Material
12.4.6.3 China Steam Trap Market by Application
12.4.6.4 China Steam Trap Market by End-User Industry
12.4.7 India
12.4.7.1 India Steam Trap Market by Product
12.4.7.2 India Steam Trap Market by Body Material
12.4.7.3 India Steam Trap Market by Application
12.4.7.4 India Steam Trap Market by End-User Industry
12.4.8 Japan
12.4.8.1 Japan Steam Trap Market by Product
12.4.8.2 Japan Steam Trap Market by Body Material
12.4.8.3 Japan Steam Trap Market by Application
12.4.8.4 Japan Steam Trap Market by End-User Industry
12.4.9 South Korea
12.4.9.1 South Korea Steam Trap Market by Product
12.4.9.2 South Korea Steam Trap Market by Body Material
12.4.9.3 South Korea Steam Trap Market by Application
12.4.9.4 South Korea Steam Trap Market by End-User Industry
12.4.10 Vietnam
12.4.10.1 Vietnam Steam Trap Market by Product
12.4.10.2 Vietnam Steam Trap Market by Body Material
12.4.10.3 Vietnam Steam Trap Market by Application
12.4.10.4 Vietnam Steam Trap Market by End-User Industry
12.4.11 Singapore
12.4.11.1 Singapore Steam Trap Market by Product
12.4.11.2 Singapore Steam Trap Market by Body Material
12.4.11.3 Singapore Steam Trap Market by Application
12.4.11.4 Singapore Steam Trap Market by End-User Industry
12.4.12 Australia
12.4.12.1 Australia Steam Trap Market by Product
12.4.12.2 Australia Steam Trap Market by Body Material
12.4.12.3 Australia Steam Trap Market by Application
12.4.12.4 Australia Steam Trap Market by End-User Industry
12.4.13 Rest of Asia-Pacific
12.4.13.1 Rest of Asia-Pacific Steam Trap Market by Product
12.4.13.2 Rest of Asia-Pacific Steam Trap Market by Body Material
12.4.13.3 Rest of Asia-Pacific Steam Trap Market by Application
12.4.13.4 Rest of Asia-Pacific Steam Trap Market by End-User Industry
12.5 Middle East & Africa
12.5.1 Middle East
12.5.1.1 Middle East Steam Trap Market by Country
12.5.1.2 Middle East Steam Trap Market by Product
12.5.1.3 Middle East Steam Trap Market by Body Material
12.5.1.4 Middle East Steam Trap Market by Application
12.5.1.5 Middle East Steam Trap Market by End-User Industry
12.5.1.6 UAE
12.5.1.6.1 UAE Steam Trap Market by Product
12.5.1.6.2 UAE Steam Trap Market by Body Material
12.5.1.6.3 UAE Steam Trap Market by Application
12.5.1.6.4 UAE Steam Trap Market by End-User Industry
12.5.1.7 Egypt
12.5.1.7.1 Egypt Steam Trap Market by Product
12.5.1.7.2 Egypt Steam Trap Market by Body Material
12.5.1.7.3 Egypt Steam Trap Market by Application
12.5.1.7.4 Egypt Steam Trap Market by End-User Industry
12.5.1.8 Saudi Arabia
12.5.1.8.1 Saudi Arabia Steam Trap Market by Product
12.5.1.8.2 Saudi Arabia Steam Trap Market by Body Material
12.5.1.8.3 Saudi Arabia Steam Trap Market by Application
12.5.1.8.4 Saudi Arabia Steam Trap Market by End-User Industry
12.5.1.9 Qatar
12.5.1.9.1 Qatar Steam Trap Market by Product
12.5.1.9.2 Qatar Steam Trap Market by Body Material
12.5.1.9.3 Qatar Steam Trap Market by Application
12.5.1.9.4 Qatar Steam Trap Market by End-User Industry
12.5.1.10 Rest of Middle East
12.5.1.10.1 Rest of Middle East Steam Trap Market by Product
12.5.1.10.2 Rest of Middle East Steam Trap Market by Body Material
12.5.1.10.3 Rest of Middle East Steam Trap Market by Application
12.5.1.10.4 Rest of Middle East Steam Trap Market by End-User Industry
12.5.2. Africa
12.5.2.1 Africa Steam Trap Market by Country
12.5.2.2 Africa Steam Trap Market by Product
12.5.2.3 Africa Steam Trap Market by Body Material
12.5.2.4 Africa Steam Trap Market by Application
12.5.2.5 Africa Steam Trap Market by End-User Industry
12.5.2.6 Nigeria
12.5.2.6.1 Nigeria Steam Trap Market by Product
12.5.2.6.2 Nigeria Steam Trap Market by Body Material
12.5.2.6.3 Nigeria Steam Trap Market by Application
12.5.2.6.4 Nigeria Steam Trap Market by End-User Industry
12.5.2.7 South Africa
12.5.2.7.1 South Africa Steam Trap Market by Product
12.5.2.7.2 South Africa Steam Trap Market by Body Material
12.5.2.7.3 South Africa Steam Trap Market by Application
12.5.2.7.4 South Africa Steam Trap Market by End-User Industry
12.5.2.8 Rest of Africa
12.5.2.8.1 Rest of Africa Steam Trap Market by Product
12.5.2.8.2 Rest of Africa Steam Trap Market by Body Material
12.5.2.8.3 Rest of Africa Steam Trap Market by Application
12.5.2.8.4 Rest of Africa Steam Trap Market by End-User Industry
12.6. Latin America
12.6.1 Latin America Steam Trap Market by Country
12.6.2 Latin America Steam Trap Market by Product
12.6.3 Latin America Steam Trap Market by Body Material
12.6.4 Latin America Steam Trap Market by Application
12.6.5 Latin America Steam Trap Market by End-User Industry
12.6.6 Brazil
12.6.6.1 Brazil Steam Trap Market by Product
12.6.6.2 Brazil Steam Trap Market by Body Material
12.6.6.3 Brazil Steam Trap Market by Application
12.6.6.4 Brazil Steam Trap Market by End-User Industry
12.6.7 Argentina
12.6.7.1 Argentina Steam Trap Market by Product
12.6.7.2 Argentina Steam Trap Market by Body Material
12.6.7.3 Argentina Steam Trap Market by Application
12.6.7.4 Argentina Steam Trap Market by End-User Industry
12.6.8 Colombia
12.6.8.1 Colombia Steam Trap Market by Product
12.6.8.2 Colombia Steam Trap Market by Body Material
12.6.8.3 Colombia Steam Trap Market by Application
12.6.8.4 Colombia Steam Trap Market by End-User Industry
12.6.9 Rest of Latin America
12.6.9.1 Rest of Latin America Steam Trap Market by Product
12.6.9.2 Rest of Latin America Steam Trap Market by Body Material
12.6.9.3 Rest of Latin America Steam Trap Market by Application
12.6.9.4 Rest of Latin America Steam Trap Market by End-User Industry
13 Company Profile
13.1 Spirax-Sarco Engineering plc (UK)
13.1.1 Company Overview
13.1.2 Financials
13.1.3 Products/ Services Offered
13.1.4 SWOT Analysis
13.1.5 The SNS View
13.2 Emerson Electric Co. (US)
13.2.1 Company Overview
13.2.2 Financials
13.2.3 Products/ Services Offered
13.2.4 SWOT Analysis
13.2.5 The SNS View
13.3 Schlumberger Limited (US)
13.3.1 Company Overview
13.3.2 Financials
13.3.3 Products/ Services Offered
13.3.4 SWOT Analysis
13.3.5 The SNS View
13.4 Thermax Limited (India)
13.4 Company Overview
13.4.2 Financials
13.4.3 Products/ Services Offered
13.4.4 SWOT Analysis
13.4.5 The SNS View
13.5 Velan Inc. (Canada)
13.5.1 Company Overview
13.5.2 Financials
13.5.3 Products/ Services Offered
13.5.4 SWOT Analysis
13.5.5 The SNS View
13.6 Watts Water Technologies, Inc. (US)
13.6.1 Company Overview
13.6.2 Financials
13.6.3 Products/ Services Offered
13.6.4 SWOT Analysis
13.6.5 The SNS View
13.7 Armstrong International Inc. (US)
13.7.1 Company Overview
13.7.2 Financials
13.7.3 Products/ Services Offered
13.7.4 SWOT Analysis
13.7.5 The SNS View
13.8 TLV CO., LTD. (Japan)
13.8.1 Company Overview
13.8.2 Financials
13.8.3 Products/ Services Offered
13.8.4 SWOT Analysis
13.8.5 The SNS View
13.9 Forbes Marshall (India)
13.9.1 Company Overview
13.9.2 Financials
13.9.3 Products/ Services Offered
13.9.4 SWOT Analysis
13.9.5 The SNS View
13.10 Xylem Inc. (US)
13.10.1 Company Overview
13.10.2 Financials
13.10.3 Products/ Services Offered
13.10.4 SWOT Analysis
13.10.5 The SNS View
14. Competitive Landscape
14.1 Competitive Bench marking
14.2 Market Share Analysis
14.3 Recent Developments
14.3.1 Industry News
14.3.2 Company News
14.3.3 Mergers & Acquisitions
15. USE Cases and Best Practices
16. Conclusion
An accurate research report requires proper strategizing as well as implementation. There are multiple factors involved in the completion of good and accurate research report and selecting the best methodology to compete the research is the toughest part. Since the research reports we provide play a crucial role in any company’s decision-making process, therefore we at SNS Insider always believe that we should choose the best method which gives us results closer to reality. This allows us to reach at a stage wherein we can provide our clients best and accurate investment to output ratio.
Each report that we prepare takes a timeframe of 350-400 business hours for production. Starting from the selection of titles through a couple of in-depth brain storming session to the final QC process before uploading our titles on our website we dedicate around 350 working hours. The titles are selected based on their current market cap and the foreseen CAGR and growth.
The 5 steps process:
Step 1: Secondary Research:
Secondary Research or Desk Research is as the name suggests is a research process wherein, we collect data through the readily available information. In this process we use various paid and unpaid databases which our team has access to and gather data through the same. This includes examining of listed companies’ annual reports, Journals, SEC filling etc. Apart from this our team has access to various associations across the globe across different industries. Lastly, we have exchange relationships with various university as well as individual libraries.
Step 2: Primary Research
When we talk about primary research, it is a type of study in which the researchers collect relevant data samples directly, rather than relying on previously collected data. This type of research is focused on gaining content specific facts that can be sued to solve specific problems. Since the collected data is fresh and first hand therefore it makes the study more accurate and genuine.
We at SNS Insider have divided Primary Research into 2 parts.
Part 1 wherein we interview the KOLs of major players as well as the upcoming ones across various geographic regions. This allows us to have their view over the market scenario and acts as an important tool to come closer to the accurate market numbers. As many as 45 paid and unpaid primary interviews are taken from both the demand and supply side of the industry to make sure we land at an accurate judgement and analysis of the market.
This step involves the triangulation of data wherein our team analyses the interview transcripts, online survey responses and observation of on filed participants. The below mentioned chart should give a better understanding of the part 1 of the primary interview.
Part 2: In this part of primary research the data collected via secondary research and the part 1 of the primary research is validated with the interviews from individual consultants and subject matter experts.
Consultants are those set of people who have at least 12 years of experience and expertise within the industry whereas Subject Matter Experts are those with at least 15 years of experience behind their back within the same space. The data with the help of two main processes i.e., FGDs (Focused Group Discussions) and IDs (Individual Discussions). This gives us a 3rd party nonbiased primary view of the market scenario making it a more dependable one while collation of the data pointers.
Step 3: Data Bank Validation
Once all the information is collected via primary and secondary sources, we run that information for data validation. At our intelligence centre our research heads track a lot of information related to the market which includes the quarterly reports, the daily stock prices, and other relevant information. Our data bank server gets updated every fortnight and that is how the information which we collected using our primary and secondary information is revalidated in real time.
Step 4: QA/QC Process
After all the data collection and validation our team does a final level of quality check and quality assurance to get rid of any unwanted or undesired mistakes. This might include but not limited to getting rid of the any typos, duplication of numbers or missing of any important information. The people involved in this process include technical content writers, research heads and graphics people. Once this process is completed the title gets uploader on our platform for our clients to read it.
Step 5: Final QC/QA Process:
This is the last process and comes when the client has ordered the study. In this process a final QA/QC is done before the study is emailed to the client. Since we believe in giving our clients a good experience of our research studies, therefore, to make sure that we do not lack at our end in any way humanly possible we do a final round of quality check and then dispatch the study to the client.
The SerDes Market Size was valued at USD 0.761 Billion in 2023, and expected to reach USD 2.44 Billion by 2032, and grow at a CAGR of 12.25% over the forecast period 2024-2032.
The Power Over Ethernet Devices Market Size was valued at USD 0.96 billion in 2023 and is expected to reach USD 2.79 billion by 2032 and grow at a CAGR of 12.6% over the forecast period 2024-2032.
The Gaming Hardware Market Size was valued at USD 36.2 Billion in 2023 and is expected to Reach USD 63.86 Billion by 2032, at 6.51% CAGR During 2024-2032
The RF front-end market size was valued at USD 21.40 billion in 2023 and is expected to grow to USD 69.10 billion by 2032 and grow at a CAGR of 13.91 % over the forecast period of 2024-2032.
The Power Electronics Market Size was valued at USD 42.20 billion in 2023 and will reach USD 71.90 billion by 2032 and grow at a CAGR of 6.1% by 2024-2032.
The Wireless Charging Market was valued at USD 5.3 billion in 2023 and is expected to reach USD 31.96 billion by 2032 and grow at a CAGR of 22.1% over the forecast period 2024-2032.
Hi! Click one of our member below to chat on Phone