Super Hi-Vision Market Report Scope & Overview:
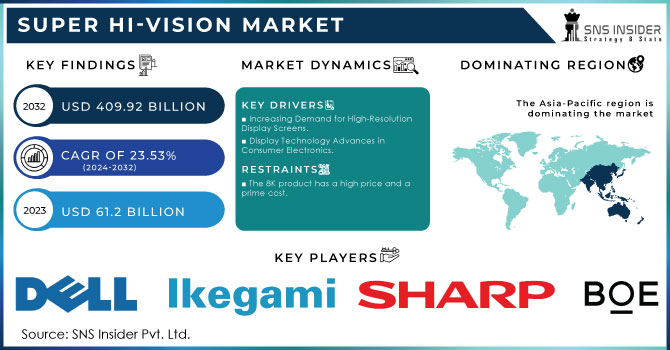
Super Hi-Vision Market was valued at USD 920 Million in 2023 and is expected to reach USD 4320 Million by 2032, growing at a CAGR of 18.89% from 2024-2032. This report includes Adoption Rate, Consumer Demand Trends, Investment & R&D Spending, Display Panel Production Capacity, and Regulatory & Standardization Data. The market is witnessing rapid expansion due to increasing adoption of 4K and 8K technologies across consumer and commercial applications. Rising demand for high-resolution content, advancements in display panels, and growing investments in R&D are accelerating growth. Additionally, regulatory bodies are establishing standards to streamline broadcasting and manufacturing, further shaping market evolution.
Get more information on Super Hi-Vision Market - Request Free Sample Report
Market Dynamics
Drivers
-
Rising Adoption of 8K Broadcasting, Streaming, and Immersive Media Experiences Driving Demand for High-Resolution Displays and Advanced Viewing Technologies.
The rapid adoption of 8K broadcasting and streaming services is revolutionizing the media sector due to growing consumer demand for higher visual clarity. Broadcasters and streaming services are committing to high-definition content creation, which gives users sharper and more detailed images. The gaming, sports, and entertainment sectors are also utilizing Super Hi-Vision technology to develop ultra-immersive environments and bring closer reality and interaction. The need for big-screen displays, sophisticated rendering technologies, and high-speed networks is increasing as consumers want seamless, high-fidelity experiences. As content ecosystems grow, the demand for innovative display solutions and high-bandwidth infrastructure will keep on speeding up, further solidifying the market's growth path.
Restraints
-
High Costs of 8K Displays, Cameras, and Broadcasting Equipment Slowing Adoption and Hindering Large-Scale Implementation Across Consumer and Professional Markets.
The widespread implementation of Super Hi-Vision technology faces significant challenges due to the high cost of 8K displays, cameras, and broadcasting infrastructure. Consumers and businesses hesitate to invest in premium 8K televisions, professional recording equipment, and advanced processing systems due to their steep pricing. Content producers and broadcasters are also reluctant to pay for the upgrade of production pipelines, thus making the large-scale production of 8K content less practical. Also, high-end applications that need high-resolution images, including gaming, healthcare, and digital marketing, are held back by the exorbitant costs of making the switch to 8K workflows. As long as affordability does not increase and economies of scale reduce prices, adoption will be sluggish, impacting overall market growth.
Opportunities
-
Rising Demand for Ultra-Realistic 8K Gaming, Virtual Reality, and Augmented Reality Experiences Accelerating Market Expansion
The video gaming world is moving fast, with 8K resolution testing the limits of visual realism and immersion. High-fidelity graphics, more detailed textures, and realistic rendering are being utilized by game makers to design more immersive experiences. Virtual reality and augmented reality solutions also enjoy Super Hi-Vision technology, offering clearer visuals and eliminating motion blur for uninterrupted interaction. With improved high-performance GPUs and next-generation gaming consoles as well as better display technologies, 8K-capable hardware and content will grow in demand. Cloud gaming, AI-optimized graphics upgrade, and metaverse use are the growing concerns, further establishing ultra-high-definition graphics as an indispensable driver of the future of gaming, and hence Super Hi-Vision technology stands as an absolute necessity.
Challenges
-
Massive Data Transfer Speeds and Storage Demands Creating Infrastructure Strain for 8K Content Adoption
Switching to 8K resolution calls for much more bandwidth and storage space, posing huge challenges to both consumers and content creators. Streaming of Super Hi-Vision content necessitates broadband internet connections and sophisticated compression algorithms to provide seamless playback without buffering. Furthermore, 8K video files are significantly larger in size than 4K ones, calling for enormous storage capacity and robust processing power for editing and dissemination. Existing cloud and on-site storage methods find it difficult to match the mounting loads of data, thereby placing added costs on the service providers. Without advances in network infrastructure, compression codes, and storage media that will manage ultra-high-resolution material, far-reaching utilization of Super Hi-Vision technology will continue to prove problematic.
Segment Analysis
By Type
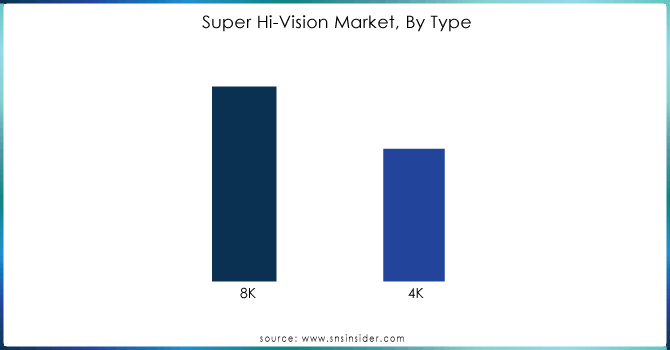
The 4K segment dominated the super hi-vision market with a 70% share of revenue in 2023, owing to its extensive adoption in televisions, gaming, streaming, and professional use. Low cost, high availability of content, and compatibility with legacy broadcasting and internet infrastructure helped its dominance. 4K resolution has been universally adopted by streaming platforms, gaming consoles, and digital signage and is now the industry norm. Also, reduced bandwidth and storage demands relative to 8K have fueled its uptake by consumers and businesses alike, cementing its leadership market share.
The 8K segment expected to experience the fastest growth at a 20.97% CAGR during 2024-2032, catalyzed by technology developments, rising investments in high-resolution content, and broadening applications across gaming, broadcasting, and medical imaging. As 8K TVs, cameras, and streaming services become cheaper, consumer demand is increasing. The gaming and virtual reality markets are also driving ultra-realistic video demand. Also, the adoption of 5G and fiber-optic high-speed networks will increase smooth 8K streaming, and hence it will be the most growing segment in the next few years.
By Applications
The consumer electronics segment dominated the super hi-vision market with a 62% revenue share in 2023 due to the common usage of 4K and 8K TVs, gaming consoles, and high-definition streaming devices. Growing demand from consumers for immersive entertainment content, along with the presence of affordable 4K TVs and advancing 8K technology, helped it be a market leader. Strong penetration of smart TVs, high-performance monitors, and next-generation gaming systems also added to this segment, making it the largest revenue-generating segment in the market.
The commercial electronics segment with the rapid growth at a 21.51% CAGR between 2024-2032, driven by the increasing use of 8K digital signage, high-resolution medical imaging, surveillance, and corporate display solutions. Companies are investing in huge-size 8K displays for advertising, exhibitions, and control rooms to increase visual interaction. Also, healthcare, education, and professional AV segments are adopting high-resolution displays for high-definition imaging and presentations. With increasing affordability, 8K technology demand from commercial use cases will push it to such high growth levels.
Get a Customized Report as per your Business Requirement - Request For Customized Report
By Technology
The led segment dominated the super hi-vision industry with a revenue share of 46% in 2023 on account of cost savings, excellent brightness, and extensive utilization across televisions, digital displays, and business displays. With LED technology benefiting from energy saving, longer operating time, and being affordable, it is widely chosen for the applications of 4K as well as 8K screens. Apart from this, innovation in Mini-LED and Micro-LED technology has improved picture quality, further consolidating its market leadership. The widespread availability of large-screen LED screens in a multitude of applications cemented its leadership.
The oled segment is expected to grow at the fastest CAGR of a 20.38% between 2024-2032, supported by better contrast, darker blacks, and greater color accuracy than LED. Rising use in high-end 8K TVs, gaming monitors, and professional displays is boosting demand. OLED's thinness and flexibility suit it perfectly for the curved and foldable screens, opening up new applications. Moreover, increasing investments in OLED production and the dwindling cost of production are making the technology more viable, and thus it is the fastest-growing segment in the industry.
Regional Analysis
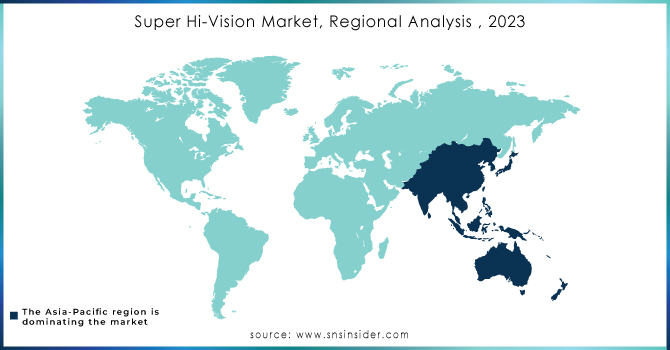
In 2023, Asia Pacific dominated the Super Hi-Vision Market with a 35% revenue share, driven by the region’s strong consumer electronics manufacturing base and rapid technological adoption. Countries like China, Japan, and South Korea are global leaders in 8K TV production, display technology, and semiconductor innovation, fueling widespread adoption. Additionally, high consumer demand for premium entertainment, government support for advanced broadcasting standards, and the presence of major industry players have solidified Asia Pacific’s leadership in the market.
North America is expected to grow at the fastest CAGR of 20.49% from 2024 to 2032, propelled by rising demand for high-resolution content, strong 5G infrastructure, and increasing investments in 8K gaming and streaming services. Leading technology companies and content creators are actively expanding 8K content production, while industries such as healthcare, advertising, and corporate AV solutions are rapidly adopting Super Hi-Vision displays. As consumer preferences shift towards ultra-high-definition experiences, North America’s market is set for accelerated expansion.
Key Players
-
Samsung Group (QN900A Neo QLED 8K TV, Galaxy S21 Ultra 8K video recording)
-
LG Electronics Inc. (ZX Series 8K OLED TV, NanoCell 99 Series 8K TV)
-
Dell Inc. (UltraSharp UP3218K Monitor, UltraSharp UP2720Q 4K Monitor)
-
Red Digital Cinema Camera Company (RANGER 8K Camera, KOMODO 6K Camera)
-
Sharp Corporation(AQUOS 8K TV, 8M-B80AX1E 8K Monitor)
-
JVC (DLA-NX9 8K Projector, GY-HC500 4K Camcorder)
-
BOE Japan Co. Ltd. (8K UHD Display Panels, 4K UHD Display Panels)
-
Panasonic Corporation (HZ2000 4K OLED TV, Lumix S1H 6K video recording)
-
Canon Inc. (EOS R5 8K video recording, EOS C300 Mark III 4K video recording)
-
Ikegami Tsushinki (SHK-810 8K Camera, UHK-430 4K Camera)
-
Apple (Pro Display XDR 6K, iPhone 12 Pro 4K Dolby Vision HDR recording)
-
Sony Corporation (Z9J MASTER Series 8K TV, Alpha 1 8K video recording)
-
Haier Group Corporation (LE65Q6500U 4K TV, LE75U6600U 4K TV)
-
Netflix Inc. ("Our Planet" 4K streaming, "The Crown" 4K streaming)
-
Koninklijke Philips N.V. (65OLED984 4K TV, 558M1RY 4K Monitor)
-
Seiko Epson Corporation (EH-LS500B 4K Projector, EH-TW9400 4K Projector)
-
TCL Electronics Holdings Limited (8-Series 4K QLED TV, 6-Series 4K QLED TV)
-
Skyworth Group Co. Ltd. (Q91 8K TV, S81 Pro 4K OLED TV)
-
AU Optronics Corporation (8K UHD Display Panels, 4K UHD Display Panels)
-
Innolux Corporation (8K UHD Display Panels, 4K UHD Display Panels)
-
Hisense Group Co. Ltd. (U9E 8K TV, H9G 4K TV)
-
British Broadcasting Corporation (BBC) ("Blue Planet II" 4K broadcast, "Dynasties" 4K broadcast)
-
Nikon Corporation (Z9 8K video recording, Z6 II 4K video recording)
-
Konka Group Co. Ltd. (828 Series 8K TV, 668 Series 4K TV)
-
Japan Broadcasting Corporation (NHK) (8K Broadcasting Service, 4K Broadcasting Service)
Recent Developments:
-
2025 – At CES 2025, Samsung introduced Samsung Vision AI, bringing AI-powered personalization to its latest Neo QLED, OLED, and The Frame models. The innovation aims to enhance everyday experiences by integrating advanced AI capabilities into display technology.
-
2024 – LG introduced its 2025 QNED evo lineup, incorporating true wireless 4K 144Hz transmission, AI-enhanced picture and sound processing, and hyper-personalized experiences through webOS 25. The new lineup enhances display performance with wider color gamut technology and improved AI-driven user interactions.
| Report Attributes | Details |
| Market Size in 2023 | USD 920 Million |
| Market Size by 2032 | USD 4320 Million |
| CAGR | CAGR of 18.89% From 2024 to 2032 |
| Base Year | 2023 |
| Forecast Period | 2024-2032 |
| Historical Data | 2020-2022 |
| Report Scope & Coverage | Market Size, Segments Analysis, Competitive Landscape, Regional Analysis, DROC & SWOT Analysis, Forecast Outlook |
| Key Segments | • By Type (4K, 8K) • By Application (Consumer Electronics, Commercial Electronics, Medical Science, Others) • By Technology (LED, OLED, LCD) |
| Regional Analysis/Coverage | North America (US, Canada, Mexico), Europe (Eastern Europe [Poland, Romania, Hungary, Turkey, Rest of Eastern Europe] Western Europe] Germany, France, UK, Italy, Spain, Netherlands, Switzerland, Austria, Rest of Western Europe]), Asia Pacific (China, India, Japan, South Korea, Vietnam, Singapore, Australia, Rest of Asia Pacific), Middle East & Africa (Middle East [UAE, Egypt, Saudi Arabia, Qatar, Rest of Middle East], Africa [Nigeria, South Africa, Rest of Africa], Latin America (Brazil, Argentina, Colombia, Rest of Latin America) |
| Company Profiles | Samsung Group, LG Electronics Inc., Dell Inc., Red Digital Cinema Camera Company, Sharp Corporation, JVC, BOE Japan Co. Ltd., Panasonic Corporation, Canon Inc., Ikegami Tsushinki Co. Ltd., Apple, Sony Corporation, Haier Group Corporation, Netflix Inc., Koninklijke Philips N.V., Seiko Epson Corporation, TCL Electronics Holdings Limited, Skyworth Group Co. Ltd., AU Optronics Corporation, Innolux Corporation, Hisense Group Co. Ltd., British Broadcasting Corporation (BBC), Nikon Corporation, Konka Group Co. Ltd., Japan Broadcasting Corporation (NHK) |
Get in Touch
