Sustainable Apparel Market Report Scope & Overview:
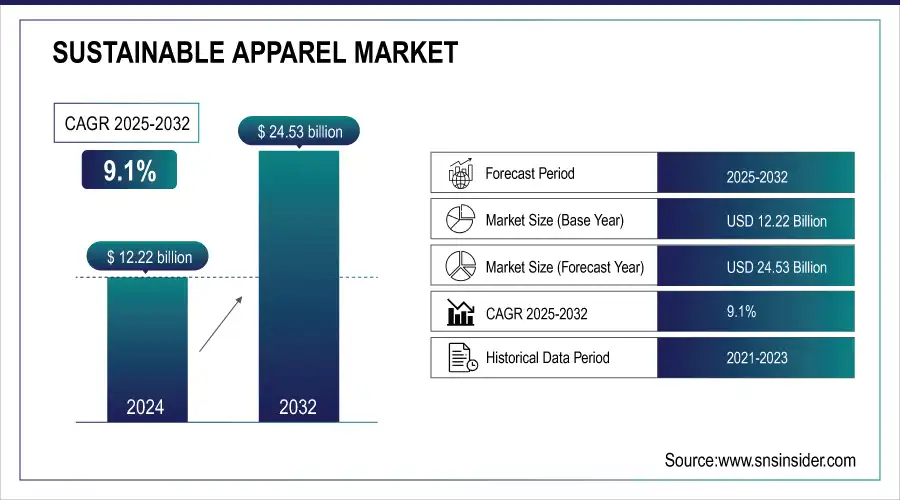
The Sustainable Apparel Market Size was valued at USD 12.22 billion in 2024 and is expected to reach USD 24.53 billion by 2032, and grow at a CAGR of 9.1% over the forecast period 2025-2032.
The sustainable apparel market has been on the rise globally, as consumers, businesses, and governments alike are now equally aware of the environmental impacts of the fashion industry. A major cause that contributes toward gaining momentum in the market is slow fashion, wherein quality over quantity is created to provide longevity, reducing the ecological footprint. This trend is followed by countries like India, which has emerged as one of the top ten global markets for slow fashion. According to a study cited by Apparel Resources, Indian consumers are culturally, economically, and environmentally inclined toward sustainable choices. This has translated into high demand for eco-friendly materials, ethical manufacturing practices, and supply chain transparency, pushing the market further towards sustainability.
Get More Information on Sustainable Apparel Market - Request Sample Report
Additionally, among the major factors contributing to reshaping the nature of the Sustainable Apparel Market is the emergence of the circular economy. The World Economic Forum discusses how the second-hand clothes industry is turning into a key part of such a circular economy, with resale platforms and recycling programs giving old garments new life. As sustainability experts explain, cloth recycling involves sorting of discarded garments, breaking them down into fibers, and reprocessing these into new textiles. The process not only reduces waste but also diminishes demand for virgin materials, significantly shrinking the carbon footprint of apparel production. However, the efficiency of recycling clothes depends on such factors as the type of materials their making includes and the level of technology available in a country to permit their reprocessing. Consumers are advised to donate or resell their unwanted clothes to participate in such initiatives and help contribute toward a more sustainable fashion ecosystem.
Sustainable Apparel Market Highlights:
-
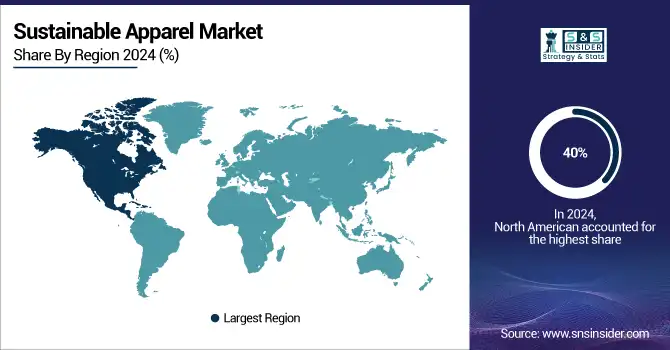
North America leads the market with about 40 percent share in 2024 driven by consumer demand for sustainable fashion, online retail growth, and government support for eco-friendly initiatives
-
Rising consumer awareness across all regions is pushing demand for apparel made from organic or recycled materials, encouraging brands to adopt transparent and ethical production practices
-
Government regulations and industry standards such as the EU Green Deal, extended producer responsibility, and certifications like Fair Trade are driving brands toward sustainable sourcing, waste reduction, and ethical labor practices
-
High costs of sustainable materials and production methods limit affordability and wider adoption of eco-friendly apparel, keeping it a niche market in certain segments
-
Opportunities in circular fashion initiatives like Levi Strauss’ Buy Better, Wear Longer program and Stella McCartney’s regenerative collections are creating demand for recyclable, repairable, and circular fashion models
-
Innovation in materials and processes including biodegradable fabrics and waterless dyeing technologies is reducing the environmental impact of apparel production
-
Global expansion potential is high in regions such as Asia-Pacific and Australia due to government incentives, growing consumer awareness, and e-commerce growth, creating significant opportunities for brands worldwide
Countries like Australia are also forging ahead with sustainable fashion, impelled by increased consumer awareness and government encouragement. Fibre2Fashion says that Australian brands are increasingly embracing sustainable practices like the use of recycled materials and observance of good labor conditions as part of the wider movement in the country toward reducing the environmental effects of fashion, such as waste management and ethical consumption. Australian governments have also continued to support these initiatives through policies that encourage companies to be more sustainable, while also creating awareness among consumers of the need for sustainability in fashion. This will be crucial in developing a more sustainable fashion market, replete with longer-run environmental and social benefits rather than just short-run profits.
With this trend, the Sustainable Apparel Market is bound to see significant growth as the global fashion industry increasingly adopts more sustainable means. What has, therefore, probably caused this trend to emerge is the cumulative effect of consumer awareness, progress in recycling technologies, and favorable government policies, which have set in motion an enabling environment within which sustainable fashion can continue to grow. As more countries and companies embrace these practices, the market is bound to see a wider range of sustainable products with even more innovative ways in which environmental impact will be lessened from the production side of things. This will not only preserve the earth but also help ensure that no worker is exploited and comes under any crucial circumstances. It will help to open up a better world: one with equality, social justice, and a healthy environment. The future of fashion is irrecoverably towards sustainability, and this industry will play the most crucial role in shaping a more sustainable world.
Sustainable Apparel Market Drivers:
-
Increasing consumer preference for environmentally friendly products
The general demand for sustainability by consumers in all products is the main force behind the sustainable apparel market, representative of broader changes at the societal scale towards sustainability. A more conscious consumer is indeed increasingly committed to choosing environment-friendly purchases. This increasing trend is seen within all age groups, which in turn is attributed to rising awareness related to environmental changes such as climate change, pollution, and resource depletion. For instance, more and more consumers like to opt for apparel brands that depend on organic material or recycled material and avoid conventional textiles due to toxic chemical treatment and wasteful water usage. Patagonia and Stella McCartney leveraged this by selling sustainable materials products through transparent, ethical methods of production. Also, there is an increasing demand for certification and labeling schemes that could guarantee the environmental credentials of products, such as GOTS and Cradle to Cradle. It boosts not only consumer behavior but also how the brands design and produce their products. Where eco-conscious fashion is concerned, traditional brands go back to the drawing board and then create a greater diffusion of these sustainable practices throughout the industry. For example, major retailers like H&M and Zara are increasingly including sustainable collections in their offerings and set ambitious goals for themselves to reduce their carbon footprint and improve their supply chain transparency. Because consumers' preferences are gradually shifting, it's encouraging innovation in the fashion industry through new materials and technologies introduced to reduce environmental impact, such as biodegradable fabrics and waterless dyeing techniques. In general, the consumer trend toward green products is reshaping the apparel market toward obliging brands to be sustainable while giving a wider choice to eco-conscious consumers.
-
Increasing Government Regulations and Industry Standards
Increasing regulation by government and industry standards also fosters the growth of the Sustainable Apparel Market. This, in turn, is forcing many fashion companies to outdo each other in improving their environmental and ethical performances. Governments of many countries have started to wake up to the fact that a solution has to be found for the environmental impact of clothing manufacture and hence are enacting legislation on the reduction of waste, reduction of carbon emissions, and other such ethical labor practices. For example, the European Union's Green Deal includes legislation that requires a higher percentage of recycling in textiles and the usage of sustainable materials. With the added push of legislation, Apparel producers are gracing eco-friendly practices such as the reduction in the use of toxic chemicals and enhancing the company's waste management system. Besides that, extended producer responsibility policies are already being enforced in many countries. These make brands responsible for managing the full life cycle of their products and resulting post-consumer waste. A variety of take-back and recycling programs are in motion where customers can return their old clothes for recycling or repurposing. Meanwhile, the industry is setting standards and certifications, such as Fair Trade and the Ethical Trading Initiative, that assure social and environmental performance and make sure apparel brands are adopting ethical labor practices, and caring for the environment. This is often done through frequent audits and open reporting on efforts related to sustainability, thus nurturing accountability and continuous improvement. This increased pressure from regulatory bodies, together with the efforts within the industry, drives innovation in sustainable apparel-new technologies and materials that reduce environmental impact. New fabric biodegradation and water-saving dyeing technologies were developed owing to pressures laid by regulations on resource consumption and waste generation. All in all, the high tide of government regulations and industrial standards pushes the fashion industry towards being more sustainable. It simultaneously enables brands to act more responsibly and contribute to a more sustainable future when it comes to apparel production.
Sustainable Apparel Market Restraints:
-
High costs of sustainable materials and production processes can limit affordability and market adoption for eco-conscious apparel
High costs associated with materials and methods of production that are sustainable primary restraint to the Sustainable Apparel Market render eco-friendly apparel less affordable for people and, therefore, may restrain wider diffusion. In March 2023, the Swedish apparel brand H&M signaled that scaling up its organic cotton usage is challenging due to the higher costs compared to conventional cotton, which would make products from its sustainable collections more expensive. For instance, in July 2023, the Italian luxury fashion house Gucci also struggled with including environmentally friendly materials such as recycled polyester into its product ranges because many of these products have to bear higher prices and more elaborate supply networks, adding up to the cost of overall production. This increased cost can reduce affordable access to sustainable clothes, especially for sensitive customers of their prices, and may therefore slow down market penetration compared to affordable traditional fashions. As such, with increasing demand for green products, cost barriers to sustainable materials and methods of production prevent full adoption, which may reduce sustainable fashion to a niche market segment.
Sustainable Apparel Market Opportunities:
-
Rising demand for circular fashion and recycling initiatives offers significant potential for growth and differentiation in the sustainable apparel sector
Increasing demand for circular fashion and recycling initiatives presents enormous opportunities for growth in the sustainable apparel market, with brands competing based on bringing in new ways of waste reduction and resource recovery. For example, Levi Strauss & Co. launched the "Buy Better, Wear Longer" initiative in June 2023, a design of apparel that will be easily recyclable or repairable to afford a circular economy. This initiative responds not only to the growing consumer interest in sustainable fashion but also creates a differential element of competitiveness in the market for Levi's by offering products that contribute to reducing textile waste. Similarly, this October 2023, UK-based fashion brand Stella McCartney introduced her new line of apparel introducing the brand's first collection of regenerative organic cotton and recycled polyester, besides designing products for return and reprocessing after end-of-life through circularity in fashion approach. These, therefore, show the opportunities that exist in the sustainable apparel sector by leveraging consumer preference for circular fashion, while illustrating how brands can use recycling initiatives as a means to improve their market positioning and appeal to eco-conscious consumers.
Sustainable Apparel Market Segment Analysis:
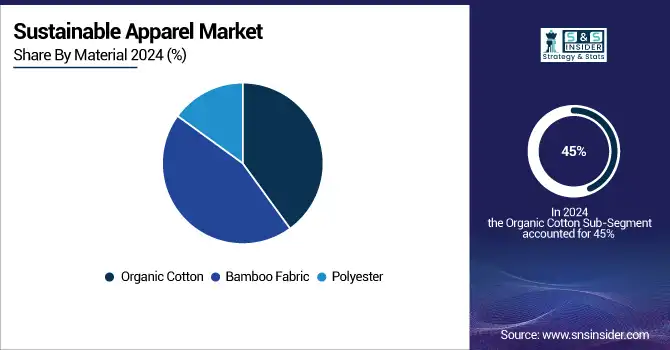
By Material
The Organic Cotton segment dominated the Sustainable Apparel Market, with a market share of approximately 45% in 2024. This can be explained by an increasing consumer preference for natural, biodegradable materials that ensure environmental benefits in contrast to their synthetic counterparts. Organic cotton is preferred because it uses less water and abstains from harmful pesticides; thus, it meets the demand for eco-friendly products on the rise. For example, Levi Strauss & Co. and H&M have invested millions into organic cotton for their sustainable lines by capitalizing on organic cotton's appeal to environmentally conscious consumers. The segment's strong market position indicates a wider trend to favor materials that contribute to more viable agricultural practices and decrease the general ecological footprint of apparel production.
By Product Type
The Cruelty-Free Leather segment dominated the Sustainable Apparel Market in 2024, with a market share of about 38%. Dominance by the segment is because there is emerging demand from consumers for ethical alternatives that are friendly to animals and thus come as an alternative to leather, which has both environmental and ethical implications. Cruelty-free leather made with sustainable materials like pineapple leaves or mushroom-based substrates appeals to consumers in its high-quality, animal-free products that have absolutely no compromise on aesthetics or durability. For example, collections by Stella McCartney and Hermès include cruelty-free leather options, leveraging the appeal of the segment and setting new standards sustainably. This also represents a larger trend in the industry towards greener, more ethical product offerings.
By Distribution Channel
In 2024, the Online segment dominated the Sustainable Apparel Market, with an estimated share of about 60%. Driving this in sustainable apparel is the convenience and wider access to e-commerce platforms that are enabling consumers to switch toward online channels. These channels can be utilized in ordering a wide range of eco-friendly products offered by various brands with no geographic boundaries. Large e-retailers, for example, have included more sustainable fashion in their offering, so it's much easier for the customer to find and buy green clothing. Other direct-to-consumer brands, such as Reformation and Everlane, use their websites to carry exclusive sustainable lines and highly detailed product information with which to hook an increasingly eco-minded shopper. This infers an increase in the dominance of online channels for preferred access to and purchase of sustainable apparel.
By End Use
The women's segment dominated the Sustainable Apparel Market in 2024, with an estimated share of about 55%. This is basically because the demand for sustainable fashion is higher among women, mainly those interested in environmental and ethical issues who tend to go for eco-friendly clothing options. This has encouraged brands like Patagonia and Reformation to offer a wide range of regular sustainable women's collections, from everyday wear to high fashion. Besides, women's fashion generally includes more styles and seasonal collections, which provide a faster pace for the adoption of sustainable materials and practices. This focus on women's apparel is emblematic of the larger market trend: women are driving demand for more sustainable fashion, and pushing the bar higher and higher on industry standards.
Sustainable Apparel Market Regional Analysis:
North America Sustainable Apparel Market Trends:
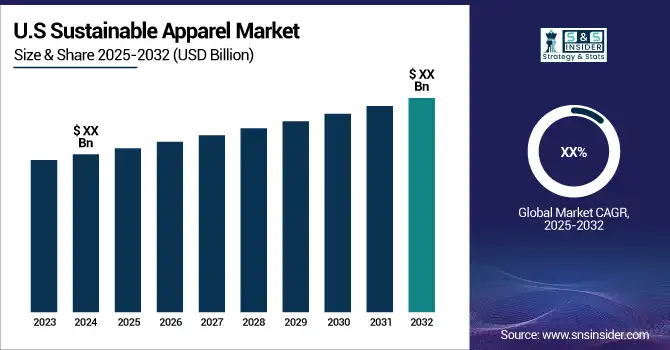
North America dominated and accounted for the largest share in the Sustainable Apparel Market in 2024 at about 40%. It was probably because of the increasing demand from a healthy consumer base, which is never disappointing and pays more emphasis on sustainability and ethics while making purchase decisions. Fast growth has been observed in the United States and Canada regarding sustainable fashion, where popular brands like Patagonia and Stella McCartney each play an important role in providing eco-friendly apparel. The development of online shopping channels and the growth of eco-friendly legislation also facilitated such growth. Besides, the relatively high level of awareness among customers and demand for supply chain transparency has resulted in a wide intrusion of sustainable practices among North American retailers, expected to further cement the leading position of the region in the market.
Get Customised Report as per Your Business Requirement - Enquiry Now
Europe Sustainable Apparel Market Trends:
Europe held a significant share in the Sustainable Apparel Market in 2024, The region’s growth is driven by rising consumer awareness of environmental and ethical issues, coupled with strong government initiatives promoting sustainable fashion. Countries like the UK, Germany, and France are leading the way, with brands such as Finisterre, People Tree, and Stella McCartney setting examples in eco-friendly apparel. The expansion of online retail platforms, stringent environmental regulations, and increasing demand for transparency in the supply chain have further fueled the adoption of sustainable apparel in Europe.
Asia-Pacific Sustainable Apparel Market Trends:
Asia-Pacific is expected to witness the fastest growth in the Sustainable Apparel Market from 2024 to 2032, with a CAGR significantly higher than other regions. Increasing environmental awareness among consumers in countries like Japan, China, and Australia is driving the demand for sustainable fashion. The presence of emerging eco-conscious brands like Tentree and Vuori, coupled with the growth of e-commerce platforms, is accelerating market adoption. Government incentives, coupled with rising disposable income and growing interest in ethical consumption, are also contributing to the rapid expansion of sustainable apparel in the region.
Latin America Sustainable Apparel Market Trends:
Latin America accounted for a growing share of the Sustainable Apparel Market in 2024, driven by increasing awareness of environmental issues and sustainable lifestyles in countries like Brazil and Mexico. Consumers are gradually preferring ethically sourced and eco-friendly apparel, while local sustainable brands are emerging to meet this demand. The expansion of online shopping, coupled with educational campaigns on sustainability, is contributing to the market growth in the region.
Middle East & Africa Sustainable Apparel Market Trends:
The Middle East & Africa region is gradually adopting sustainable apparel, with steady growth observed in 2024. Consumers in countries such as the UAE and South Africa are increasingly showing interest in eco-friendly and ethically produced clothing. Luxury sustainable brands like Stella McCartney and PANGAIA are gaining traction among affluent and environmentally conscious buyers. Government policies encouraging sustainable practices and the rise of online fashion retailing are supporting the market growth.
Sustainable Apparel Market Key Players:
-
Finisterre
-
Everlane
-
Tentree
-
Kotn
-
Able
-
Boden
-
Carnegie
-
PANGAIA
-
Vuori
-
Stella McCartney
-
EILEEN FISHER
-
Outerknown
-
Reformation
-
People Tree
-
Nudie Jeans
-
Thought Clothing
-
Amour Vert
-
Veja
Sustainable Apparel Market Competitive Landscape:
The Austin Company, established in 1878 in Cleveland, Ohio, by Samuel Austin, is a leading provider of integrated design, engineering, and construction services. Renowned for pioneering The Austin Method®, the company delivers efficient, cost-effective solutions across industries including aerospace, automotive, food processing, and pharmaceuticals. In 2006, it became a subsidiary of Kajima USA.
-
April 2024: Austin exhibit melds sustainable fashion with recycled-sequin technologies in an ongoing effort to lessen the environmental impact of the fashion industry.
Carnegie Fabrics LLC, established in 1950 and based in Rockville Centre, New York, is a leading designer and manufacturer of sustainable commercial textiles and acoustic solutions. The company pioneered 100% PVC-free materials and developed Biobased Xorel, the world’s first biobased high-performance textile. Certified B Corporation since 2014, Carnegie champions responsible innovation in interior design.
-
July 2023: The Carnegie is proud to announce the latest offering in Sustainable High-Performance Textiles with the launch of its new line, the Hygeia Collection. It is a 100% PVC Free Textile and Materials Company.
| Report Attributes | Details |
| Market Size in 2024 | USD 12.22 Billion |
| Market Size by 2032 | USD 24.53 Billion |
| CAGR | CAGR of 9.1% From 2025 to 2032 |
| Base Year | 2024 |
| Forecast Period | 2025-2032 |
| Historical Data | 2021-2023 |
| Report Scope & Coverage | Market Size, Segments Analysis, Competitive Landscape, Regional Analysis, DROC & SWOT Analysis, Forecast Outlook |
| Key Segments | • By Material (Organic Cotton, Bamboo Fabric, Polyester) • by Product Type (Animal Free Wool, Cruelty Free Leather, Cruelty Free Silk, Vegan Fur Made, Eco-friendly Rubber) • by Distribution Channel (Online, Offline) • by End Use (Men, Women, Kids) |
| Regional Analysis/Coverage | North America (US, Canada), Europe (Germany, UK, France, Italy, Spain, Russia, Poland, Rest of Europe), Asia Pacific (China, India, Japan, South Korea, Australia, ASEAN Countries, Rest of Asia Pacific), Middle East & Africa (UAE, Saudi Arabia, Qatar, South Africa, Rest of Middle East & Africa), Latin America (Brazil, Argentina, Mexico, Colombia, Rest of Latin America). |
| Company Profiles | Pact Clothing, Finisterre, Everlane, Patagonia, Tentree, Kotn, Able, Boden, Carnegie, PANGAIA, Vuori, Stella McCartney, EILEEN FISHER, Outerknown, Reformation, People Tree, Nudie Jeans, Thought Clothing, Amour Vert, Veja |
Get in Touch
