
Organic Chemicals Market Report Scope & Overview:
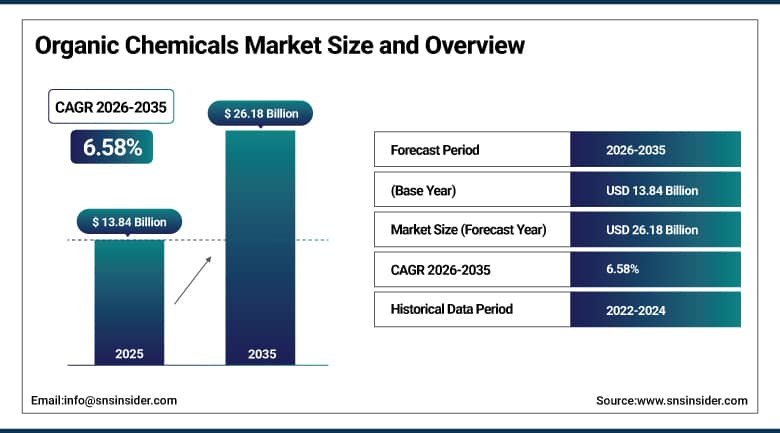
The Organic Chemicals Market size was valued at USD 13.84 Billion in 2025 and is expected to reach USD 14.75 Billion in 2026, rising to USD 26.18 Billion by 2035. The market is forecast to expand at a CAGR of 6.58% during 2026–2035. Organic chemicals are carbon based compounds, including alcohols, acids, amines, solvents and intermediates, that serve as building blocks for plastics, medicines, crop protection products, food ingredients and personal care goods. Steady demand from these downstream sectors, together with new feedstock routes, supports market growth. Pharmaceutical, agrochemical and packaging uses account for much of the incremental volume.
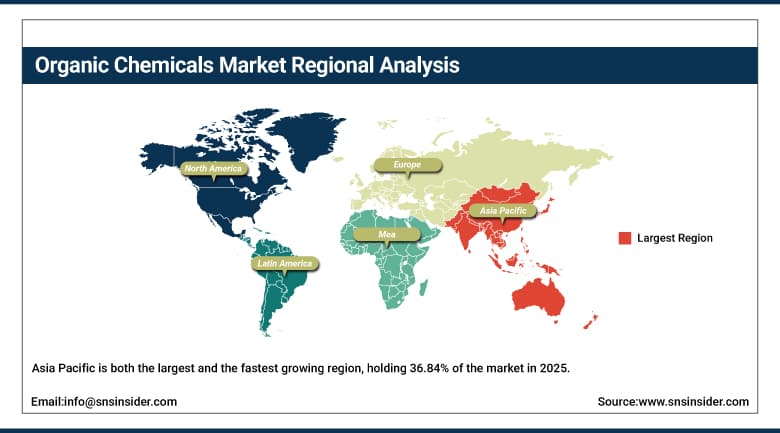
Asia Pacific accounted for the largest share of the market, at 36.84% in 2025, supported by integrated chemical complexes, large manufacturing bases and rising consumption in China, India, Japan and South Korea. North America follows, helped by low cost natural gas feedstocks, while Europe is shaped by energy costs and chemical safety rules. Asia Pacific is also the fastest growing region, as new plants and downstream industries continue to expand across the region, and Latin America and Middle East & Africa remain smaller markets. Capacity additions in the Middle East and the United States also shape global trade flows.
To Get More Information On Organic Chemicals Market - Request Free Sample Report
Key Report Takeaways:
-
By source, synthetic held a 63.74% share in 2025, while natural is the fastest growing.
-
By type, aromatic held a 38.74% share in 2025, while aliphatic is the fastest growing.
-
By application, plastics and polymers held a 37.46% share in 2025, while pharmaceuticals are the fastest growing.
-
By region, Asia Pacific held a 36.84% share in 2025 and is also the fastest growing.
Market Trends and Insights:
Producers are testing bio-based and recycled routes for compounds that were once made only from oil and gas. Renewable feedstocks, chemical recycling of plastics and captured carbon are entering pilot and early commercial plants, which lets buyers claim lower footprints for products such as acids, alcohols and solvents.
Portfolios are shifting toward higher value intermediates. Several large groups are closing or selling older commodity units in Europe and reinvesting in specialty intermediates for pharmaceuticals, crop protection and electronics, where margins are steadier and customers value consistent quality.
Digital tools are reaching the plant floor. Process models, predictive maintenance and automated quality control help operators run complex Verbund sites with fewer outages, and they allow faster changeovers between grades when customers need smaller batches of tailored intermediates.
Drivers Impact Analysis:
|
Driver |
(~) Percentage Point Impact on Market CAGR |
Geographic Relevance |
Impact Timeline |
|---|---|---|---|
|
Rising plastics, polymer and packaging demand |
+2.41% |
Global |
Long term (4 years or more) |
|
Growth in pharmaceutical and agrochemical intermediates |
+1.82% |
Asia Pacific and North America |
Medium term (2 to 4 years) |
|
Policy support for clean and bio-based chemicals |
+1.46% |
Europe and North America |
Medium term (2 to 4 years) |
|
Feedstock advantage and new capacity |
+1.19% |
North America and Middle East & Africa |
Short term (2 years or less) |
|
Consumer, food and personal care demand |
+0.70% |
Asia Pacific and Latin America |
Medium term (2 to 4 years) |
Rising Plastics, Polymer and Packaging Demand
Ethylene, propylene, benzene, phenol and acetic acid derivatives flow into resins, fibers, adhesives and coatings that appear in almost every consumer and industrial product. Packaging, construction, vehicles and electronics all consume more polymers as incomes rise and urban housing expands, and the intermediates that feed those polymers are organic chemicals. Light but durable materials also help automakers and appliance makers cut weight and energy use, so polymer growth remains closely tied to the volumes of basic organic chemicals that producers ship each year. Recycling and renewable routes are expected to supply a growing portion of these needs.
Growth in Pharmaceutical and Agrochemical Intermediates
Drug makers and crop protection companies rely on a wide range of organic building blocks, including acid chlorides, amines, solvents and heterocycles. Aging populations, wider access to medicines and the need to raise crop yields on limited farmland keep demand for these intermediates growing faster than bulk chemicals. Contract manufacturers in India and China expand synthesis capacity, while Western buyers diversify sourcing, which increases orders for qualified suppliers that can document purity, traceability and regulatory compliance. Regulatory filings for new molecules also add steady demand for custom synthesis and for solvents used in purification, crystallization and analytical work across laboratories and plants.
Policy Support for Clean and Bio-Based Chemicals
Governments are linking industrial support to cleaner production. On 8 July 2025, the European Commission presented an action plan for the chemical industry that proposes fiscal incentives and tax measures to raise demand for clean chemicals, along with a Critical Chemical Alliance to guard against capacity closures. Such measures encourage investment in renewable feedstocks, recycled carbon and low emission process heat, and they give producers of bio-based alcohols, acids and solvents a clearer path to commercial scale. Public funding for pilot plants and green procurement rules in several member states complement these measures, and they reduce the risk for first-of-a-kind investments in cleaner organic production.
Feedstock Advantage and New Capacity
Regions with low cost gas and ethane can produce organic chemicals at a lower cost than naphtha-based competitors. In June 2026, the American Chemistry Council forecast that U.S. chemical exports would rise 4.00% in 2026 as production in the Middle East and parts of Asia was disrupted, and it pointed to abundant natural gas as a lasting competitive advantage. New crackers, methanol units and derivative plants along the Gulf Coast and in the Middle East add supply and attract downstream investment. Producers with ethane access also benefit from lower operating costs, which supports expansion plans in downstream derivatives.
Consumer, Food and Personal Care Demand
Flavors, preservatives, emulsifiers, surfactants, fragrances and cosmetic ingredients are made from organic chemicals, and their consumption rises with urban incomes and packaged food sales. Consumers also prefer natural and plant-derived labels, which opens room for fermentation-based and naturally sourced molecules. Retail and personal care brands in Asia Pacific and Latin America keep widening product ranges, and this steady flow of reformulations supports orders for specialty alcohols, esters, acids and amines. Growth in e-commerce and ready-to-eat meals further increases demand for packaging additives and food-grade solvents, and manufacturers of household cleaners need a dependable supply of surfactant intermediates for their products.
Restraints Impact Analysis:
|
Restraint |
(~) Percentage Point Impact on Market CAGR |
Geographic Relevance |
Impact Timeline |
|---|---|---|---|
|
Energy and feedstock cost pressure on European output |
-0.46% |
Europe |
Medium term (2 to 4 years) |
|
Chemical safety and PFAS regulation |
-0.28% |
Europe and North America |
Long term (4 years or more) |
|
Overcapacity and trade tensions |
-0.18% |
Global |
Short term (2 years or less) |
|
Price cycles and substitution by bio-based or recycled inputs |
-0.08% |
Global |
Medium term (2 to 4 years) |
Energy and Feedstock Cost Pressure on European Output
European plants pay more for gas, power and carbon than rivals in North America and the Middle East, and several upstream units have become unprofitable. In October 2026, the European Chemical Industry Council reported that EU27 chemical production fell 2.00% in the first seven months of 2026, with basic organic chemicals and polymers among the weakest segments. Closures reduce regional supply, push buyers toward imports and slow investment in new units, which weighs on the growth of a region that once led the market. Several operators have also announced reviews of remaining assets.
Chemical Safety and PFAS Regulation
On 2 March 2026, the Committee for Risk Assessment of the European Chemicals Agency adopted its final opinion on the proposed restriction of PFAS, a family that includes many fluorinated organic chemicals and intermediates. Producers must map their portfolios, qualify alternatives and prepare for tighter limits on emissions and uses. Registration, testing and reporting duties also grow in the United States and Asia, and they raise compliance costs, especially for smaller producers with limited regulatory staff. Fluorinated solvents, surfactants and process aids are widely used in coatings, electronics and pharmaceutical synthesis, so replacement candidates require extensive testing and customer approval before they can be sold, which delays product launches and reduces margins during the transition.
Overcapacity and Trade Tensions
New integrated complexes in China and the Middle East have added supply faster than demand in several product chains, which pressures margins on commodity intermediates and solvents. Anti-dumping measures, tariffs and export controls then redirect trade flows and make planning harder for producers and buyers alike. Companies respond by idling older units and seeking long term offtake contracts, yet the adjustment takes time, and uneven utilization keeps prices and profits volatile in many regional markets. Smaller producers without integrated downstream businesses find it hardest to ride out these periods, and some may exit specific product lines altogether.
Price Cycles and Substitution by Bio-Based or Recycled Inputs
Organic chemical prices follow crude oil, natural gas and naphtha, so revenues swing with energy markets even when volumes are stable. Buyers also test recycled polymers, bio-based building blocks and alternative chemistries in order to meet sustainability targets, and some of these substitutes displace conventional intermediates in packaging and consumer goods. The shift is gradual, but it forces incumbent producers to defend volumes while investing in cleaner processes. Buyers also negotiate contracts with price formulas linked to feedstock indexes, which narrows the ability of producers to protect margins when raw material costs rise faster than finished product prices, and this cycle repeats in most regional markets.
Organic Chemicals Market Segment Analysis:
By Source, Synthetic Dominates Organic Chemicals Market; Natural to Register Fastest Growth.
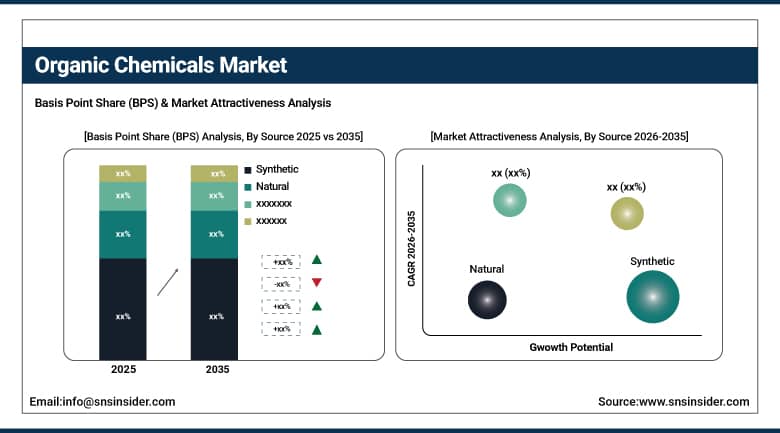
Synthetic organic chemicals hold a 63.74% share in 2025 because petrochemical and coal-based routes deliver large volumes at stable cost and consistent purity. Crackers, reformers and methanol units feed integrated chains that convert a single feedstock into dozens of intermediates, which gives producers scale benefits. Buyers in plastics, fibers, paints and pharmaceuticals depend on this reliable supply, and long established specifications keep switching costs high. Large captive volumes within integrated sites further stabilize utilization rates across product chains.
Natural organic chemicals are projected to grow at a CAGR of 8.64% during 2026–2035. Fermentation, plant extraction and bio-based processes now supply alcohols, acids, flavors and fragrance ingredients for food, cosmetics and household products. Consumers prefer plant-derived labels, brands set renewable content goals, and improved yields from engineered microbes are narrowing the cost gap with petrochemical equivalents. Regulators also encourage lower carbon products through green public procurement and labeling schemes, which strengthens the commercial case for these routes.
By Type, Aromatic Dominates Organic Chemicals Market; Aliphatic to Register Fastest Growth.
Aromatic compounds, led by benzene, toluene and xylenes, represent 38.74% of the market in 2025. Their stable ring structure makes them valuable starting points for styrene, phenol, nylon intermediates, polyesters, pigments and dyes. Refinery reformers and steam crackers produce them in volume, and large downstream complexes in Asia absorb the output. Applications in packaging, textiles, coatings and electronics keep demand steady across economic cycles. Fused ring chemistry also underpins high performance polymers used in electronics and aerospace parts.
Aliphatic compounds, including alcohols, acids, esters and amines, are expected to expand at a CAGR of 7.46% from 2026 to 2035. Their flexible chains suit solvents, surfactants, lubricants and pharmaceutical intermediates, and they accept bio-based feedstocks more readily than rings. Regulators also scrutinize several aromatic products, so formulators in coatings and cleaning favor lower hazard aliphatic alternatives. Bio-based routes to fatty alcohols, lactic acid and succinic acid also scale more easily, and investors support new plants for these molecules.
By Application, Plastics and Polymers Dominate Organic Chemicals Market; Pharmaceuticals to Register Fastest Growth.
Plastics and polymers account for 37.46% of the market in 2025, since ethylene, propylene, vinyl chloride, styrene and phthalate derivatives are consumed in large volumes to make packaging film, pipes, foams, fibers and automotive parts. Construction, retail and electronics supply a steady base of orders, and integrated producers place intermediates directly into their own polymer lines. This captive use shortens supply chains and supports stable operating rates. Flexible packaging and lightweight vehicle parts continue to add volume each year.
Pharmaceuticals are projected to record the highest CAGR, at 8.92% over 2026–2035. Active ingredient synthesis uses solvents, reagents and intermediates in many steps, and growing drug pipelines, generic production and contract manufacturing raise consumption. Governments also encourage local drug manufacturing, and purity and traceability needs favor suppliers that invest in dedicated, well documented production lines, which also helps secure multi-year supply agreements. Peptide, biologic and small molecule programs all require advanced reagents, which supports premium pricing for qualified suppliers.
Geography Analysis:
|
Region |
Major Country |
Share within Region, 2025 (%) |
|---|---|---|
|
Asia Pacific |
China |
51.37% |
|
North America |
United States |
83.24% |
|
Europe |
Germany |
24.86% |
|
Middle East & Africa |
Saudi Arabia |
38.45% |
|
Latin America |
Brazil |
46.12% |
Asia Pacific Organic Chemicals Market
Asia Pacific is both the largest and the fastest growing region, holding 36.84% of the market in 2025 and projected to register a CAGR of 7.86% over 2026–2035. China leads, with the largest base of integrated refining and chemical complexes, coal-to-chemicals units and downstream plastics, textile and electronics industries. Local producers keep adding capacity in intermediates and specialty grades, and local demand from manufacturing and packaging keeps plant utilization high. Government support for industrial parks, port infrastructure and feedstock security also encourages foreign and local groups to commit capital.
India is the fastest growing country in the region, supported by chemical parks, expanding pharmaceutical and agrochemical industries and rising consumer goods demand. Japan and South Korea focus on high purity and electronic grade intermediates, while Southeast Asia adds petrochemical complexes and export-oriented plants. Strong industrial growth and large investments should keep regional growth above the global rate. Research centers and universities in the region work closely with producers on catalysts, process intensification and bio-based chemistry, which shortens the path from laboratory to plant.
Get Customized Report as Per Your Business Requirement - Enquiry Now
North America Organic Chemicals Market
North America accounted for 28.47% of the market in 2025. The U.S. market was valued at USD 3.28 Billion in 2025 and is expected to register a CAGR of 5.66% during 2026–2035. Abundant natural gas and ethane supply low cost feedstocks, and Gulf Coast producers operate large crackers, methanol units and acetyl chains that serve plastics, coatings and pharmaceutical customers. Exports of gas-based chemistries add further volume. Pharmaceutical clusters in New Jersey, Indiana and North Carolina buy solvents and intermediates under strict quality systems.
Canada contributes through petrochemicals in Alberta and Ontario, and Mexico is included in Latin America in this report. Capital spending is cautious in the near term, yet new derivative units and recycling projects continue to move forward. Housing weakness and trade policy create uncertainty, but energy advantage and pharmaceutical and electronics demand support steady growth. Universities and national laboratories support research on catalysts, renewable carbon and chemical recycling, and venture funding for startups in these areas remains active despite slower public markets.
Europe Organic Chemicals Market
Europe held 23.12% of the market in 2025. Germany leads the region, anchored by large integrated Verbund sites in Ludwigshafen and other chemical clusters that supply automotive, machinery, pharmaceutical and consumer industries. High energy prices and strict regulation challenge older commodity units, so producers concentrate on specialty intermediates, process efficiency and low carbon products. Research institutes and chemical associations coordinate programs on circular feedstocks, and customers in automotive and pharmaceutical industries insist on traceable supply. Biotech and chemical research centers add specialty demand.
France, the Netherlands, Belgium, Italy and Spain contribute through refining-linked and specialty production, while the United Kingdom has seen several closures of acetyl and olefin units. Research strength in catalysis and bio-based chemistry keeps the region influential in technology, and policy support for clean chemicals could encourage new investment in renewable feedstock projects. Trade exposure is high, so exchange rates, shipping costs and tariff decisions influence competitiveness, and producers watch import volumes from Asia and the United States closely. Vendor audits remain strict.
Middle East & Africa Organic Chemicals Market
Middle East & Africa held 5.84% of the market in 2025. Saudi Arabia leads, with large petrochemical complexes that use low cost ethane and naphtha to make olefins, methanol, glycols and aromatics for export. The United Arab Emirates, Qatar and Kuwait add integrated refining and chemical projects, and national strategies encourage a shift toward downstream and specialty products. Free zones and industrial cities support new plants by offering utilities, ports and tax incentives to investors from Asia and Europe. Gulf output continues growing.
In Africa, South Africa produces coal and gas-based organic chemicals, and Egypt and Nigeria are expanding fertilizer and methanol chains. Regional output remains small compared with the volumes that move to Asia and Europe, and exposure to geopolitical disruption affects shipping and plant operations, yet new downstream investments and export agreements are gradually widening the market. Strategic partnerships between national oil companies and global chemical groups help transfer process technology, and they should add downstream capacity in specialty grades during the forecast period.
Latin America Organic Chemicals Market
Latin America accounted for 5.73% of the market in 2025. Brazil leads, with petrochemical complexes in Bahia, Rio Grande do Sul and Sao Paulo, an ethanol-based chemicals industry and a large agricultural sector that consumes crop protection intermediates. Local producers supply plastics, solvents and fertilizer feedstocks, while imports fill gaps in specialty grades. Free trade agreements with Europe and the United States, together with port upgrades in Santos and Suape, support imports of specialty grades and exports of commodity chemicals. Agricultural chemicals demand remains stable.
Mexico contributes through petrochemicals, pharmaceuticals and nearshored manufacturing, and Argentina benefits from shale gas that supports methanol and fertilizer projects. Currency swings, energy prices and uneven investment limit growth, but the shift toward bio-based chemicals from sugarcane and the strength of regional agriculture provide long term support. Biofuel programs and ethanol output create feedstocks for green ethylene and other renewable intermediates, and the region is positioned to supply bio-based building blocks to global buyers. Local sourcing of sugarcane inputs also reduces exposure to imported oil-based feedstocks.
Competitive Landscape:
The Organic Chemicals Market is moderately consolidated. Large integrated groups such as BASF, Dow, SABIC, LyondellBasell, Eastman, INEOS and Celanese control a large share of basic and intermediate production, while regional producers and specialty firms serve narrower product chains. Competition centers on feedstock cost, scale, process efficiency, product quality, logistics and the ability to supply regulated customers in pharmaceuticals and food.
Vendors follow several strategies. Leading groups close or sell older units in high cost regions, expand capacity in specialty intermediates and low cost locations, and invest in recycling and bio-based routes. Price actions, asset swaps and long term supply agreements with downstream customers are also common.
Organic Chemicals Market Industry Leaders:
1. BASF: German chemical group with a broad range of intermediates and Verbund sites.
2. Dow: U.S. producer of olefins, polyols and organic intermediates.
3. SABIC: Saudi producer of petrochemicals, methanol and glycols.
4. LyondellBasell Industries: Producer of olefins, polyolefins and oxyfuels.
5. Eastman Chemical Company: U.S. specialty materials and chemical intermediates maker.
Companies Covered in this Report:
-
BASF SE
-
Dow Inc.
-
SABIC
-
LyondellBasell Industries N.V.
-
Eastman Chemical Company
-
INEOS Group
-
Celanese Corporation
Recent Industry Developments:
-
July 2025: Dow announced the shutdown of three upstream assets in Germany and the United Kingdom as part of its European restructuring.
-
January 2026: SABIC agreed to sell its European petrochemicals business to AEQUITA and its engineering thermoplastics business to Mutares.
-
March 2026: Celanese announced global price increases across its acetyls chain.
-
May 2026: LyondellBasell completed the sale of select European olefins and polyolefins assets to AEQUITA.
-
September 2026: BASF opened a fully modernized acid chlorides and chloroformates plant at Ludwigshafen, raising site capacity by about 30.00%.
-
September 2026: INEOS mothballed its three acetyls units at Hull in the United Kingdom, citing energy and feedstock costs.
-
October 2026: Eastman received a reinstated U.S. Department of Energy award to expand methanolysis recycling capacity at Kingsport.
Scope and Research Methodology
This study estimates the Organic Chemicals Market for 2025 as the base year and forecasts it through 2035. The scope covers carbon based compounds produced for sale as intermediates and end products, including aromatic, aliphatic and carbonyl compounds made from synthetic and natural sources, and supplied to plastics, food, pharmaceutical, agrochemical, personal care and other industries. Values are reported in USD at the producer level. Segmentation covers source, type, application and region. Polymers and finished consumer goods are excluded. Chemicals produced and consumed within the same site are counted at transfer value where they are sold onward as intermediates, and recycled organic chemicals are included.
Secondary research included company annual reports, investor presentations and filings, regulator and government databases, trade association data, product documentation, and peer-reviewed and industry publications. Primary research consisted of structured interviews and surveys with executives, product and business heads, procurement managers and technical specialists across the value chain. These inputs were used to validate production volumes, pricing and the mix of sources, types and applications. Interviews covered producers, traders, converters and end users, which allowed assumptions on feedstock cost and capacity to be tested against current practice. Plant visits and trade show discussions provided further validation of capacity, operating rates and the pace of new project start-ups across regions.
Market size was built from the bottom up using producer revenue, plant capacity and utilization, and was cross-checked from the top down against chemical industry output and downstream consumption. Triangulation across these views fixed the base year value. Forecasts reflect feedstock and energy prices, capacity additions, environmental regulation, trade conditions and macroeconomic conditions, and segment and regional shares were assigned from consumption patterns in each setting. An analyst quality review checked consistency before release. Growth rates for each segment were set so that the parts remain consistent with the whole, and the model was run under conservative, base and optimistic cases.
Organic Chemicals Market Report Scope:
|
Report Attributes |
Details |
|---|---|
|
Market Size in 2025 |
USD 13.84 Billion |
|
Market Size by 2035 |
USD 26.18 Billion |
|
CAGR |
CAGR of 6.58% From 2026 to 2035 |
|
Base Year |
2025 |
|
Forecast Period |
2026-2035 |
|
Historical Data |
2022-2024 |
|
Report Scope & Coverage |
Market Size, Segments Analysis, Competitive Landscape, Regional Analysis, DROC & SWOT Analysis, Forecast Outlook |
|
Key Segments |
• By Source (Synthetic and Natural) |
|
Regional Analysis/Coverage |
North America (US, Canada), Europe (Germany, UK, France, Italy, Spain, Russia, Poland, Rest of Europe), Asia Pacific (China, India, Japan, South Korea, Australia, ASEAN Countries, Rest of Asia Pacific), Middle East & Africa (UAE, Saudi Arabia, Qatar, South Africa, Rest of Middle East & Africa), Latin America (Brazil, Argentina, Mexico, Colombia, Rest of Latin America). |
|
Company Profiles |
Dow Inc., SABIC, LyondellBasell Industries N.V., Eastman Chemical Company, INEOS Group, Celanese Corporation |

Frequently Asked Questions
The market was valued at USD 13.84 Billion in 2025 and is projected to reach USD 26.18 Billion by 2035, growing at a CAGR of 6.58% during 2026–2035.
Asia Pacific leads, with a 36.84% share in 2025, supported by integrated chemical complexes.
Asia Pacific is also expected to grow fastest, at a CAGR of 7.86% during 2026–2035, led by China and India.
Energy costs in Europe, PFAS and chemical safety rules, overcapacity and price cycles restrain faster growth.
Synthetic, aromatic and plastics and polymers lead, while natural, aliphatic and pharmaceuticals grow fastest within their segments.
BASF, Dow, SABIC, LyondellBasell Industries and Eastman Chemical Company lead.
