Targeted Protein Degradation Market Report Scope & Overview:

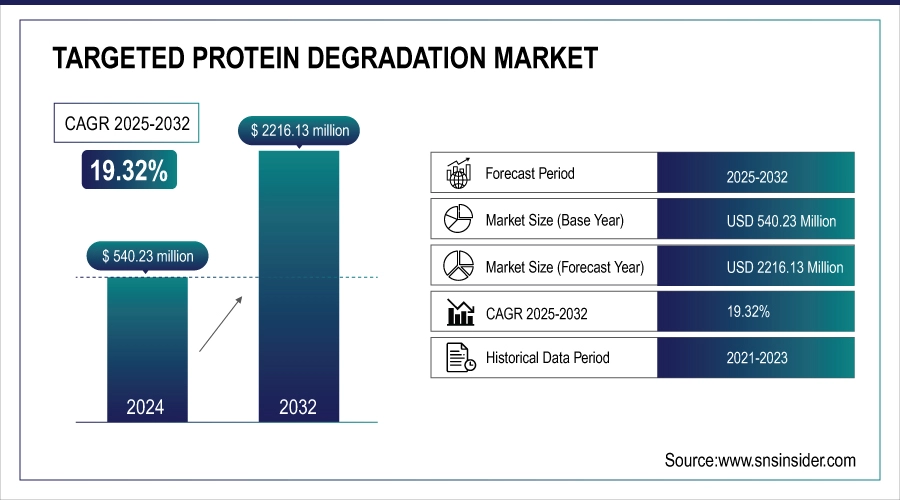
The targeted protein degradation market size was valued at USD 540.23 million in 2024 and is expected to reach USD 2216.13 million by 2032, growing at a CAGR of 19.32% over the forecast period of 2025-2032. 

The global targeted protein degradation market is primarily boosted through its novel mechanism of action and Extreme demand by therapeutics, including PROTACs or Molecular Glues targeting degradation activity on previously un-druggable proteins- with each innovative stage, the chance within the target protein market increases. Moreover, the robust oncology pipeline propels growth higher as the targeted protein degradation market trends toward blood and cancer. These are trends reflecting advances in protein targeting and growth in hot therapeutic areas.

For instance, in March 2025, Arvinas expanded its oncology-focused TPD pipeline with new clinical trials for ARV-471 and ARV-766, highlighting growing targeted protein degradation market trends.

Key Targeted Protein Degradation Market Trends

  • Expansion into traditionally “undruggable” targets, including transcription factors and disease-specific proteins in oncology, neurodegeneration, and autoimmune disorders.

  • Increasing use of PROTACs, molecular glues, and optimized degrader designs for higher specificity and efficacy.

  • Integration of AI, computational modeling, and high-throughput screening for faster, accurate drug discovery and candidate optimization.

  • Focus on personalized medicine with TPD therapies tailored to patient-specific protein expression and genetic profiles.

  • Collaborations between biotech, pharma, and CROs for co-development, licensing, and manufacturing scale-up globally.

  • Development of novel delivery platforms, including nanoparticles, antibody conjugates, and oral degraders for patient-friendly administration.

  • Growing clinical pipeline, biomarker-guided trials, and regulatory progress enhancing adoption and market confidence.

Targeted Protein Degradation Market Report Highlights

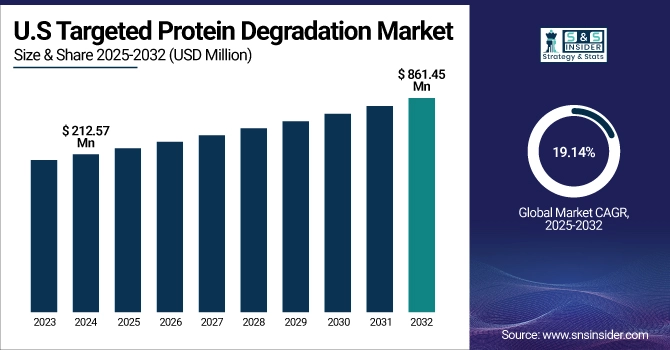
The U.S. targeted protein degradation market was valued at USD 212.57 million in 2024 and is expected to reach USD 861.45 million by 2032, growing at a CAGR of 19.14% over 2025-2032. The U.S. is dominating the targeted protein degradation market analysis as it holds the largest market share due to being a biotech innovation hub. Discover how industry leaders Arvinas, Kymera, and Nurix are advancing oncology-focused PROTACs and molecular glues by expanding both discovery and development pipelines while pushing candidates through clinical trials to commercialization. As the birthplace of so many innovations, this innovation-intensive environment is driving a growing global leadership available for the TPD market.

Targeted Protein Degradation Market Growth Drivers:

  • Expansion into Non-Oncology Indications is Driving the Targeted Protein Degradation Market Growth

The expansion into non-oncology indications is driving the targeted protein degradation market share, as companies increasingly focus on neurological, immunological, and infectious diseases. Brain-penetrant PROTACs and molecular glues enable treatment of Alzheimer’s and Parkinson’s, while emerging modalities broaden therapeutic applications.

For instance, in June 2024, nearly 20% of global TPD candidates focus on neurological and immunological disorders, reflecting the Expansion into Non-Oncology Indications trend.

Targeted Protein Degradation Market Restraints:

  • Complex Drug Design and Development is Hampering the Targeted Protein Degradation Market Growth

Development of PROTACs and molecular glues, which need complex drug design to restrain the targeted protein degradation market growth. Developing potent molecules required meticulous targeting of the E3 ligase, linker optimization, and structural stability. A dismal preclinical and early clinical failure rate drives up costs and risks, thus preventing the quick proliferation of the market, despite an attractive therapeutic appeal.

Targeted Protein Degradation Market Opportunities:

  • Expansion Into Personalized Medicine Drives Future Growth Opportunities for the Targeted Protein Degradation Market

The potential is provided for customized treatments relevant to the proteomic and genetic backgrounds of individual patients through TPD-based therapeutics. Through targeting the proteins that truly drive disease, TPD can offer highly selective interventions, cut off-target damage, and deliver better treatments. These individualised strategies could facilitate precision medicine in cancer, neurodegenerative, and autoimmune diseases, and lead to improved patient response and safety.

For instance, in October 2024, over 160 TPD candidates are in clinical development, with 40+ in Phase II/III trials, reflecting rapid adoption and regulatory progress.

Key Targeted Protein Degradation Market Segment Analysis

  • By therapeutic area, oncology held the largest share of around 61.38%in 2024, and the neurological disorders segment is expected to register the highest growth with a CAGR of 20.87%.

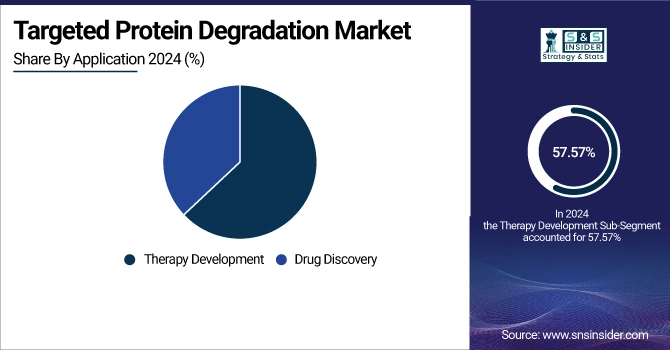
  • By application, the therapy development segment dominated the market with approximately 57.57% share in 2024, while drug discovery is expected to register the highest growth with a CAGR of 19.75%.

  • By type, PROTAC accounted for the leading share of nearly 48.98% in 2024, while molecular glues are expected to register the highest growth with a CAGR of 19.98%.

  • By end user, the pharmaceutical & biotechnology companies segment led the market with about 40.80% share in 2024, while the hospital & clinical laboratories segment is forecasted to grow the fastest at a CAGR of 20.30%.

By Therapeutic Area, Oncology Leads the Market, While Neurological Disorders Register Fastest Growth

The oncology segment accounted for the highest revenue share of approximately 61.38% in 2024, driven by the completely new mechanisms of action offered by PROTACS and molecular glues, together with established, well-characterized clinical pipelines, billions in R&D investment, regulatory tailwinds, and broader strategic collaboration activity is driving significant growth of this nascent but rapidly maturing market for oncology-focused protein degraders. In comparison, the neurological disorders segment is anticipated to achieve the highest CAGR of nearly 20.87% during the 2025–2032 period, due to brain-penetrant PROTACS and increasing R&D investments, along with technological advancements in targeted protein degradation, are likely to continue to accelerate the current pace of innovation.

By Application, the Therapy Development Segment dominates, while the Drug Discovery Segment Shows Rapid Growth

The therapy development segment held the largest revenue share of approximately 57.57% in 2024, fueled by strong R&D pipelines and high clinical volumes. These include the emergence of new mechanisms, strategic partnerships, large amounts of money being invested into the field, regulatory incentives, and technological advancements. On the other hand, the drug discovery segment is predicted to grow at the strongest CAGR of approximately 19.75% during 2025–2032, with novel screening and detection methods, rising R&D investments in biotech pharma collaborations, and expanding non-cancerous pipelines.

By Type, PROTAC Segment Lead, While Molecular Glues Register Fastest Growth

The PROTAC segment accounted for the largest share of the Targeted Protein Degradation Market with about 48.98%, owing to improved efficacy, specificity, and catalytic proteolytic decay of proteins with lesser doses more safely. Their wide-ranging efficacy in oncology, neurological, and immunological diseases, and strong patent coverage. In addition, the Molecular Glues segment is slated to grow at the fastest rate with a CAGR of around 19.98% throughout the forecast period of 2025–2032, driven by their capability of stabilizing protein–ligase interactions and thereby degrading hitherto undruggable proteins. Rapid pipeline expansion of targets across various oncological, immunological, and neurological disorders is being propelled by rising R&D costs. 

By End User, Pharmaceutical & Biotechnology Companies Segment Lead, While the Hospital & Clinical Laboratories Segment Grows the Fastest

The Pharmaceutical & Biotechnology Companies segment held the largest revenue share of around 40.80% in the Targeted Protein Degradation Market in 2024, as a result of their deep R&D, almost unlimited funds, and some very shrewd alliances. Strong oncology and non-oncology pipelines, regulatory backing, technological innovations in PROTACs and molecular glues. On the flip side, the Hospital & Clinical Laboratories segment, however, is projected to register the highest CAGR of around 20.30% during the forecast period of 2025 - 2032, owing to a rise in the acceptance of TPD-based diagnosis and treatment services. The rapid expansion of the protein degradation global market is attributed to increasing clinical trial activity, a growing focus on advanced molecular testing, and personalized medicine.

Asia Pacific Targeted Protein Degradation Market Insights

Asia-Pacific is experiencing significant growth in the targeted protein degradation market, due to growing investments in biotechnology and pharmaceutical research & development, increasing prevalence of cancer and neurological diseases, and expandable medical infrastructure. For example, in countries including China, Japan, and South Korea, clinical trials capacity drives the market, with advanced PROTAC and molecular glue technologies widely accepted. In addition, favorable government regulations, lower manufacturing costs, and increasing collaboration of domestic players with global pharma are stimulating pipeline growth in the Asia-Pacific TPD market, thus making it a burgeoning region with promising prospects.

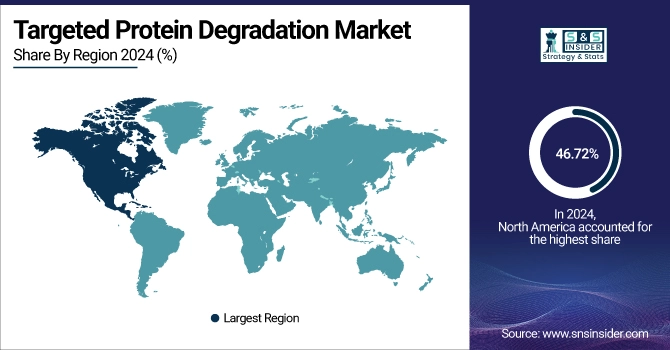
North America Targeted Protein Degradation Market Insights

North America accounted for the highest revenue share of approximately 46.72% in 2024 of the Targeted Protein Degradation Market, owing to its cluster of top biotech and pharma firms, mature clinical trial infrastructure, and numerous research partnerships. Moreover, government supportive funding, stringent IP regulations are likely to propel the research studies of PROTACs and Molecular glues, besides a shift in adoption of novel moieties, act as a catalyst for Proteolysis Targeting Chimera (PROTAC) Technology & Novel MOA-based products, fueling market growth. TPD innovation, development, and commercialization are most robust in North America for all these reasons.

Europe Targeted Protein Degradation Market Insights

The Europe region is projected to witness the fastest CAGR of 20.04% during the forecast period of 2025, owing to a mix of favorable regulations, rising R&D spend, and growing biotech communities. Germany, the U.K., and Switzerland are great examples where their respective governments offer support in the form of grants and incentives for innovative therapies, including PROTACs or molecular glues. There are also greater alliances in allying with European biotech companies by global pharmaceutical companies to fortify their clinical trial competencies and boost their pipelines. An increasing number of patients with oncology, neurological, and immunological disorders drives demand for personalized therapies. Moreover, Europe has a well-established research infrastructure, widespread acceptance of personalized medicines, and robustly protected intellectual property rights. Taken together, this places Europe as a fast-growing market for the TPD side of the opportunity space.

Latin America (LATAM) and Middle East & Africa (MEA) Targeted Protein Degradation Market Insights

The Latin America and Middle East & Africa targeted protein degradation market (TPD) is also growing due to rising healthcare expenditure, biotech alliances, and unmet medical needs. The areas are for clinical trial growth, local manufacturing, and enhanced access to next-gen protein degrader treatments.

Competitive Landscape for the Targeted Protein Degradation Market:

Catalent is the leading global provider of advanced delivery technologies and development solutions for drugs, biologics, and consumer health products. The company offers a wide range of services, from biologics to gene therapies to soild doses, for pharmaceutical and biotechnology companies all over the globe.

  • In February 2025, Catalent reported expanding its biologics and protein degrader manufacturing capabilities, supporting over 25 TPD programs globally, reflecting rising demand for PROTACs and molecular glue therapies.

Recipharm is a leading CDMO (Contract Development and Manufacturing Organisation) in the pharmaceutical industry employing some 5,000 employees. It focuses on clean oral, sterile, and inhaled drug products, providing scalable solutions for the world's leading pharma companies with capacity, expertise, and data integrity focused on delivering compliant products to patients via the Wyeth model.

  • As of January 2025, Recipharm announced a strategic partnership to provide clinical and commercial-scale production for 10+ TPD candidates, highlighting increased outsourcing of degrader development to CDMOs.

PCI Pharma Services is a fully integrated provider of out-sourced pharmaceutical services offering unparalleled expertise and experience in taking compounds from the earliest stages of development through to commercial launch, delivering speed to market and commercial success for its customers. It offers tailored, high-quality solutions in various dosage forms and markets.

  • In March 2025, PCI Pharma Services expanded its specialty drug manufacturing and packaging lines to support early- and late-stage TPD therapeutics, enabling faster market entry and improved patient access.

Targeted Protein Degradation Market Key Players:

Some of the medical suction device market companies are:

  • Arvinas, Inc. 

  • Kymera Therapeutics, Inc.

  • Nurix Therapeutics, Inc.

  • Foghorn Therapeutics, Inc.

  • Therapeutics, Inc. 

  • Vividion Therapeutics, Inc.

  • Bristol Myers Squibb (BMS)

  • Novartis AG

  • Pfizer Inc

  • Amgen Inc.

  • Astellas Pharma Inc.

  • Merck & Co., Inc.

  • Sanofi S.A.

  • Roche Holding AG

  • GlaxoSmithKline (GSK)

  • Evotec SE

  • Ascendis Pharma A/S 

  • Monte Rosa Therapeutics

  • Kyowa Kirin Co., Ltd.

  • Arrowhead Pharmaceuticals, Inc

Targeted Protein Degradation Market Report Scope

Report Attributes Details
Market Size in 2024 USD 540.23 million     
Market Size by 2032 USD 2216.13 million      
CAGR CAGR of 19.32% From 2025 to 2032
Base Year 2024
Forecast Period 2025-2032
Historical Data 2021-2023
Report Scope & Coverage Market Size, Segments Analysis, Competitive Landscape, Regional Analysis, DROC & SWOT Analysis, Forecast Outlook
Key Segments • By Therapeutic Area (Oncology, Neurological Disorders, Immunological & Inflammatory Diseases, Infectious Diseases)
• By Application (Drug Discovery, Therapy Development)
• By Type (PROTAC, Molecular Glues, LYTACs, Others)
• By End User (Pharmaceutical & Biotechnology Companies, Academic & Research Institutes, Hospital & Clinical Laboratories, Others)
Regional Analysis/Coverage "North America (US, Canada), Europe (Germany, France, UK, Italy, Spain, Poland, Russsia, Rest of Europe), Asia Pacific (China, India, Japan, South Korea, Australia,ASEAN Countries, Rest of Asia Pacific), Middle East & Africa (UAE, Saudi Arabia, Qatar, Egypt, South Africa, Rest of Middle East & Africa), Latin America (Brazil, Argentina, Mexico, Colombia Rest of Latin America)"
Company Profiles Catalent, Inc., Recipharm AB, PCI, Arvinas, Inc., Kymera Therapeutics, Inc., Nurix Therapeutics, Inc., Foghorn Therapeutics, Inc., C4 Therapeutics, Inc., Vividion Therapeutics, Inc., Bristol Myers Squibb (BMS), Novartis AG, Pfizer Inc., Amgen Inc., Astellas Pharma Inc., Merck & Co., Inc., Sanofi S.A., Roche Holding AG, GlaxoSmithKline (GSK), Evotec SE, Ascendis Pharma A/S, Monte Rosa Therapeutics, Kyowa Kirin Co., Ltd, Arrowhead Pharmaceuticals, Inc., and other players.

Table of Contents

1. Introduction

1.1 Market Definition & Scope

 1.2 Research Assumptions & Abbreviations

 1.3 Research Methodology

2. Executive Summary

2.1 Market Snapshot

 2.2 Market Absolute $ Opportunity Assessment & Y-o-Y Analysis, 2021–2032

 2.3 Market Size & Forecast, By Segmentation, 2021–2032

  2.3.1 Market Size By Therapeutic Area

  2.3.2 Market Size By Application 

         2.3.2 Market Size By Type

         2.3.2 Market Size By End User

 2.4 Market Share & Bps Analysis By Region, 2024

 2.5 Industry Growth Scenarios – Conservative, Likely & Optimistic

 2.6 Industry CxO’s Perspective

3. Market Overview

3.1 Market Dynamics

  3.1.1 Drivers

  3.1.2 Restraints

  3.1.3 Opportunities

  3.1.4 Key Market Trends

 3.2 Industry PESTLE Analysis

 3.3 Key Industry Forces (Porter’s) Impacting Market Growth

 3.4 Industry Supply Chain Analysis

  3.4.1 Raw Material Suppliers

  3.4.2 Manufacturers

  3.4.3 Distributors/Suppliers

  3.4.4 Customers/End-Users

 3.5 Industry Life Cycle Assessment

 3.6 Parent Market Overview

 3.7 Market Risk Assessment

4. Statistical Insights & Trends Reporting

4.1 Pipeline and Clinical Development Trends (2020–2032)
 4.1.1 Global and regional number of TPD candidates in preclinical and clinical stages
 4.1.2 Growth rate comparison: oncology vs non-oncology indications
 4.1.3 Trends in first-in-class vs next-generation TPD modalities

4.2 Target and Mechanism Utilization (2024)
 4.2.1 Distribution of TPDs by protein target: kinases, transcription factors, epigenetic proteins
 4.2.2 Modality-wise adoption: PROTACs, molecular glues, LYTACs, AUTACs
 4.2.3 Target tissue distribution and disease-specific focus

4.3 R&D Investment and Company Landscape Trends (2020–2024)
 4.3.1 Number of TPD-focused startups, biotech, and pharma collaborations
 4.3.2 Investment trends by region: North America, Europe, APAC
 4.3.3 Patent filings, licensing deals, and partnerships

4.4 Regulatory and Market Access Trends (2024)
 4.4.1 Share of TPD candidates receiving fast-track or orphan designation approvals
 4.4.2 Comparison of regulatory timelines: US FDA vs EMA vs PMDA
 4.4.3 Adoption of value-based pricing and early access programs

4.5 Commercialization and Pricing Trends (2024–2025)
 4.5.1 Average expected therapy pricing for approved TPDs
 4.5.2 Cost-effectiveness and reimbursement adoption across regions
 4.5.3 Trends in payer coverage and patient access programs

5. Targeted Protein Degradation Market Segmental Analysis & Forecast, By Therapeutic Area, 2021 – 2032, Value (USD Billion)

5.1 Introduction

 5.2 Oncology

  5.2.1 Key Trends

  5.2.2 Market Size & Forecast, 2021 – 2032

 5.3 Neurological Disorders

  5.3.1 Key Trends

  5.3.2 Market Size & Forecast, 2021 – 2032

 5.4 Immunological & Inflammatory Diseases

  5.4.1 Key Trends

  5.4.2 Market Size & Forecast, 2021 – 2032

 5.5 Infectious Diseases

  5.5.1 Key Trends

  5.5.2 Market Size & Forecast, 2021 – 2032

6. Targeted Protein Degradation Market Segmental Analysis & Forecast, By Application, 2021 – 2032, Value (USD Billion)

    6.1 Introduction

 6.2 Drug Discovery

  6.2.1 Key Trends

  6.2.2 Market Size & Forecast, 2021 – 2032

 6.3 Therapy Development

  6.3.1 Key Trends

  6.3.2 Market Size & Forecast, 2021 – 2032

7. Targeted Protein Degradation Market Segmental Analysis & Forecast, By Type, 2021 – 2032, Value (USD Billion)

    7.1 Introduction

 7.2 PROTAC

  7.2.1 Key Trends

  7.2.2 Market Size & Forecast, 2021 – 2032

 7.3 Molecular Glues

  7.3.1 Key Trends

  7.3.2 Market Size & Forecast, 2021 – 2032

 7.4 LYTACs

  7.4.1 Key Trends

  7.4.2 Market Size & Forecast, 2021 – 2032

 7.5 Others

  7.5.1 Key Trends

  7.5.2 Market Size & Forecast, 2021 – 2032

8. Targeted Protein Degradation Market Segmental Analysis & Forecast, By End User, 2021 – 2032, Value (USD Billion)

    8.1 Introduction

 8.2 Pharmaceutical & Biotechnology Companies

  8.2.1 Key Trends

  8.2.2 Market Size & Forecast, 2021 – 2032

 8.3 Academic & Research Institutes

  8.3.1 Key Trends

  8.3.2 Market Size & Forecast, 2021 – 2032

 8.4 Hospital & Clinical Laboratories

  8.4.1 Key Trends

  8.4.2 Market Size & Forecast, 2021 – 2032

 8.5 Others

  8.5.1 Key Trends

  8.5.2 Market Size & Forecast, 2021 – 2032

9. Targeted Protein Degradation Market Segmental Analysis & Forecast By Region, 2021 – 2025, Value (USD Billion)

9.1 Introduction

9.2 North America

 9.2.1 Key Trends

 9.2.2 Targeted Protein Degradation Market Size & Forecast, By Therapeutic Area, 2021 – 2032

 9.2.3 Targeted Protein Degradation Market Size & Forecast, By Application, 2021 – 2032

 9.2.4 Targeted Protein Degradation Market Size & Forecast, By Type, 2021 – 2032

 9.2.5 Targeted Protein Degradation Market Size & Forecast, By End User, 2021 – 2032

 9.2.6 Targeted Protein Degradation Market Size & Forecast, By Country, 2021 – 2032

  9.2.6.1 USA

   9.2.6.1.1 Targeted Protein Degradation Market Size & Forecast, By Therapeutic Area, 2021 – 2032

   9.2.6.1.2 Targeted Protein Degradation Market Size & Forecast, By Application, 2021 – 2032

   9.2.6.1.3 Targeted Protein Degradation Market Size & Forecast, By Type, 2021 – 2032

   9.2.6.1.4 Targeted Protein Degradation Market Size & Forecast, By End User, 2021 – 2032

  9.2.6.2 Canada

   9.2.6.2.1 Targeted Protein Degradation Market Size & Forecast, By Therapeutic Area, 2021 – 2032

   9.2.6.2.2 Targeted Protein Degradation Market Size & Forecast, By Application, 2021 – 2032

   9.2.6.2.3 Targeted Protein Degradation Market Size & Forecast, By Type, 2021 – 2032

   9.2.6.2.4 Targeted Protein Degradation Market Size & Forecast, By End User, 2021 – 2032

9.3 Europe

 9.3.1 Key Trends

 9.3.2 Targeted Protein Degradation Market Size & Forecast, By Therapeutic Area, 2021 – 2032

 9.3.3 Targeted Protein Degradation Market Size & Forecast, By Application, 2021 – 2032

 9.3.4 Targeted Protein Degradation Market Size & Forecast, By Type, 2021 – 2032

 9.3.5 Targeted Protein Degradation Market Size & Forecast, By End User, 2021 – 2032

 9.3.6 Targeted Protein Degradation Market Size & Forecast, By Country, 2021 – 2032

  9.3.6.1 Germany

   9.3.6.1.1 Targeted Protein Degradation Market Size & Forecast, By Therapeutic Area, 2021 – 2032

   9.3.6.1.2 Targeted Protein Degradation Market Size & Forecast, By Application, 2021 – 2032

   9.3.6.1.3 Targeted Protein Degradation Market Size & Forecast, By Type, 2021 – 2032

   9.3.6.1.4 Targeted Protein Degradation Market Size & Forecast, By End User, 2021 – 2032

  9.3.6.2 UK

   9.3.6.2.1 Targeted Protein Degradation Market Size & Forecast, By Therapeutic Area, 2021 – 2032

   9.3.6.2.2 Targeted Protein Degradation Market Size & Forecast, By Application, 2021 – 2032

   9.3.6.2.3 Targeted Protein Degradation Market Size & Forecast, By Type, 2021 – 2032

   9.3.6.2.4 Targeted Protein Degradation Market Size & Forecast, By End User, 2021 – 2032

  9.3.6.3 France

   9.3.6.3.1 Targeted Protein Degradation Market Size & Forecast, By Therapeutic Area, 2021 – 2032

   9.3.6.3.2 Targeted Protein Degradation Market Size & Forecast, By Application, 2021 – 2032

   9.3.6.3.3 Targeted Protein Degradation Market Size & Forecast, By Type, 2021 – 2032

   9.3.6.3.4 Targeted Protein Degradation Market Size & Forecast, By End User, 2021 – 2032

  9.3.6.4 Italy

   9.3.6.4.1 Targeted Protein Degradation Market Size & Forecast, By Therapeutic Area, 2021 – 2032

   9.3.6.4.2 Targeted Protein Degradation Market Size & Forecast, By Application, 2021 – 2032

   9.3.6.4.3 Targeted Protein Degradation Market Size & Forecast, By Type, 2021 – 2032

   9.3.6.4.4 Targeted Protein Degradation Market Size & Forecast, By End User, 2021 – 2032

  9.3.6.5 Spain

   9.3.6.5.1 Targeted Protein Degradation Market Size & Forecast, By Therapeutic Area, 2021 – 2032

   9.3.6.5.2 Targeted Protein Degradation Market Size & Forecast, By Application, 2021 – 2032

   9.3.6.5.3 Targeted Protein Degradation Market Size & Forecast, By Type, 2021 – 2032

   9.3.6.5.4 Targeted Protein Degradation Market Size & Forecast, By End User, 2021 – 2032

  9.3.6.6 Russia

   9.3.6.6.1 Targeted Protein Degradation Market Size & Forecast, By Therapeutic Area, 2021 – 2032

   9.3.6.6.2 Targeted Protein Degradation Market Size & Forecast, By Application, 2021 – 2032

   9.3.6.6.3 Targeted Protein Degradation Market Size & Forecast, By Type, 2021 – 2032

   9.3.6.6.4 Targeted Protein Degradation Market Size & Forecast, By End User, 2021 – 2032

  9.3.6.7 Poland

   9.3.6.7.1 Targeted Protein Degradation Market Size & Forecast, By Therapeutic Area, 2021 – 2032

   9.3.6.7.2 Targeted Protein Degradation Market Size & Forecast, By Application, 2021 – 2032

   9.3.6.7.3 Targeted Protein Degradation Market Size & Forecast, By Type, 2021 – 2032

   9.3.6.7.4 Targeted Protein Degradation Market Size & Forecast, By End User, 2021 – 2032

  9.3.6.8 Rest of Europe

   9.3.6.8.1 Targeted Protein Degradation Market Size & Forecast, By Therapeutic Area, 2021 – 2032

   9.3.6.8.2 Targeted Protein Degradation Market Size & Forecast, By Application, 2021 – 2032

   9.3.6.8.3 Targeted Protein Degradation Market Size & Forecast, By Type, 2021 – 2032

   9.3.6.8.4 Targeted Protein Degradation Market Size & Forecast, By End User, 2021 – 2032   

9.4 Asia-Pacific

 9.4.1 Key Trends

 9.4.2 Targeted Protein Degradation Market Size & Forecast, By Therapeutic Area, 2021 – 2032

 9.4.3 Targeted Protein Degradation Market Size & Forecast, By Application, 2021 – 2032

 9.4.4 Targeted Protein Degradation Market Size & Forecast, By Type, 2021 – 2032

 9.4.5 Targeted Protein Degradation Market Size & Forecast, By End User, 2021 – 2032

 9.4.6 Targeted Protein Degradation Market Size & Forecast, By Country, 2021 – 2032

  9.4.6.1 China

   9.4.6.1.1 Targeted Protein Degradation Market Size & Forecast, By Therapeutic Area, 2021 – 2032

   9.4.6.1.2 Targeted Protein Degradation Market Size & Forecast, By Application, 2021 – 2032

   9.4.6.1.3 Targeted Protein Degradation Market Size & Forecast, By Type, 2021 – 2032

   9.4.6.1.4 Targeted Protein Degradation Market Size & Forecast, By End User, 2021 – 2032

  9.4.6.2 India

   9.4.6.2.1 Targeted Protein Degradation Market Size & Forecast, By Therapeutic Area, 2021 – 2032

   9.4.6.2.2 Targeted Protein Degradation Market Size & Forecast, By Application, 2021 – 2032

   9.4.6.2.3 Targeted Protein Degradation Market Size & Forecast, By Type, 2021 – 2032

   9.4.6.2.4 Targeted Protein Degradation Market Size & Forecast, By End User, 2021 – 2032

  9.4.6.3 Japan

   9.4.6.3.1 Targeted Protein Degradation Market Size & Forecast, By Therapeutic Area, 2021 – 2032

   9.4.6.3.2 Targeted Protein Degradation Market Size & Forecast, By Application, 2021 – 2032

   9.4.6.3.3 Targeted Protein Degradation Market Size & Forecast, By Type, 2021 – 2032

   9.4.6.3.4 Targeted Protein Degradation Market Size & Forecast, By End User, 2021 – 2032

  9.4.6.4 South Korea

   9.4.6.4.1 Targeted Protein Degradation Market Size & Forecast, By Therapeutic Area, 2021 – 2032

   9.4.6.4.2 Targeted Protein Degradation Market Size & Forecast, By Application, 2021 – 2032

   9.4.6.4.3 Targeted Protein Degradation Market Size & Forecast, By Type, 2021 – 2032

   9.4.6.4.4 Targeted Protein Degradation Market Size & Forecast, By End User, 2021 – 2032

  9.4.6.5 Australia

   9.4.6.5.1 Targeted Protein Degradation Market Size & Forecast, By Therapeutic Area, 2021 – 2032

   9.4.6.5.2 Targeted Protein Degradation Market Size & Forecast, By Application, 2021 – 2032

   9.4.6.5.3 Targeted Protein Degradation Market Size & Forecast, By Type, 2021 – 2032

   9.4.6.5.4 Targeted Protein Degradation Market Size & Forecast, By End User, 2021 – 2032

  9.4.6.6 ASEAN Countries

   9.4.6.6.1 Targeted Protein Degradation Market Size & Forecast, By Therapeutic Area, 2021 – 2032

   9.4.6.6.2 Targeted Protein Degradation Market Size & Forecast, By Application, 2021 – 2032

   9.4.6.6.3 Targeted Protein Degradation Market Size & Forecast, By Type, 2021 – 2032

   9.4.6.6.4 Targeted Protein Degradation Market Size & Forecast, By End User, 2021 – 2032

  9.4.6.7 Rest of Asia-Pacific

   9.4.6.7.1 Targeted Protein Degradation Market Size & Forecast, By Therapeutic Area, 2021 – 2032

   9.4.6.7.2 Targeted Protein Degradation Market Size & Forecast, By Application, 2021 – 2032

   9.4.6.7.3 Targeted Protein Degradation Market Size & Forecast, By Type, 2021 – 2032

   9.4.6.7.4 Targeted Protein Degradation Market Size & Forecast, By End User, 2021 – 2032

9.5 Latin America

 9.5.1 Key Trends

 9.5.2 Targeted Protein Degradation Market Size & Forecast, By Therapeutic Area, 2021 – 2032

 9.5.3 Targeted Protein Degradation Market Size & Forecast, By Application, 2021 – 2032

 9.5.4 Targeted Protein Degradation Market Size & Forecast, By Type, 2021 – 2032

 9.5.5 Targeted Protein Degradation Market Size & Forecast, By End User, 2021 – 2032

 9.5.6 Targeted Protein Degradation Market Size & Forecast, By Country, 2021 – 2032

  9.5.6.1 Brazil

   9.5.6.1.1 Targeted Protein Degradation Market Size & Forecast, By Therapeutic Area, 2021 – 2032

   9.5.6.1.2 Targeted Protein Degradation Market Size & Forecast, By Application, 2021 – 2032

   9.5.6.1.3 Targeted Protein Degradation Market Size & Forecast, By Type, 2021 – 2032

   9.5.6.1.4 Targeted Protein Degradation Market Size & Forecast, By End User, 2021 – 2032

  9.5.6.2 Argentina

   9.5.6.2.1 Targeted Protein Degradation Market Size & Forecast, By Therapeutic Area, 2021 – 2032

   9.5.6.2.2 Targeted Protein Degradation Market Size & Forecast, By Application, 2021 – 2032

   9.5.6.2.3 Targeted Protein Degradation Market Size & Forecast, By Type, 2021 – 2032

   9.5.6.2.4 Targeted Protein Degradation Market Size & Forecast, By End User, 2021 – 2032

  9.5.6.3 Mexico

   9.5.6.3.1 Targeted Protein Degradation Market Size & Forecast, By Therapeutic Area, 2021 – 2032

   9.5.6.3.2 Targeted Protein Degradation Market Size & Forecast, By Application, 2021 – 2032

   9.5.6.3.3 Targeted Protein Degradation Market Size & Forecast, By Type, 2021 – 2032

   9.5.6.3.4 Targeted Protein Degradation Market Size & Forecast, By End User, 2021 – 2032

  9.5.6.4 Colombia

   9.5.6.4.1 Targeted Protein Degradation Market Size & Forecast, By Therapeutic Area, 2021 – 2032

   9.5.6.4.2 Targeted Protein Degradation Market Size & Forecast, By Application, 2021 – 2032

   9.5.6.4.3 Targeted Protein Degradation Market Size & Forecast, By Type, 2021 – 2032

   9.5.6.4.4 Targeted Protein Degradation Market Size & Forecast, By End User, 2021 – 2032

  9.5.6.5 Rest of Latin America

   9.5.6.5.1 Targeted Protein Degradation Market Size & Forecast, By Therapeutic Area, 2021 – 2032

   9.5.6.5.2 Targeted Protein Degradation Market Size & Forecast, By Application, 2021 – 2032

   9.5.6.5.3 Targeted Protein Degradation Market Size & Forecast, By Type, 2021 – 2032

   9.5.6.5.4 Targeted Protein Degradation Market Size & Forecast, By End User, 2021 – 2032

9.6 Middle East & Africa

 9.6.1 Key Trends

 9.6.2 Targeted Protein Degradation Market Size & Forecast, By Therapeutic Area, 2021 – 2032

 9.6.3 Targeted Protein Degradation Market Size & Forecast, By Application, 2021 – 2032

 9.6.4 Targeted Protein Degradation Market Size & Forecast, By Type, 2021 – 2032

 9.6.5 Targeted Protein Degradation Market Size & Forecast, By End User, 2021 – 2032

 9.6.6 Targeted Protein Degradation Market Size & Forecast, By Country, 2021 – 2032

  9.6.6.1 UAE

   9.6.6.1.1 Targeted Protein Degradation Market Size & Forecast, By Therapeutic Area, 2021 – 2032

   9.6.6.1.2 Targeted Protein Degradation Market Size & Forecast, By Application, 2021 – 2032

   9.6.6.1.3 Targeted Protein Degradation Market Size & Forecast, By Type, 2021 – 2032

   9.6.6.1.4 Targeted Protein Degradation Market Size & Forecast, By End User, 2021 – 2032

  9.6.6.2 Saudi Arabia

   9.6.6.2.1 Targeted Protein Degradation Market Size & Forecast, By Therapeutic Area, 2021 – 2032

   9.6.6.2.2 Targeted Protein Degradation Market Size & Forecast, By Application, 2021 – 2032

   9.6.6.2.3 Targeted Protein Degradation Market Size & Forecast, By Type, 2021 – 2032

   9.6.6.2.4 Targeted Protein Degradation Market Size & Forecast, By End User, 2021 – 2032

  9.6.6.3 Qatar

   9.6.6.3.1 Targeted Protein Degradation Market Size & Forecast, By Therapeutic Area, 2021 – 2032

   9.6.6.3.2 Targeted Protein Degradation Market Size & Forecast, By Application, 2021 – 2032

   9.6.6.3.3 Targeted Protein Degradation Market Size & Forecast, By Type, 2021 – 2032

   9.6.6.3.4 Targeted Protein Degradation Market Size & Forecast, By End User, 2021 – 2032

  9.6.6.4 Egypt

   9.6.6.4.1 Targeted Protein Degradation Market Size & Forecast, By Therapeutic Area, 2021 – 2032

   9.6.6.4.2 Targeted Protein Degradation Market Size & Forecast, By Application, 2021 – 2032

   9.6.6.4.3 Targeted Protein Degradation Market Size & Forecast, By Type, 2021 – 2032

   9.6.6.4.4 Targeted Protein Degradation Market Size & Forecast, By End User, 2021 – 2032

  9.6.6.5 South Africa

   9.6.6.5.1 Targeted Protein Degradation Market Size & Forecast, By Therapeutic Area, 2021 – 2032

   9.6.6.5.2 Targeted Protein Degradation Market Size & Forecast, By Application, 2021 – 2032

   9.6.6.5.3 Targeted Protein Degradation Market Size & Forecast, By Type, 2021 – 2032

   9.6.6.5.4 Targeted Protein Degradation Market Size & Forecast, By End User, 2021 – 2032

  9.6.6.6 Rest of Middle East & Africa

   9.6.6.6.1 Targeted Protein Degradation Market Size & Forecast, By Therapeutic Area, 2021 – 2032

   9.6.6.6.2 Targeted Protein Degradation Market Size & Forecast, By Application, 2021 – 2032

   9.6.6.6.3 Targeted Protein Degradation Market Size & Forecast, By Type, 2021 – 2032

   9.6.6.6.4 Targeted Protein Degradation Market Size & Forecast, By End User, 2021 – 2032

10. Competitive Landscape

 10.1 Key Players' Positioning

 10.2 Competitive Developments

  10.2.1 Key Strategies Adopted (%), By Key Players, 2024

  10.2.2 Year-Wise Strategies & Development, 2021 – 2025

  10.2.3 Number Of Strategies Adopted By Key Players, 2024

 10.3 Market Share Analysis, 2024

 10.4 Product/Service & Application Benchmarking

  10.4.1 Product/Service Specifications & Features By Key Players

  10.4.2 Product/Service Heatmap By Key Players

  10.4.3 Application Heatmap By Key Players

 10.5 Industry Start-Up & Innovation Landscape

 10.6 Key Company Profiles

10.6 Key Company Profiles

 10.6.1 Arvinas, Inc. 

  10.6.1.1 Company Overview & Snapshot

  10.6.1.2 Product/Service Portfolio

  10.6.1.3 Key Company Financials

  10.6.1.4 SWOT Analysis

 10.6.2 Kymera Therapeutics, Inc.

  10.6.2.1 Company Overview & Snapshot

  10.6.2.2 Product/Service Portfolio

  10.6.2.3 Key Company Financials

  10.6.2.4 SWOT Analysis

 10.6.3 Nurix Therapeutics, Inc.

  10.6.3.1 Company Overview & Snapshot

  10.6.3.2 Product/Service Portfolio

  10.6.3.3 Key Company Financials

  10.6.3.4 SWOT Analysis

 10.6.4 Foghorn Therapeutics, Inc.

  10.6.4.1 Company Overview & Snapshot

  10.6.4.2 Product/Service Portfolio

  10.6.4.3 Key Company Financials

  10.6.4.4 SWOT Analysis

 10.6.5 C4 Therapeutics, Inc. 

  10.6.5.1 Company Overview & Snapshot

  10.6.5.2 Product/Service Portfolio

  10.6.5.3 Key Company Financials

  10.6.5.4 SWOT Analysis

 10.6.6 Vividion Therapeutics, Inc.

  10.6.6.1 Company Overview & Snapshot

  10.6.6.2 Product/Service Portfolio

  10.6.6.3 Key Company Financials

  10.6.6.4 SWOT Analysis

 10.6.7 Bristol Myers Squibb (BMS)

  10.6.7.1 Company Overview & Snapshot

  10.6.7.2 Product/Service Portfolio

  10.6.7.3 Key Company Financials

  10.6.7.4 SWOT Analysis

 10.6.8 Novartis AG

  10.6.8.1 Company Overview & Snapshot

  10.6.8.2 Product/Service Portfolio

  10.6.8.3 Key Company Financials

  10.6.8.4 SWOT Analysis

 10.6.9 Pfizer Inc.

  10.6.9.1 Company Overview & Snapshot

  10.6.9.2 Product/Service Portfolio

  10.6.9.3 Key Company Financials

  10.6.9.4 SWOT Analysis

 10.6.10 Amgen Inc.

  10.6.10.1 Company Overview & Snapshot

  10.6.10.2 Product/Service Portfolio

  10.6.10.3 Key Company Financials

  10.6.10.4 SWOT Analysis

 10.6.11 Astellas Pharma Inc.

  10.6.11.1 Company Overview & Snapshot

  10.6.11.2 Product/Service Portfolio

  10.6.11.3 Key Company Financials

  10.6.11.4 SWOT Analysis

 10.6.12 Merck & Co., Inc.

  10.6.12.1 Company Overview & Snapshot

  10.6.12.2 Product/Service Portfolio

  10.6.12.3 Key Company Financials

  10.6.12.4 SWOT Analysis

 10.6.13 Sanofi S.A.

  10.6.13.1 Company Overview & Snapshot

  10.6.13.2 Product/Service Portfolio

  10.6.13.3 Key Company Financials

  10.6.13.4 SWOT Analysis

 10.6.14 Roche Holding AG

  10.6.14.1 Company Overview & Snapshot

  10.6.14.2 Product/Service Portfolio

  10.6.14.3 Key Company Financials

  10.6.14.4 SWOT Analysis

 10.6.15 GlaxoSmithKline (GSK)

  10.6.15.1 Company Overview & Snapshot

  10.6.15.2 Product/Service Portfolio

  10.6.15.3 Key Company Financials

  10.6.15.4 SWOT Analysis

 10.6.16 Evotec SE

  10.6.16.1 Company Overview & Snapshot

  10.6.16.2 Product/Service Portfolio

  10.6.16.3 Key Company Financials

  10.6.16.4 SWOT Analysis

 10.6.17 Ascendis Pharma A/S 

  10.6.17.1 Company Overview & Snapshot

  10.6.17.2 Product/Service Portfolio

  10.6.17.3 Key Company Financials

  10.6.17.4 SWOT Analysis

 10.6.18 Monte Rosa Therapeutics

  10.6.18.1 Company Overview & Snapshot

  10.6.18.2 Product/Service Portfolio

  10.6.18.3 Key Company Financials

  10.6.18.4 SWOT Analysis

 10.6.19 Kyowa Kirin Co., Ltd.

  10.6.19.1 Company Overview & Snapshot

  10.6.19.2 Product/Service Portfolio

  10.6.19.3 Key Company Financials

  10.6.19.4 SWOT Analysis

 10.6.20 Arrowhead Pharmaceuticals, Inc.

  10.6.20.1 Company Overview & Snapshot

  10.6.20.2 Product/Service Portfolio

  10.6.20.3 Key Company Financials

  10.6.20.4 SWOT Analysis

11. Analyst Recommendations

 11.1 SNS Insider Opportunity Map

 11.2 Industry Low-Hanging Fruit Assessment

 11.3 Market Entry & Growth Strategy

 11.4 Analyst Viewpoint & Suggestions On Market Growth

12. Assumptions

13. Disclaimer

14. Appendix

 14.1 List Of Tables

 14.2 List Of Figures

Key Segments: 

By Therapeutic Area

  • Oncology

  • Neurological Disorders

  • Immunological & Inflammatory Diseases

  • Infectious Diseases

By Application          

  • Drug Discovery

  • Therapy Development

By Type 

  • PROTAC

  • Molecular Glues

  • LYTACs

  • Others

By End User

  • Pharmaceutical & Biotechnology Companies

  • Academic & Research Institutes

  • Hospital & Clinical Laboratories

  • Others

Request for Segment Customization as per your Business Requirement: Segment Customization Request

Regional Coverage:

North America

  • US

  • Canada

Europe

  • Germany

  • UK

  • France

  • Italy

  • Spain

  • Russia

  • Poland

  • Rest of Europe

Asia Pacific

  • China

  • India

  • Japan

  • South Korea

  • ASEAN Countries

  • Australia

  • Rest of Asia Pacific

Latin America

  • Brazil

  • Argentina

  • Mexico

  • Colombia

  • Rest of Latin America

Middle East & Africa

  • UAE

  • Saudi Arabia

  • Qatar

  • Egypt

  • South Africa

  • Rest of Middle East & Africa

Request for Country Level Research Report: Country Level Customization Request 

Available Customization

With the given market data, SNS Insider offers customization as per the company’s specific needs. The following customization options are available for the report:

  • Detailed Volume Analysis

  • Criss-Cross segment analysis (e.g., Product X Application)

  • Competitive Product Benchmarking

  • Geographic Analysis

  • Additional countries in any of the regions

  • Customized Data Representation

  • Detailed analysis and profiling of additional market players

An accurate research report requires proper strategizing as well as implementation. There are multiple factors involved in the completion of good and accurate research report and selecting the best methodology to compete the research is the toughest part. Since the research reports we provide play a crucial role in any company’s decision-making process, therefore we at SNS Insider always believe that we should choose the best method which gives us results closer to reality. This allows us to reach at a stage wherein we can provide our clients best and accurate investment to output ratio.

Each report that we prepare takes a timeframe of 350-400 business hours for production. Starting from the selection of titles through a couple of in-depth brain storming session to the final QC process before uploading our titles on our website we dedicate around 350 working hours. The titles are selected based on their current market cap and the foreseen CAGR and growth.


The 5 steps process:

Step 1: Secondary Research:

Secondary Research or Desk Research is as the name suggests is a research process wherein, we collect data through the readily available information. In this process we use various paid and unpaid databases which our team has access to and gather data through the same. This includes examining of listed companies’ annual reports, Journals, SEC filling etc. Apart from this our team has access to various associations across the globe across different industries. Lastly, we have exchange relationships with various university as well as individual libraries.

Secondary Research

Step 2: Primary Research

When we talk about primary research, it is a type of study in which the researchers collect relevant data samples directly, rather than relying on previously collected data.  This type of research is focused on gaining content specific facts that can be sued to solve specific problems. Since the collected data is fresh and first hand therefore it makes the study more accurate and genuine.

We at SNS Insider have divided Primary Research into 2 parts.

Part 1 wherein we interview the KOLs of major players as well as the upcoming ones across various geographic regions. This allows us to have their view over the market scenario and acts as an important tool to come closer to the accurate market numbers. As many as 45 paid and unpaid primary interviews are taken from both the demand and supply side of the industry to make sure we land at an accurate judgement and analysis of the market.

This step involves the triangulation of data wherein our team analyses the interview transcripts, online survey responses and observation of on filed participants. The below mentioned chart should give a better understanding of the part 1 of the primary interview.

Primary Research

Part 2: In this part of primary research the data collected via secondary research and the part 1 of the primary research is validated with the interviews from individual consultants and subject matter experts.

Consultants are those set of people who have at least 12 years of experience and expertise within the industry whereas Subject Matter Experts are those with at least 15 years of experience behind their back within the same space. The data with the help of two main processes i.e., FGDs (Focused Group Discussions) and IDs (Individual Discussions). This gives us a 3rd party nonbiased primary view of the market scenario making it a more dependable one while collation of the data pointers.

Step 3: Data Bank Validation

Once all the information is collected via primary and secondary sources, we run that information for data validation. At our intelligence centre our research heads track a lot of information related to the market which includes the quarterly reports, the daily stock prices, and other relevant information. Our data bank server gets updated every fortnight and that is how the information which we collected using our primary and secondary information is revalidated in real time.

Data Bank Validation

Step 4: QA/QC Process

After all the data collection and validation our team does a final level of quality check and quality assurance to get rid of any unwanted or undesired mistakes. This might include but not limited to getting rid of the any typos, duplication of numbers or missing of any important information. The people involved in this process include technical content writers, research heads and graphics people. Once this process is completed the title gets uploader on our platform for our clients to read it.

Step 5: Final QC/QA Process:

This is the last process and comes when the client has ordered the study. In this process a final QA/QC is done before the study is emailed to the client. Since we believe in giving our clients a good experience of our research studies, therefore, to make sure that we do not lack at our end in any way humanly possible we do a final round of quality check and then dispatch the study to the client.