Global Facial Injectable Market Overview:
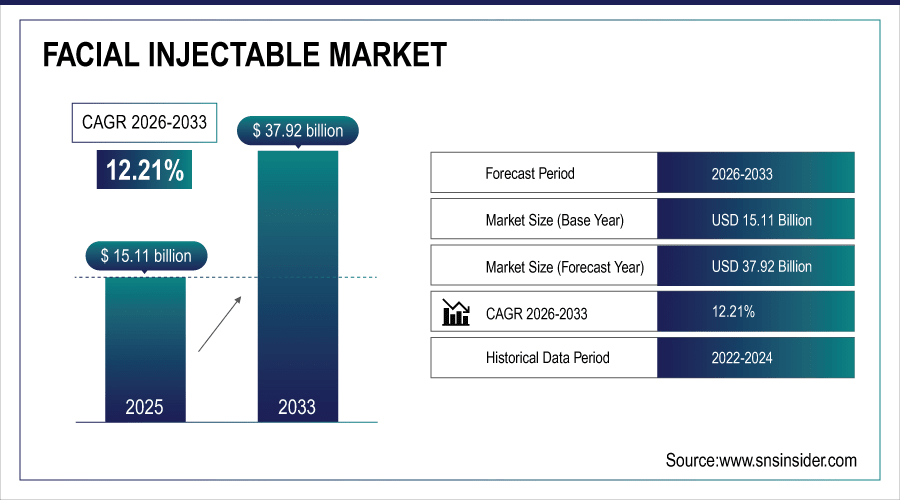
The global facial injectables market size is estimated at USD 15.11 billion in 2025 and is projected to reach USD 37.92 billion by 2033, growing at a CAGR of 12.21% during the forecast period 2026–2033.
The global facial injectables market is growing significantly with increasing demand for minimally invasive aesthetic procedure, 15 million botulinum toxin and dermal filler procedures are performed annually. Hyaluronic acid fillers contribute close to 45% of total procedures, whereas the most commonly used product is botulinum toxin. Rising penetration of medical spas, faster recovery times and the expanding aging population seeking anti-aging treatments will accelerate market adoption and long-term growth.
More than 15 million facial injectable procedures were performed globally in 2025, with minimally invasive aesthetics growing nearly 12% year-on-year.

To Get More Information On Facial Injectable Market - Request Free Sample Report
Facial Injectable Market Size and Forecast:
-
Market Size in 2025: USD 15.11 Billion
-
Market Size by 2033: USD 37.92 Billion
-
CAGR: 12.21% from 2026 to 2033
-
Base Year: 2025
-
Forecast Period: 2026–2033
-
Historical Data: 2022–2024
Facial Injectable Market Trends:
-
By 2033, more than 30% of facial injectable patients will be under 30 years old as preventative aesthetics drive early patient adoption.
-
In nearly 18% of all global facials aesthetics procedures in 2025 had injectables used as combination therapy, this will increase to more than 35% by the end of the forecast period.
-
Injectable services were available in approximately 40% of dermatology practices worldwide in 2025 and up to 65% by the year 2033 with further globalization.
-
Male patients comprised 12% of all injectable users in 2025 and are projected to rise to reach 20% by 2033.
-
Repeat procedures were 68% of treatments in 2025 and will rise to over 78% by 2033 because of maintenance cycles.
U.S. Facial Injectable Market Insights:
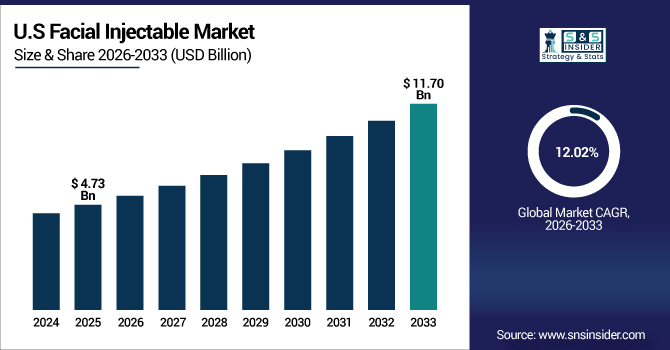
The U.S. Facial Injectable Market is estimated USD 4.73 billion in 2025 and is projected to reach USD 11.70 billion by 2033 at a 12.02% CAGR. Over 3.8 million treatments were performed in 2025, driven by high adoption of minimally invasive procedures and growing repeat treatments.

Facial Injectable Market Growth Drivers:
-
Preventive Aesthetics Among Younger Demographics Accelerates Market Growth for Facial Injectable Procedures.
Prophylactic aesthetics are shaking up the facial injectable market. Around the world, nearly 22% of injectable patients in 2025 were younger than 30 years old with women and men increasingly turning to “prejuvenation” and subtle improvements. By 2033, its share is expected to expand by over 30% changing the demand dynamics. Younger patients are spurring repeat treatments and are shaping product innovation, especially in the area of hyaluronic acid fillers designed for natural-looking age delaying results.
In 2026, hyaluronic acid fillers are projected to account for 48% of global injectable procedures, making them the fastest-growing product category.
Facial Injectable Market Restraints:
-
Short-Lived Results and Need for Repeat Treatments Restrain Long-Term Adoption of Facial Injectables.
Facial injectables encountered barriers to adoption because of their requirement for follow-up treatments. By 2025, 68% of treatments included post-treatment sessions at six and twelve months suggesting overall poor long-term effectiveness. The frequency may frighten off new users and lead drop-out rate of patients. Where average treatment intervals of 4–9 months per product type prevent mass market penetration, the need for more and maintenance treatments proves to be a factor in consumer acceptance as well as clinic schedules worldwide.
Facial Injectable Market Opportunities:
-
Increasing Adoption Among Younger Consumers Opens Significant Growth Potential for Facial Injectable Procedures Worldwide.
Rising popularity of facial injectibles among younger patients is a key expansion drive. In 2025, approximately 22% of the total global injectable agent pool was aged under 30 years old, indicating growing consumer interest in preventive aesthetics. This proportion will surpass 30% by 2033, driving a growing need for new products formulations and minimally invasive therapeutic options as well as the need for retreatments. This trend is likely to drive more clinic growth and expand international injectables platforms.
By 2026, preventive aesthetic procedures are projected to account for nearly 28% of all facial injectable treatments globally, driving market expansion.
Facial Injectable Market Segmentation Analysis:
-
By Product Type, Hyaluronic Acid (HA) Fillers held the largest market share of 45.32% in 2025, while Poly-L-Lactic Acid (PLLA) is expected to grow at the highest CAGR of 14.12%.
-
By Application, Wrinkle Reduction contributed the highest market share of 52.18% in 2025, while Lip Enhancement is anticipated to expand at the fastest CAGR of 13.76%.
-
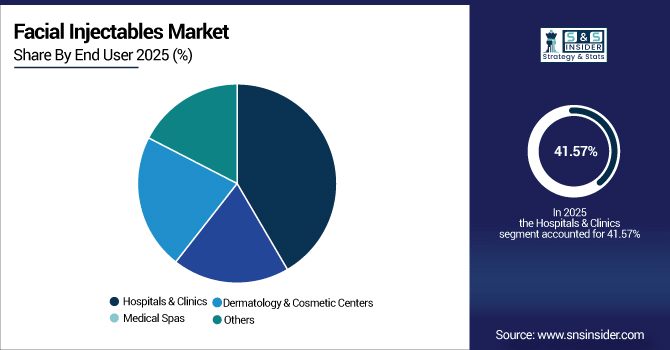
By End User, Hospitals & Clinics comprised 41.57% in 2025, while Medical Spas are projected to grow at the fastest CAGR of 13.45%.
By End User, Hospitals & Clinics Dominate While Medical Spas Grow Rapidly:
Hospitals and clinics are the leading provider type, conducting more than 6.2 million injectable procedures in 2025. Medical spas racked up just under 4.4 million treatments, a number anticipated to hit roughly 5.1 million by 2033. Growing access consumer demand for non-invasive aesthetic treatments, increased penetration outside the traditional physicians’ office setting, and a growing number of facilities with medical professionals is making fraxel available everywhere to increase market acceptance.

By Product Type, Hyaluronic Acid Fillers Dominate While Poly-L-Lactic Acid Grows Rapidly:
Fillers with hyaluronic acid (HA) were the most commonly used product with over 6.8 million procedures performed worldwide in 2025. Another injectable, poly-L-lactic acid (PLLA), known for its use in facial contouring and volume restoration was performed in almost 1.8 million procedures, and it is expected to hit over 2.5 million treatments by 2033. Advancements in longer lasting, natural appearing fillers continue to expand the market for a broad age range and treatment types.
By Application, Wrinkle Reduction Leads While Lip Enhancement Expands Fastest:
Wrinkle blast still reigned supreme in 2025, with more than 7.8 million procedures around the world. There were almost 1.9 million lip enhancement procedures in all in 2018 and the number is predicted to soar to more than 3.2 million by 2033. Increased publicity of non-invasive cosmetic options, preventative treatment for younger adults, as well as demand for more subtle alterations is fueling growth in all face injectable applications throughout the world.
Facial Injectable Market Regional Analysis:
North America Facial Injectable Market Insights:
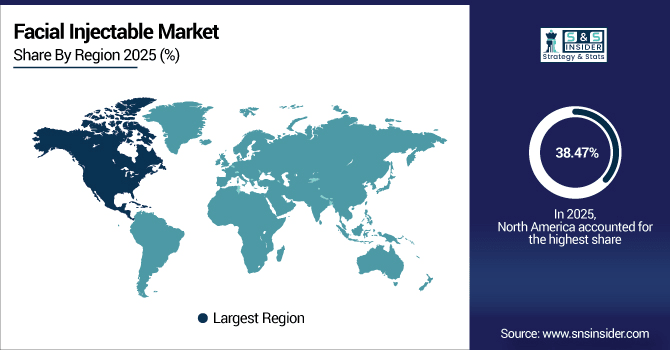
North America leads the global facial injectables market with a 38.47% share in 2025, driven by high adoption of minimally invasive aesthetic procedures and strong healthcare infrastructure. More than 5.8 million injectable procedures were performed in the region in 2025, including wrinkle reduction, lip augmentation, and facial shaping. The expanding coverage of medical spas and dermatology offices drove almost 3.2 million repeat procedures and keeps North America on track to widen its market through 2033.

Get Customized Report as Per Your Business Requirement - Enquiry Now
In 2025, there were over 4.1 million facial injectable procedures carried out in the United States which were supported by 1,050 dermatology clinics and medical spas. Increasing use in the younger generation, development of long-lasting hyaluronic acid fillers and a trend toward preventative aesthetics are fuelling robust demand and cementing the U.S. as the premier market for facial injectables.
Asia-Pacific Facial Injectable Market Insights:
The Asia-Pacific facial injectables market is projected to grow at a CAGR of 13.61% during 2026–2033, making it the fastest-growing region globally. In 2025, injections accounted for more than 2.6 million procedures like wrinkle reduction, lip augmentation and facial contouring included. The treatments were available at over 850 medical spas and dermatology clinics. Market growth is driven by the growing awareness of consumers, which results in increased disposable income and an increasing number of people opting for minimally invasive aesthetics, making the region a lucrative growth market.
Japan Facial Injectable Market Insights:
Japan is the largest structure market in Asia-Pacific for facial injectables including wrinkle, lip and face contouring with procedures over 1.1 million performed in 2025. Increase in consumer demand, high level of awareness about non-surgical aesthetics and well-established network of dermatology clinics & medical spas support swift adoption and market growth.
Europe Facial Injectable Market Insights:
Europe’s facial injectables market is witnessing strong growth, with over 1,250 licensed dermatology clinics and medical spas offering treatments in 2025. The largest number of such specialised institutions is in Germany, France and the United Kingdom (over 750 institutions between them). Rising interest from men and younger buyers, a spate of long-lasting fillers launches, and growth in the number of aesthetic-service outlets are all driving the evolvement of the market with Europe central to minimally-invasive cosmetic-procedure development.
Germany Facial Injectable Market Insights:
A dedicated dermatology clinic and medical spa market of more than 350 facilities to drive Europe’s facial injectables market in Germany by 2025. This is due to the country’s highly developed aesthetic infrastructure, strong consumer awareness and high uptake of non-invasive procedures. The development of long-lasting fillers, and preventive aesthetics contribute to Germany being the largest facial injectables market in Europe.
Latin America Facial Injectable Market Insights:
The Latin America facial injectables market is expanding steadily, with Brazil dominating the region, hosting over 520 dermatology clinics and medical spas in 2025. Mexico and Argentina come up next, due to rapid uptake of minimally invasive aesthetics, rising consumer consciousness and the emergence of long-lasting fillers. The increase in male and young patient population is also propelling market growth in the region.
Middle East and Africa Facial Injectable Market Insights:
The Middle East & Africa facial injectables market is growing steadily, with over 310 dermatology clinics and medical spas in 2025. Saudi Arabia tops regional penetration with integrated aesthetic infrastructure and South Africa is the second. The growth in the market is attributed to growing consumer knowledge, surge in minimally invasive treatments and proliferation of cosmetic service facilities within the region.
Facial Injectable Market Competitive Landscape:
Allergan Aesthetics leads the global facial injectables market with its widely recognized BOTOX® Cosmetic and JUVÉDERM filler portfolio. The company, which in 2025 sold more than 8 million injectable units globally, which are used for wrinkle reduction, lip enhancement and facial contouring. Its wide international distribution, brand loyalty and consistent new product introductions will continue to dominate in all the markets it serves.
-
In September 2025, launched the “Naturally You” campaign to educate consumers on safe, natural-looking hyaluronic acid fillers.
Galderma dominates facial injectables with its diverse hyaluronic acid-based fillers and botulinum toxin products. In 2025, it delivered over 5.5 million units in Europe, North America or the Asia-Pacific region. It focuses on R&D innovation, new minimally invasive aesthetic solutions and strategic partnerships with dermatology clinics and medical spas to strengthen its leadership and enables rapid market expansion throughout the world.
-
In March 2025, presented RELAX and EXPRESSION study data showing rapid onset and six-month patient satisfaction for Relfydess.
Ipsen also has a strong presence in the botulinum toxin field with Dysport®. 3.2 million in 2025, Dysport treatments for wrinkle reduction and other aesthetic treatments were performed worldwide. Ipsen´s emphasis on the effectiveness of its products, medical training and global marketing initiatives not only contribute to high adoption rates but also help it establish itself as a world-class facial injectables company.
-
In June 2025, started Phase II trials of LANT (IPN10200) for aesthetic and therapeutic botulinum toxin applications.
Facial Injectable Market Companies
-
AbbVie Inc. (Allergan Aesthetics)
-
Evolus, Inc.
-
Medytox, Inc.
-
Suneva Medical, Inc.
-
Sinclair Pharma
-
Bloomage Biotech
-
Anika Therapeutics, Inc.
-
Prollenium Medical Technologies Inc.
-
Hugel Inc.
-
Daewoong Pharmaceutical Co., Ltd.
-
Teoxane Laboratories
-
Laboratoires Filorga
-
Medycure
-
Revance Therapeutics, Inc.
-
Anika Therapeutics, Inc.
-
Bloomage Biotech
| Report Attributes | Details |
|---|---|
| Market Size in 2025 | USD 15.11 Billion |
| Market Size by 2033 | USD 37.92 Billion |
| CAGR | CAGR of 12.21% From 2026 to 2033 |
| Base Year | 2025 |
| Forecast Period | 2026-2033 |
| Historical Data | 2022-2024 |
| Report Scope & Coverage | Market Size, Segments Analysis, Competitive Landscape, Regional Analysis, DROC & SWOT Analysis, Forecast Outlook |
| Key Segments | • By Product Type (Botulinum Toxin, Dermal Fillers, Collagen, Hyaluronic Acid, Calcium Hydroxylapatite, Poly-L-Lactic Acid, PMMA Microspheres, Others) • By Application (Wrinkle Reduction, Facial Line Correction, Lip Enhancement, Facial Contouring, Scar Treatment, Others) • By End User (Hospitals & Clinics, Medical Spas, Dermatology & Cosmetic Centers, Others) |
| Regional Analysis/Coverage | North America (US, Canada), Europe (Germany, UK, France, Italy, Spain, Russia, Poland, Rest of Europe), Asia Pacific (China, India, Japan, South Korea, Australia, ASEAN Countries, Rest of Asia Pacific), Middle East & Africa (UAE, Saudi Arabia, Qatar, South Africa, Rest of Middle East & Africa), Latin America (Brazil, Argentina, Mexico, Colombia, Rest of Latin America). |
| Company Profiles | AbbVie Inc. (Allergan Aesthetics), Galderma S.A., Ipsen S.A., Merz Pharmaceuticals, Revance Therapeutics, Inc., Evolus, Inc., Medytox, Inc., Suneva Medical, Inc., Sinclair Pharma, Bloomage Biotech, Anika Therapeutics, Inc., Prollenium Medical Technologies Inc., Hugel Inc., Daewoong Pharmaceutical Co., Ltd., Teoxane Laboratories, Laboratoires Filorga, Medycure, Revance Therapeutics, Inc., Anika Therapeutics, Inc., Bloomage Biotech |

