Telecom Power System Market Report Scope & Overview:
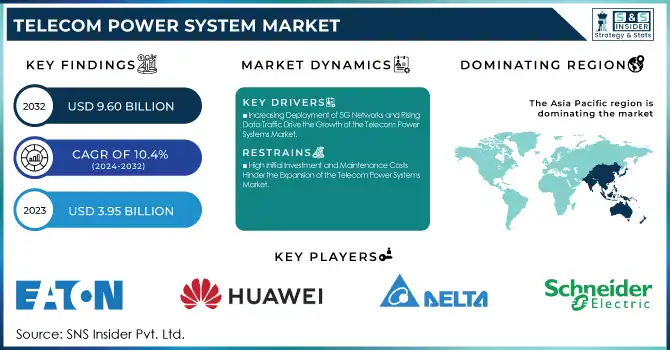
The Telecom Power System Market Size was valued at USD 3.95 Billion in 2023 and is expected to reach USD 9.60 Billion by 2032 and grow at a CAGR of 10.4% over the forecast period 2024-2032. The Market is driven by key factors such as market segmentation by power source highlighting the shift toward sustainable energy. Technology adoption trends, including smart grid solutions and energy-efficient rectifiers, indicate advancements. Capacity trends vary across off-grid, on-grid, and hybrid systems. Demand-supply analysis reflects increasing 5G deployment needs, while investment trends highlight financial growth. OPEX and CAPEX analysis reveal spending patterns, and failure rate studies assess reliability.
Get more information on Telecom Power System Market - Request Sample Report
Market Dynamics
Key Driver:
-
Increasing Deployment of 5G Networks and Rising Data Traffic Drive the Growth of the Telecom Power Systems Market
The rapid expansion of 5G networks worldwide is significantly increasing the demand for reliable telecom power systems. With the surge in data consumption, telecom operators require advanced power solutions to support high-speed connectivity, low latency, and massive network capacity. Additionally, the need for energy-efficient and sustainable power solutions is growing as telecom providers aim to reduce operational costs and carbon footprints. Governments and regulatory bodies are also supporting the deployment of telecom power systems with favorable policies, investments, and initiatives, further accelerating market growth. As a result, telecom power systems are becoming crucial for ensuring seamless connectivity and network performance.
Restraint
-
High Initial Investment and Maintenance Costs Hinder the Expansion of the Telecom Power Systems Market
The telecom power systems market faces challenges due to the high costs associated with installation, infrastructure development, and ongoing maintenance. Advanced power solutions, such as hybrid and renewable energy-based telecom power systems, require substantial upfront investment, making adoption difficult for small and mid-sized telecom operators. Additionally, the expenses related to battery replacements, power equipment upgrades, and system monitoring add to the overall operational costs. Many telecom operators, especially in emerging economies, struggle with budget constraints, which limits large-scale deployment. These financial challenges can slow down the adoption of telecom power systems, restraining market growth despite rising demand for efficient telecom infrastructure.
Opportunity
-
Growing Adoption of Renewable Energy Solutions Creates Lucrative Growth Opportunities in the Telecom Power Systems Market
The increasing emphasis on sustainability and reducing carbon emissions is driving the adoption of renewable energy-based telecom power systems. Solar, wind, and hybrid energy solutions are gaining traction as telecom operators seek to lower operational costs and dependence on conventional power sources. Governments worldwide are introducing incentives, subsidies, and policies to encourage green energy integration in telecom infrastructure. Additionally, rural and off-grid areas present significant opportunities for solar and battery-powered telecom power systems. The ongoing shift toward eco-friendly power solutions is expected to open new revenue streams and drive innovation in the telecom power systems market.
Challenge
-
Ensuring Power Reliability and Network Stability in Remote and Harsh Environments Poses a Major Challenge for the Telecom Power Systems Market
Telecom power systems must operate efficiently in extreme conditions, including high temperatures, fluctuating power supply, and harsh weather conditions in remote regions. Power outages, grid failures, and unstable energy sources can disrupt network operations, affecting communication services and end-user experiences. Deploying reliable backup power solutions, such as advanced battery storage and hybrid power systems, requires extensive planning, cost investment, and technical expertise. Additionally, the need for continuous monitoring and maintenance in inaccessible locations adds complexity to telecom power system management. Overcoming these challenges is crucial for ensuring seamless network connectivity and uninterrupted telecom services.
Segment Analysis
By Type
In 2023, DC power systems commanded a substantial 63% share of the telecom power systems market, underscoring their critical role in ensuring reliable and efficient power supply for telecommunications infrastructure. These systems are essential for maintaining uninterrupted operations of telecom equipment, particularly in remote and off-grid locations. Leading companies have been actively innovating in this segment.
For instance, Huawei Technologies Co. has introduced advanced DC power solutions tailored for 5G networks, enhancing energy efficiency and reducing operational costs. Similarly, Eaton Corporation has expanded its DC power system offerings with modular designs that provide scalability and flexibility for telecom operators.
The Digital Electricity segment is experiencing a remarkable CAGR of 11.72% during the forecast period, reflecting its increasing adoption in the telecom power systems market. Digital electricity technology enables the transmission of high-voltage DC power over long distances using lightweight cabling, which is particularly advantageous for powering distributed telecom equipment and small cells in urban and rural deployments. Companies like VoltServer have been at the forefront, offering digital electricity solutions that provide safe and efficient power distribution for telecom applications.
By Component
In 2023, the generators segment held a significant 33% share of the telecom power systems market, underscoring its vital role in providing backup power to ensure uninterrupted telecommunications services, especially in regions with unstable power grids. Leading companies have been active in this segment, introducing innovative generator solutions tailored for telecom applications.
For instance, Cummins Inc. has developed advanced diesel generators designed for optimal performance in remote telecom sites, offering enhanced fuel efficiency and reduced emissions. Similarly, Caterpillar Inc. has expanded its product line with modular generator sets that provide scalable power solutions for telecom operators, ensuring reliability and ease of maintenance.
The inverters segment is projected to experience a substantial CAGR of 12% during the forecast period, highlighting its increasing importance in the telecom power systems market. Inverters are essential for converting DC power from renewable energy sources or batteries into AC power required by various telecom equipment. Companies like Huawei Technologies Co. have been at the forefront, launching high-efficiency inverters that integrate seamlessly with solar power systems, enabling telecom operators to harness renewable energy and reduce operational costs.
By Power Sources
In 2023, the Diesel-Battery segment accounted for 42% of the telecom power systems market, highlighting its critical role in ensuring reliable power supply for telecommunications infrastructure. Diesel-battery hybrid systems combine diesel generators with battery storage, providing a dependable backup power solution that ensures uninterrupted network operations, especially in regions with unstable power grids. Leading companies have been active in this segment, introducing innovative diesel-battery solutions tailored for telecom applications.
The Diesel-Solar segment is projected to experience the highest growth in the forecast period within the telecom power systems market. This growth can be attributed to the increasing emphasis on sustainable and eco-friendly power solutions in the telecom industry. The combination of diesel generators with solar panels allows for hybrid power systems that leverage both conventional and renewable energy sources.
By Grid Type
In 2023, the On-Grid segment held a significant 43% share of the telecom power systems market, underscoring its importance in providing reliable power to telecommunications infrastructure connected to stable electrical grids. On-grid power systems are essential for urban and suburban telecom operations, ensuring continuous energy supply for base stations, data centers, and other critical equipment. Leading companies have been active in this segment, introducing innovative solutions to enhance efficiency and reliability.
The Bad-Grid segment is projected to experience a substantial CAGR of 11.71% during the forecast period, reflecting its increasing importance in regions with unreliable or inconsistent power supply. Telecom operators in such areas require resilient power systems capable of maintaining network uptime despite grid instability.
Regional Analysis
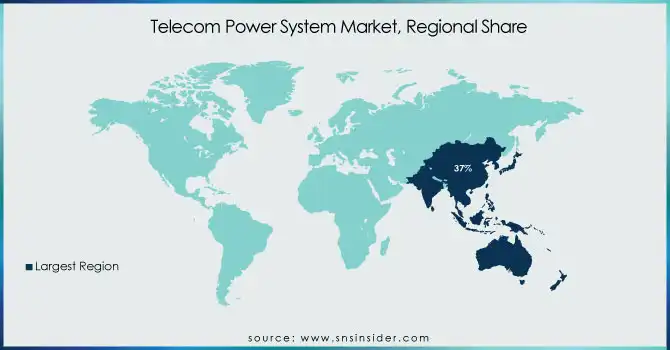
In 2023, the Asia Pacific region dominated the Telecom Power Systems Market, contributing more than 37% of the total revenue. This significant market share is primarily due to the rapid expansion of telecommunications infrastructure in countries like China and India, driven by increasing smartphone adoption and the rollout of 5G networks.
For example, China's aggressive 5G deployment strategy has led to a substantial demand for reliable power systems to support the new infrastructure. Similarly, India's Digital India initiative has accelerated the expansion of telecom services into rural areas, necessitating robust power solutions to ensure uninterrupted connectivity.
North America is the fastest-growing region in the Telecom Power Systems Market, with an estimated CAGR of 11.78% during the forecast period. This growth is fueled by the increasing adoption of advanced technologies and the expansion of telecom infrastructure to support high-speed data services.
For instance, the United States has seen significant investments in upgrading existing networks to 5G, requiring advanced power systems to maintain network reliability and efficiency.
Get Customized Report as per your Business Requirement - Request For Customized Report
Key Players
Some of the major players in the Telecom Power System Market are:
-
Eaton (Power Xpert Inverter System, Eaton 9395 UPS)
-
Huawei Technologies Co., Ltd. (Huawei Embedded Power, Huawei SmartLi UPS)
-
Cummins, Inc. (Cummins Diesel Generators, Cummins Hybrid Power Systems)
-
ZTE Corporation (ZTE Rectifier Power System, ZTE Telecom Energy Storage)
-
General Electric (GE Critical Power Rectifiers, GE UPS Systems)
-
Delta Electronics, Inc. (Delta DPR 2900B Rectifier, Delta Ultron DPS Series UPS)
-
Alpha Technologies (Alpha XM2-300HP Cable UPS, Alpha FXM 350 Power Inverter)
-
ABB (ABB PowerValue 11T G2 UPS, ABB PCS100 AVC Active Voltage Conditioner)
-
Station Ltd. (Staticon Telecom Power Rectifiers, Staticon DC Power Systems)
-
Schneider Electric (Galaxy VS UPS, Schneider Conext SW Inverter)
-
Ascot (Ascot Hybrid Power Systems, Ascot Diesel Generators)
Recent Trends
-
July 2024: ZTE assisted China Telecom in launching the world's first live single-wavelength 1.2Tbits hollow-core fiber transmission system. This innovation enabled a unidirectional capacity exceeding 100Tbits, enhancing ultra-high-speed data transmission for telecom networks.
-
April 2024: General Electric's power division spin-off was analyzed as a potential leader in the energy sector. The report highlighted its long-term growth prospects and ability to compete in the evolving power market, with a focus on renewable and grid modernization solutions.
| Report Attributes | Details |
|---|---|
| Market Size in 2023 | US$ 3.95 Billion |
| Market Size by 2032 | US$ 9.60 Billion |
| CAGR | CAGR of 10.4 % From 2024 to 2032 |
| Base Year | 2023 |
| Forecast Period | 2024-2032 |
| Historical Data | 2020-2022 |
| Report Scope & Coverage | Market Size, Segments Analysis, Competitive Landscape, Regional Analysis, DROC & SWOT Analysis, Forecast Outlook |
| Key Segments | • By Type (AC Power Systems, DC Power Systems, Digital Electricity) • By Grid Type (On-grid, Off-grid, Bad-grid) • By Power Source (Diesel-battery, Diesel-solar, Diesel-wind, Other Sources) • By Component (Rectifiers, Inverters, Controllers, Converters, Heat Management Systems, Generators, Others) |
| Regional Analysis/Coverage | North America (US, Canada, Mexico), Europe (Eastern Europe [Poland, Romania, Hungary, Turkey, Rest of Eastern Europe] Western Europe] Germany, France, UK, Italy, Spain, Netherlands, Switzerland, Austria, Rest of Western Europe]), Asia Pacific (China, India, Japan, South Korea, Vietnam, Singapore, Australia, Rest of Asia Pacific), Middle East & Africa (Middle East [UAE, Egypt, Saudi Arabia, Qatar, Rest of Middle East], Africa [Nigeria, South Africa, Rest of Africa], Latin America (Brazil, Argentina, Colombia, Rest of Latin America) |
| Company Profiles | Eaton, Huawei Technologies Co., Ltd., Cummins, Inc., ZTE Corporation, General Electric, Delta Electronics, Inc., Alpha Technologies, ABB, Station Ltd., Schneider Electric, Ascot |
Get in Touch
