Data Center Power Market Report Scope and Overview:
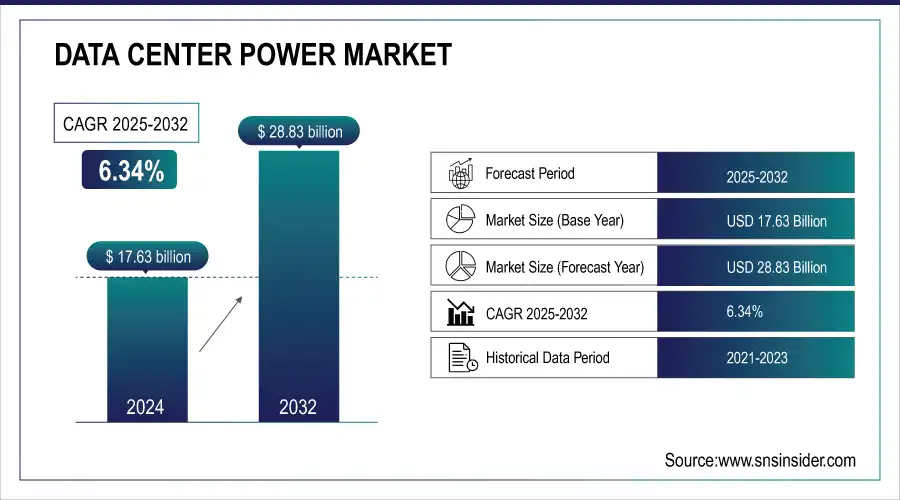
The Data Center Power Market Size was valued at USD 17.63 Billion in 2024 and is expected to reach USD 28.83 Billion by 2032, growing at a CAGR of 6.34% over the forecast period 2025-2032.
As businesses increasingly rely on cloud computing infrastructure and digital solutions, the demand for efficient power management in data centers has surged. The rapid growth of data generation has significantly influenced the data center power management market, as global data is projected to reach 200 zettabytes by 2025. Notably, 79% of small businesses currently store less than 50TB, while data stored in the cloud is expected to hit 100 zettabytes by the same year. With nearly 10,978 data centers globally, the industry has seen significant growth, data centers stored 1,500 exabytes of data in 2023, a substantial increase from 547 exabytes in 2018. The United States leads with 5,381 data centers, followed by Germany and the UK, highlighting the expanding data storage solutions landscape. This rapid increase in data volume, largely driven by IoT sensors and edge computing, underscores the necessity for businesses to adopt effective data storage solutions amid evolving technological advancements.
Get more information on Data Center Power Market - Request Sample Report
In the first five months of 2024, global investments in data center capacity expansion reached USD 22 billion. This momentum underscores the crucial role data centers play in the expanding digital economy, with North America and Europe leading the way in attracting investments. Notably, North America accounted for 69% of investments up to April 2024, while Europe saw a substantial rise to 29%, with over USD 7 billion invested. France and Italy are emerging as significant players in the European market, with France witnessing nearly USD 4 billion in investments and Italy attracting over USD 1 billion, primarily through the development of hyperscale data centers.
With the increasing demand for high-speed internet and mobile connectivity, telecom companies are investing heavily in data center infrastructure to support their networks. For instance, Singapore-based ST Telemedia Global Data Centers (STT GDC) has announced plans to invest USD 3.2 billion over the next five to six years to add 550MW to its data center capacity in India. These data centers require reliable power solutions to maintain uninterrupted service and ensure seamless connectivity for millions of users. Implementing advanced power management systems enables telecom operators to enhance their service reliability while effectively managing operational costs.
Data Center Power Market Drivers:
-
The rapid adoption of cloud computing services has significantly increased the demand for data centers.
Data center power is a highly in-demand segment, driven by the rising migration of organizations from different sectors to cloud solutions to increase their operational effectiveness and expandability. Currently, 96% of companies are utilizing the public cloud, while 84% are adopting private cloud solutions. As data continues to proliferate, it is estimated that by 2025, there will be an astonishing 200 zettabytes (a trillion gigabytes) of data globally. Around 94% of businesses reported enhanced security after migrating to the cloud, highlighting the compelling benefits of cloud adoption. In the case of cloud services, the demand for data center power is generated by the necessity to accommodate large-scale data storage, processing, and networking capabilities. Furthermore, providers need to guarantee robust power infrastructure to avoid downtime and failure. Thus, as businesses seek to migrate to the cloud, they need data center providers that will ensure effective power use while operating at the highest capacity. This trend is likely to continue in the following years, with substantial investments in the data center power sector. Cloud operators are also heavily concerned with sustainability both because it lowers operating costs and increases profitability and because of rising customer concerns regarding the ecological footprint of their digital services. Meanwhile, as other organizations are seeking to increase the effectiveness of their cloud strategies, the demand for more innovative power solutions will continue to expand, further increasing the growth of the data center power market.
-
The proliferation of data-intensive applications, such as AI/ML and big data analytics, is another critical driver of the Data Center Power Market.
These apps need significant computing power and storage capacity, resulting in higher energy usage in data centers. As companies aim to use data analytics for making well-informed decisions, the need for advanced solutions for data center power increases. Data centers need to offer high-performance computing (HPC) settings that are capable of managing the processing demands of AI and ML algorithms. Investments are made in advanced power systems to efficiently handle growing loads due to the demand for power scalability. Moreover, with sectors like healthcare, finance, and manufacturing embracing data-driven approaches, the significance of dependable and effective power solutions increases significantly. The increasing use of data-heavy apps requires ongoing improvements to power systems, driving market expansion.
Data Center Power Market Restraints:
-
Despite the industry's push for sustainability, data centers are still associated with significant energy consumption and carbon emissions.
With the growing focus on the environment, data center operators are under more scrutiny when it comes to their energy consumption and impact on the environment. Organizations face pressure to implement eco-friendly technologies and practices to reduce their environmental footprint. Nevertheless, the shift to more environmentally friendly energy options frequently demands substantial financial commitments and alterations to current systems. The difficulties linked to adopting eco-friendly measures may prevent companies from enhancing their data center power systems. Furthermore, the way data centers are viewed by the public as energy-intensive facilities can impede market expansion. Concerns about the environmental impact of expanding data center operations may cause companies to hesitate, as they could face heightened regulatory scrutiny and backlash from stakeholders.
Data Center Power Market Segmentation Analysis:
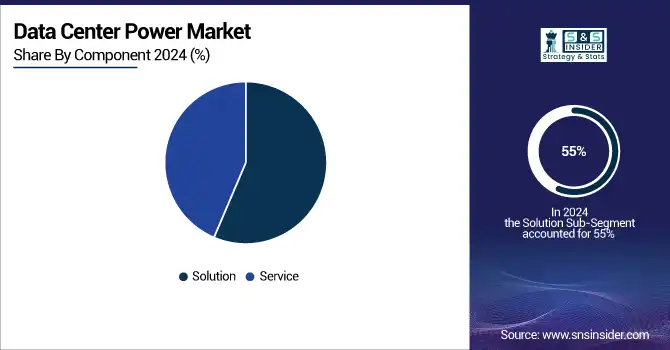
By Component
The Solution segment dominated the market in 2024 with over 55% market share. This consists of UPS, PDUs, and software for managing energy. As the demand for cloud services and big data analytics grows, data centers are also expanding, making efficient power management solutions essential. Schneider Electric and Eaton are top contenders in this sector, providing comprehensive solutions that improve energy efficiency, boost dependability and lower operating expenses.
The Service sector is expected to experience the fastest CAGR during 2025-2032, as data center operations become more complex and require specialized power system management. This part comprises advisory, setup, upkeep, and assistance services for power management solutions. With a focus on increasing uptime and operational efficiency, businesses are experiencing a growing demand for specialized services. For example, Vertiv offers various services that guarantee power systems function at their best, such as predictive maintenance and performance optimization.
By Data Centre
The large sized segment led the market in 2024 with over 48% market share, which is being pushed by the growing need for cloud computing, big data analytics, and enterprise applications. by making significant investments in cutting-edge cooling systems, backup power options, and energy-saving technologies, big data centers guarantee both uninterrupted operations and reduced energy expenses. Companies such as Amazon Web Services (AWS) and Microsoft Azure demonstrate this sector by utilizing large data center networks worldwide to back up their extensive cloud services.
The small size is to become the fastest-growing segment during 2025-2032. Small to medium-sized enterprises (SMEs) and organizations frequently prefer small data centers due to their cost-effective and energy-efficient nature, avoiding the necessity of expansive infrastructure. For instance, DigitalOcean and Linode target the small data center sector by providing customized cloud computing services for startups and SMEs, enabling them to expand effortlessly while ensuring top-notch performance.
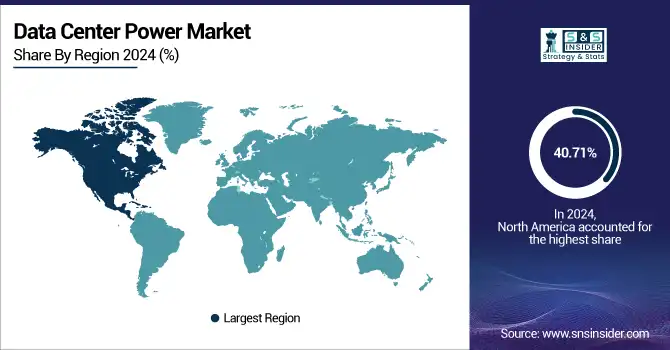
Data Center Power Market Regional Analysis:
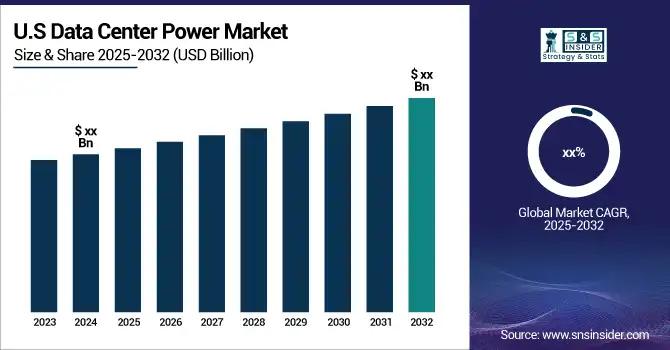
North America Data Center Power Market Trends:
North America dominated the market in 2024 with a 40.71% market share, due to substantial funding in cloud computing, big data analytics, and the Internet of Things (IoT). The existence of leading technology firms like Amazon Web Services, Microsoft, and Google stimulates a strong need for effective and trustworthy power solutions. Many data centers are starting to implement advanced power management systems to cut down on expenses and environmental impact. Equinix and Digital Realty are leading the way by adopting innovative technologies such as modular data centers and sustainable energy sources.
Get Customized Report as per your Business Requirement - Request For Customized Report
Asia-Pacific Data Center Power Market Trends:
APAC is anticipated to have the fastest growth rate during 2025-2032. Nations such as China, India, and Japan are experiencing an increase in the building of data centers to meet the expanding need for cloud services and online shopping. Significant investments in technology infrastructure are being made in the region, with Alibaba and Tencent at the forefront of developing high-capacity data centers with advanced power management solutions. NTT Communications, for instance, is dedicating funds to sustainable data centers to enhance energy efficiency.
Europe Data Center Power Market Trends:
Europe held a significant share in the data center power market in 2024, driven by rapid digital transformation, cloud adoption, and stringent energy efficiency regulations. Countries like Germany, the UK, and France are leading in investments toward sustainable and resilient data centers. Companies such as Deutsche Telekom and OVHcloud are pioneering the use of renewable energy, advanced cooling systems, and modular power infrastructure to reduce costs and environmental impact.
Latin America Data Center Power Market Trends:
Latin America is emerging as a growing market for data center power, supported by expanding cloud services, digital transformation in enterprises, and increased internet penetration. Brazil, Mexico, and Chile are leading the adoption of modern data center technologies. Companies such as ODATA and UOL Diveo are investing in reliable power infrastructure, sustainable energy solutions, and advanced monitoring systems to ensure uptime and energy efficiency.
Middle East & Africa (MEA) Data Center Power Market Trends:
The MEA region is witnessing steady growth in data center power demand due to increased cloud adoption, smart city initiatives, and digital government programs. The UAE, Saudi Arabia, and South Africa are investing in large-scale data centers to support regional connectivity and enterprise services. Key players like Etisalat and Dimension Data are adopting energy-efficient power management systems, hybrid power sources, and modular designs to meet the rising demand while reducing operational costs.
Data Center Power Market Key Players:
-
Schneider Electric (APC Smart-UPS, EcoStruxure IT)
-
Vertiv (Liebert GXT5 UPS, Vertiv VRC-S)
-
Eaton (Eaton 9PX UPS, Eaton 93PM UPS)
-
Siemens (Siemens SIVACON S8, Siemens SITOP PSU6200)
-
Emerson Network Power (Liebert APM, Emerson Network Power UPS)
-
ABB (ABB Ability Energy Management, ABB Uninterruptible Power Supply)
-
Riello UPS (Riello Sentinel Pro, Riello Sentinel Dual)
-
General Electric (GE) (GE Digital Energy UPS, GE Critical Power Solutions)
-
Legrand (Legrand UPS, Legrand PDUs)
-
CyberPower Systems (CyberPower PFC Sinewave UPS, CyberPower Smart App Sinewave)
-
Tripp Lite (Tripp Lite SmartPro UPS, Tripp Lite PDUs)
-
Delta Electronics (Delta UPS Series, Delta Inverters)
-
Toshiba (Toshiba UPS Systems, Toshiba Power Systems)
-
Nokia (Nokia 7750 SR, Nokia 1830 PSS)
-
Honeywell (Honeywell UPS, Honeywell Power Distribution Units)
-
Kstar (Kstar E-Series UPS, Kstar Modular UPS)
-
Ametek (Ametek Power Control, Ametek Power Solutions)
-
S&C Electric Company (S&C PureWave UPS, S&C Vista Underground Distribution)
-
Huawei (Huawei UPS5000, Huawei FusionPower)
-
Mitsubishi Electric (Mitsubishi UPS, Mitsubishi Power Distribution Units)
Suppliers of Raw Materials/Components
-
NVIDIA
-
Intel
-
Texas Instruments
-
Analog Devices
-
Infineon Technologies
-
Qualcomm
-
Microchip Technology
-
Broadcom
-
ON Semiconductor
-
Maxim Integrated
Data Center Power Market Competitive Landscape:
IBM Established in 1911, IBM is a global technology leader offering cloud computing, AI, quantum computing, hardware, software, and consulting services to help businesses optimize operations, enhance cybersecurity, and drive digital transformation worldwide.
-
October 2024: IBM, together with German Chancellor Olaf Scholz, senior European government officials, and European-based global enterprises, unveiled today the first IBM Quantum Data Center outside of the United States.
Rustomjee Group Established in 1969, Rustomjee Group is an Indian real estate developer specializing in residential and commercial projects, including luxury apartments, townships, and integrated communities. The company focuses on quality construction, sustainable development, and delivering modern lifestyle solutions across key cities in India.
-
May 2024: The Rustomjee Group is planning to make its debut in the data centers and plotted development businesses.
Actis Established in 2004, Actis is a leading global private equity firm focused on emerging markets. The company invests in energy, real estate, and infrastructure projects, aiming to deliver sustainable growth and long-term value while promoting responsible investment practices and driving positive social and environmental impact.
-
June 2024: Actis, the leading global investor in sustainable infrastructure, announced the launch of Epoch Digital Asia, a pioneering integrated data center platform in Asia, which has a c.200MW IT capacity. Currently, the project has three projects where development is underway and is ready for acquisitions, as well as a substantial pipeline.
Microsoft Established in 1975, Microsoft is a global technology company specializing in software, cloud computing, AI, hardware, and enterprise solutions. It develops products like Windows, Office, Azure, and Surface, empowering individuals and organizations worldwide to enhance productivity, drive innovation, and accelerate digital transformation.
-
June 2024: Microsoft has announced the launch of the first cloud region in Spain with two data center locations in the Community de Madrid, from which it will provide companies and public institutions from Spain and the rest of Europe with Artificial Intelligence and cloud services and solutions.
| Report Attributes | Details |
|---|---|
| Market Size in 2024 | USD 17.63 Billion |
| Market Size by 2032 | USD 28.83 Billion |
| CAGR | CAGR of 6.34% From 2024 to 2032 |
| Base Year | 2024 |
| Forecast Period | 2025-2032 |
| Historical Data | 2021-2023 |
| Report Scope & Coverage | Market Size, Segments Analysis, Competitive Landscape, Regional Analysis, DROC & SWOT Analysis, Forecast Outlook |
| Key Segments | • By Component (Solution, Service) • By Data Centre (Small Size, Medium Size, Large Size) • By End User (IT & Telecommunication, BFSI, Government, Power & Energy) |
| Regional Analysis/Coverage | North America (US, Canada), Europe (Germany, UK, France, Italy, Spain, Russia, Poland, Rest of Europe), Asia Pacific (China, India, Japan, South Korea, Australia, ASEAN Countries, Rest of Asia Pacific), Middle East & Africa (UAE, Saudi Arabia, Qatar, South Africa, Rest of Middle East & Africa), Latin America (Brazil, Argentina, Mexico, Colombia, Rest of Latin America). |
| Company Profiles | Schneider Electric, Vertiv, Eaton, Siemens, Emerson Network Power, ABB, Riello UPS, General Electric, Legrand, CyberPower Systems, Tripp Lite, Delta Electronics, Toshiba, Nokia, Honeywell, Kstar, Ametek, S&C Electric Company, Huawei, Mitsubishi Electric |
Frequently Asked Questions
Ans: North America dominated the Data Center Power Market in 2024.
Ans: The Solutions segment dominated the Data Center Power Market.
Ans: The Data Center Power Market is expected to grow at a CAGR of 6.34% during 2025-2032.
Ans: The rapid adoption of cloud computing services has significantly increased the demand for data centers.
Ans: The Data Center Power Market was USD 17.63 Billion in 2024 and is expected to Reach USD 28.72 Billion by 2032.
Get in Touch
