Total Organic Carbon (TOC) Analyzer Market Report Scope & Overview:
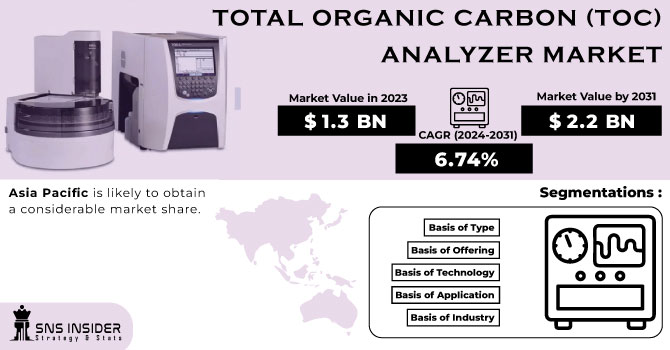
The Total Organic Carbon (TOC) Analyzer Market size was valued at USD 1.4 Bn in 2025E and is expected to reach USD 2.33 Bn by 2033 and grow at a CAGR of 6.74% over the forecast period 2026-2033.
Water purity is critical in a variety of sectors, including semiconductor manufacturing, power generation, and pharmaceuticals. Organic chemicals and other microbes present in the water can cause storage, filtration, and other components and systems to fail. When this sort of polluted water is not filtered, the substances in the water can cause severe problems, ranging from industrial system damage to product quality issues, jeopardizing the organization's overall profitability. The purity of water is crucial in a variety of sectors, including pharmaceutical and semiconductor production, as well as power generation.
Total Organic Carbon (TOC) Analyzer Market Size and Forecast:
-
Market Size in 2025E: USD 1.4 Billion
-
Market Size by 2033: USD 2.33 Billion
-
CAGR: 6.74% from 2026 to 2033
-
Base Year: 2025
-
Forecast Period: 2026–2033
-
Historical Data: 2022–2024
To get more information on Total Organic Carbon (TOC) Analyzer Market - Request Free Sample Report
Total Organic Carbon (TOC) Analyzer Market Key Trends:
-
Technological advancements – Development of more efficient, user-friendly, and automated TOC analyzers is driving increased adoption across industries.
-
Stringent environmental regulations – Governments worldwide are enforcing stricter water quality standards, fueling demand for precise TOC monitoring.
-
Rising industrial applications – Industries requiring high-purity water, such as pharmaceuticals, semiconductors, and food & beverages, are boosting market growth.
-
Shift toward online monitoring – Increasing use of online and real-time TOC analyzers in water and wastewater treatment facilities enhances operational efficiency.
-
Growing emphasis on sustainability – Organizations are investing in TOC analyzers to ensure compliance with sustainability initiatives and reduce environmental impact.
-
Market expansion in emerging regions – Increasing industrialization and water treatment infrastructure in Asia-Pacific and Latin America are supporting TOC analyzer adoption.
The U.S. Total Organic Carbon (TOC) Analyzer market size was valued at an estimated USD 0.58 billion in 2025 and is projected to reach USD 0.98 billion by 2033, growing at a CAGR of 6.1% over the forecast period 2026–2033. Market growth is driven by stringent regulatory requirements for water quality monitoring across pharmaceutical, biotechnology, environmental, and food & beverage industries. Increasing focus on contamination control, process validation, and compliance with standards set by regulatory bodies such as the EPA and FDA is accelerating adoption of TOC analyzers. Additionally, rising investments in water treatment infrastructure, technological advancements in real-time and automated TOC measurement systems, and growing demand from laboratory and industrial applications further strengthen the growth outlook of the U.S. TOC analyzer market during the forecast period.
Total Organic Carbon (TOC) Analyzer Market Drivers:
-
Growing Industrial and Pharmaceutical Water Purity Requirements Drive Total Organic Carbon (TOC) Analyzer Market Growth.
The rising need for ultrapure water in pharmaceutical, semiconductor, and food & beverage industries is driving the demand for Total Organic Carbon (TOC) analyzers. Stringent regulatory standards and quality benchmarks require precise monitoring of organic carbon content in water to ensure product safety and process reliability. This demand leads to technological advancements and increased adoption of automated and online TOC analyzers that can provide real-time data, enhance operational efficiency, and reduce human error. The effect of stricter compliance and higher production quality demands is a sustained growth trajectory for TOC analyzers globally. Additionally, emerging markets with growing industrialization are increasingly investing in water treatment infrastructure, creating further opportunities. Overall, industries adopting TOC analyzers experience improved process control, environmental compliance, and operational optimization, driving consistent market expansion and fostering continuous innovation in analyzer technology.
Example: In March 2023, Shimadzu Corporation launched the TOC-L series with enhanced online monitoring capabilities, enabling pharmaceutical manufacturers to ensure water purity and comply with USP <643> standards efficiently.
Total Organic Carbon (TOC) Analyzer Market Restraints:
-
High Capital Cost of Advanced TOC Analyzers Restrains Market Growth in Small and Medium Enterprises Globally
The high cost associated with advanced Total Organic Carbon (TOC) analyzers limits adoption, particularly among small and medium-sized enterprises. Sophisticated TOC systems with automated, online, and high-throughput capabilities involve significant capital expenditure, making it challenging for budget-constrained organizations to invest. The effect of these financial barriers is slower market penetration in cost-sensitive regions, where manual or low-cost alternatives are often preferred. This restraint inhibits the growth potential in emerging economies and smaller industries, delaying the adoption of technologically advanced analyzers. Additionally, ongoing maintenance, calibration, and consumable costs further increase the total cost of ownership. Consequently, the high investment requirement creates a barrier, influencing procurement decisions, and restricting access to precise TOC monitoring solutions, despite their benefits for regulatory compliance and operational efficiency.
Example: In 2022, several mid-sized food processing companies in Latin America delayed upgrading to automated TOC analyzers due to upfront costs exceeding $50,000, opting for manual methods instead.
Total Organic Carbon (TOC) Analyzer Market Oppertunities:
-
Increasing Adoption of Online and Real-Time TOC Monitoring Presents Significant Market Opportunities
The shift toward online and real-time Total Organic Carbon (TOC) monitoring presents a significant opportunity, as industries increasingly seek continuous, accurate, and remote water quality analysis. This adoption allows for immediate corrective actions, reduces downtime, enhances compliance with environmental and safety regulations, and minimizes manual sampling errors. The effect of integrating cloud connectivity and IoT-enabled analytics is an improvement in operational efficiency and process optimization, leading to cost savings and enhanced data management. With environmental regulations becoming stricter, organizations can proactively meet compliance standards while simultaneously gaining insights into water treatment and industrial processes. The rising interest in digital solutions and remote monitoring further drives the deployment of advanced TOC analyzers, especially in large-scale pharmaceutical, semiconductor, and chemical manufacturing facilities, opening new revenue streams for manufacturers and encouraging innovation in connected instrumentation.
Total Organic Carbon (TOC) Analyzer Market Segmentation Analysis:
By Type, Laboratory (Benchtop) TOC Analyzers Lead While Online TOC Analyzers Record the Fastest Growth
In 2025, laboratory (benchtop) TOC analyzers dominated and held the largest share of approximately 47% in the TOTAL ORGANIC CARBON (TOC) ANALYZER MARKET. Their prominence is attributed to high accuracy, ease of use, and the ability to handle diverse liquid and solid samples efficiently. These analyzers are widely adopted in pharmaceutical, food & beverage, and chemical laboratories for quality control, regulatory compliance, and research purposes. For example, benchtop models equipped with automated sampling and high-sensitivity detection enable precise measurement of organic carbon, ensuring consistent compliance with environmental and industrial standards. The combination of reliability and versatility explains the leading market share of laboratory analyzers in this segment. The online TOC analyzers segment is growing at the highest CAGR of 13.66% within the forecast period 2026-2033, driven by the rising demand for real-time water quality monitoring in industrial and municipal applications. These analyzers facilitate continuous measurement, process optimization, and early detection of organic contamination, reducing operational downtime and improving compliance with regulatory standards. For instance, online TOC systems installed in wastewater treatment plants allow automated, 24/7 monitoring of effluent quality, ensuring discharge meets environmental guidelines. This continuous monitoring capability fuels the expansion of the online TOC analyzer segment in the total organic carbon (TOC) analyzer market.
By Technology, High-Temperature Catalytic Oxidation Dominates While Persulfate-UV Oxidation Emerges as the Fastest Growing Segment
In 2025, the high-temperature catalytic oxidation (HTCO) segment led the total organic carbon (TOC) analyzer market, capturing approximately 53% of the revenue share. HTCO analyzers are preferred for their precise measurement, fast oxidation rates, and ability to process diverse water and wastewater samples efficiently. Continuous technological improvements, including advanced catalysts and automated control systems, have reduced errors and enhanced operational reliability. For example, HTCO analyzers are commonly deployed in pharmaceutical water systems to ensure compliance with stringent TOC limits, highlighting their critical role in regulatory and quality assurance processes. The persulfate-ultraviolet oxidation segment is projected to grow at the highest CAGR of 13.71% during the forecast period, driven by its effectiveness in analyzing complex matrices with minimal interference. Innovations in UV lamps and persulfate reagents have enhanced sensitivity and reproducibility, making the technology attractive for industrial and environmental applications. For instance, persulfate-UV analyzers are increasingly used in wastewater and surface water monitoring to detect trace levels of organic carbon, ensuring compliance with environmental regulations. This technological advantage supports the growing adoption of persulfate-ultraviolet oxidation within the total organic carbon (TOC) analyzer market.
By Application, Liquid Sample Analysis Leads While Solid Sample Analysis Records the Fastest Growth
In 2025, the liquid sample analysis segment dominated the total organic carbon (TOC) analyzer market, accounting for approximately 47% of the market. its dominance stems from high demand in water, wastewater, and industrial effluent testing, where accurate carbon measurement is critical for compliance and process control. advanced analyzers enable automated sampling and real-time monitoring, reducing human error and improving operational efficiency. for example, liquid TOC analyzers are widely used in pharmaceutical and chemical manufacturing plants to ensure water quality and regulatory compliance, reinforcing the segment’s leading market position. The solid sample analysis segment is projected to grow at the highest CAGR in the total organic carbon (TOC) analyzer market, fueled by increasing testing of soils, sediments, and industrial solids. Enhanced sample preparation and digestion methods have improved throughput and accuracy, driving adoption in environmental monitoring and research. For instance, solid TOC analyzers are increasingly deployed in agricultural soil testing to measure organic carbon content, aiding sustainability and crop productivity. This growing need for accurate solid sample analysis supports the rapid expansion of this segment within the total organic carbon (TOC) analyzer market.
By End-User Industry, Pharmaceuticals Hold the Largest Share While Chemical Manufacturing Expands at the Fastest Pace
The pharmaceuticals segment led the total organic carbon (TOC) analyzer market in 2025, capturing around 53% revenue share due to stringent regulatory standards and the critical need for water and drug purity monitoring. Toc analyzers ensure precise detection of organic contaminants, supporting safety and compliance in drug production. For example, pharmaceutical facilities utilize benchtop and online TOC analyzers to continuously monitor water for injection (WFI) systems, guaranteeing adherence to usp and EP standards. The critical role of toc analyzers in quality assurance underscores the segment’s dominant market position. The chemical manufacturing segment is growing at the highest CAGR in the total organic carbon (TOC) analyzer market, driven by the need for process efficiency, contamination control, and regulatory compliance. Online and portable TOC analyzers allow real-time monitoring and rapid corrective action, reducing waste and operational risks. For example, chemical plants deploy TOC analyzers in wastewater streams to maintain effluent quality and meet local environmental regulations. This increasing adoption highlights the segment’s potential for high growth within the total organic carbon (TOC) analyzer market.
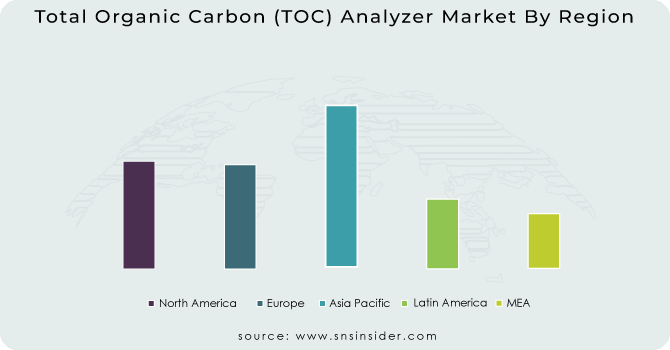
Total Organic Carbon (TOC) Analyzer Market Regional Analysis
North America dominates the TOC analyzer market in 2025
In 2025, North America holds an estimated 38% share of the Total Organic Carbon (TOC) analyzer market, driven by rigorous environmental regulations, extensive pharmaceutical and semiconductor manufacturing, and widespread adoption of online monitoring technologies. Strong regulatory frameworks and quality standards compel utilities and industries to deploy TOC analyzers for compliance and process control. Advanced laboratory infrastructure, high R&D investment, and a large installed base of continuous monitoring systems further reinforce demand. Together, these factors sustain North America’s leadership and support ongoing upgrades to automated and cloud-connected TOC solutions.
-
United States leads North America’s TOC analyzer market
The U.S. dominates due to its large pharmaceutical, semiconductor, and water-treatment sectors that require ultrapure and compliant water. Strict EPA and pharmacopeial standards, coupled with substantial capital expenditure on monitoring and automation, drive adoption of benchtop, online, and portable TOC analyzers. U.S. laboratories and industrial plants prioritize real-time analytics and integration with plant control systems, prompting suppliers to offer advanced online, cloud-enabled, and AI-assisted TOC products. This strong demand, supported by a mature vendor ecosystem and frequent technology upgrades, cements the U.S. as the region’s primary revenue contributor.
Asia Pacific is the fastest-growing region in the TOC analyzer market in 2025
The Asia Pacific TOC analyzer market is projected to expand rapidly, with an estimated CAGR of 9.5% from 2026 to 2033, fueled by accelerating industrialization, expanding pharmaceutical and semiconductor production, and increasing investments in water treatment infrastructure. Governments and industries are prioritizing environmental monitoring and process quality, which drives procurement of both online and laboratory TOC analyzers. Cost-competitive local manufacturing and rising awareness of regulatory compliance further accelerate deployment across the region.
-
China leads Asia Pacific’s TOC analyzer market
China dominates Asia Pacific due to its vast manufacturing base in pharmaceuticals, chemicals, and semiconductors, along with intensified environmental enforcement and water-treatment projects. Rapid urbanization and industrial expansion increase demand for continuous TOC monitoring to meet discharge limits and ensure process quality. Local OEMs, combined with international suppliers, offer scalable online and portable solutions, enabling broad adoption across municipal and industrial sites. Government programs to modernize water infrastructure and strengthen pollution control bolster China’s leading position in the regional TOC market.
Europe TOC analyzer market insights, 2025
Europe shows steady growth in 2025, underpinned by strict environmental directives, strong pharmaceutical and chemical industries, and increasing adoption of automated water-quality monitoring. Investments in wastewater treatment upgrades and industrial compliance programs encourage deployment of online and benchtop TOC analyzers across utilities and manufacturing facilities. Cross-border standards and emphasis on sustainability continue to shape procurement priorities.
-
Germany leads Europe’s TOC analyzer market
Germany dominates Europe because of its advanced chemical and pharmaceutical sectors, stringent environmental regulations, and strong emphasis on measurement accuracy and process control. German manufacturers and utilities frequently upgrade monitoring systems to meet EU and national discharge standards, driving demand for high-performance TOC analyzers. The country’s robust engineering base and focus on quality assurance make it the primary contributor to Europe’s TOC analyzer revenue in 2024.
Middle East & Africa and Latin America TOC analyzer market insights, 2025
The TOC analyzer market in the Middle East & Africa and Latin America is experiencing moderate growth in 2024 as governments and industries increase investment in water treatment and environmental monitoring. In the Middle East, desalination plants and industrial projects in Saudi Arabia and the UAE spur demand for TOC monitoring. In Latin America, Brazil and Mexico lead adoption through upgrades in municipal wastewater treatment and expanding pharmaceutical manufacturing. Rising regulatory focus, urbanization, and foreign investment in infrastructure support steady market expansion across both regions.
Need any customization research on Total Organic Carbon (TOC) Analyzer Market - Enquiry Now
Competitive Landscape for the Total Organic Carbon (TOC) Analyzer Market
Shimadzu Corporation
Shimadzu Corporation is a Japan-based leader in analytical instrumentation, specializing in high-precision TOC analyzers for laboratory and industrial use. The company designs, manufactures, and supports benchtop, online, and portable TOC systems that deliver reliable detection, robust automation, and compliance-ready reporting for pharmaceuticals, water utilities, and process industries. Shimadzu’s global service network provides calibration, validation, and lifecycle support, making it a trusted partner for quality-critical applications. Its role in the TOC analyzer market is essential, as it combines engineering excellence with rigorous performance standards to help customers meet regulatory and process-control requirements.
-
In March 2024, Shimadzu expanded its TOC portfolio with upgraded online monitoring capabilities and improved automation for pharmaceutical and water-treatment customers.
Hach Company (Danaher Corporation)
Hach Company, part of Danaher Corporation, is a U.S.-based specialist in water analysis solutions, offering a broad suite of TOC analyzers, sensors, and turnkey monitoring systems for municipal and industrial applications. Hach provides integrated hardware, software, and service packages that simplify installation, enable continuous compliance monitoring, and support remote data management. The company’s emphasis on field-hardened reliability and operator-friendly interfaces positions it as a go-to supplier for utilities and wastewater plants seeking dependable, low-maintenance TOC measurement.
-
In January 2024, Hach introduced a cloud-connected TOC monitoring solution designed for 24/7 wastewater and drinking-water compliance tracking.
Xylem Inc.
Xylem Inc. is a U.S.-based water technology company that delivers end-to-end solutions, including TOC analyzers integrated into broader water treatment and process optimization systems. Xylem pairs instrumentation with digital services and lifecycle support to improve plant efficiency, reduce downtime, and meet environmental discharge limits. Its strength lies in delivering scalable solutions for municipalities and industrial operators, combining analytics, remote monitoring, and service agreements to maximize uptime and regulatory adherence. Xylem plays a strategic role in the market by bundling TOC measurement into comprehensive water-management offerings.
-
In June 2024, Xylem announced an integrated TOC monitoring package that ties online analyzers to plant control systems and remote diagnostics.
SUEZ
SUEZ is a France-based global water and waste-management company that supplies TOC analyzers as part of its municipal and industrial water treatment services. SUEZ integrates analytical instrumentation, process control, and operations expertise to deliver turnkey monitoring solutions that ensure water quality, optimize chemical usage, and support environmental compliance. With project delivery, commissioning, and long-term service contracts, SUEZ helps utilities and industrial clients implement continuous TOC monitoring across treatment plants and industrial effluent streams. Its role in the market centers on system integration and operations-led value delivery.
-
In September 2024, SUEZ rolled out enhanced TOC monitoring packages for industrial wastewater projects, emphasizing turnkey installation and lifecycle services.
Total Organic Carbon (TOC) Analyzer Market Key Players:
-
Shimadzu Corporation
-
Hach Company (Danaher Corporation)
-
Xylem Inc.
-
SUEZ
-
Mettler-Toledo International Inc.
-
Metrohm AG
-
Elementar Analysensysteme GmbH
-
Teledyne Tekmar
-
Yokogawa Electric Corporation
-
Endress+Hauser Group Services AG
-
OI Analytical
-
Analytik Jena GmbH
-
LAR Process Analysers AG
-
MEMBRAPURE
-
Biolab Scientific
-
PCE Ibérica S.L.
-
Infitek
-
Process Sensing Technologies Ltd.
-
GE Analytical Instruments
-
LabX
GE Analytical Instruments-Company Financial Analysis
| Report Attributes | Details |
|---|---|
| Market Size in 2025E | US$ 1.4 Billion |
| Market Size by 2033 | US$ 2.33 Billion |
| CAGR | CAGR 6.74% From 2026 to 2033 |
| Base Year | 2025 |
| Forecast Period | 2026-2033 |
| Historical Data | 2022-2024 |
| Report Scope & Coverage | Market Size, Segments Analysis, Competitive Landscape, Regional Analysis, DROC & SWOT Analysis, Forecast Outlook |
| Key Segments | • by Type (Laboratory (Benchtop) TOC Analyzers, Online TOC Analyzers, Portable TOC Analyzers) • by Technology (High-Temperature Catalytic Oxidation (HTCO), Ultraviolet (UV) Oxidation, Persulfate-Ultraviolet Oxidation, Wet-Oxidation Method) • by Application (Liquid Sample Analysis (drinking water, wastewater, industrial effluents), Solid Sample Analysis (soils, sediments)) • by End-User Industry (Pharmaceuticals, Food & Beverages, Chemical Manufacturing, Semiconductors) |
| Regional Analysis/Coverage | North America (US, Canada, Mexico), Europe (Eastern Europe [Poland, Romania, Hungary, Turkey, Rest of Eastern Europe] Western Europe] Germany, France, UK, Italy, Spain, Netherlands, Switzerland, Austria, Rest of Western Europe]), Asia Pacific (China, India, Japan, South Korea, Vietnam, Singapore, Australia, Rest of Asia Pacific), Middle East & Africa (Middle East [UAE, Egypt, Saudi Arabia, Qatar, Rest of Middle East], Africa [Nigeria, South Africa, Rest of Africa], Latin America (Brazil, Argentina, Colombia, Rest of Latin America) |
| Company Profiles | Shimadzu Corporation, Hach Company (Danaher Corporation), Xylem Inc., SUEZ, Mettler-Toledo International Inc., Metrohm AG, Elementar Analysensysteme GmbH, Teledyne Tekmar, Yokogawa Electric Corporation, Endress+Hauser Group Services AG, OI Analytical, Analytik Jena GmbH, LAR Process Analysers AG, MEMBRAPURE, Biolab Scientific, PCE Ibérica S.L., Infitek, Process Sensing Technologies Ltd., GE Analytical Instruments, LabX |
Frequently Asked Questions
Ans: - Key Stakeholders Considered in the study are Raw material vendors, Regulatory authorities, including government agencies and NGOs, Commercial research, and development (R&D) institutions, Importers and exporters, etc.
Ans: - The major kay players are Shimadzu, GE Analytical Instruments, Hach, Mettler Toledo, Analytik Jena, Elementar Analysensysteme GmbH, Xylem, Teledyne Tekmar, LAR Process Analyser, Metrohm, Skalar Analytical, Comet, Tailin, Endress+Hauser.
Ans: - The Total Organic Carbon (TOC) Analyzer Market is growing at a CAGR of 6.74% From 2026 to 2033.
Ans: -Microelectronics industry expansion and the pharmaceutical sector is rapidly expanding.
Ans: - The Total Organic Carbon (TOC) Analyzer Market size of 1.4 Bn in 2025E.
Get in Touch
