VAE Emulsion Market Report Scope & Overview:
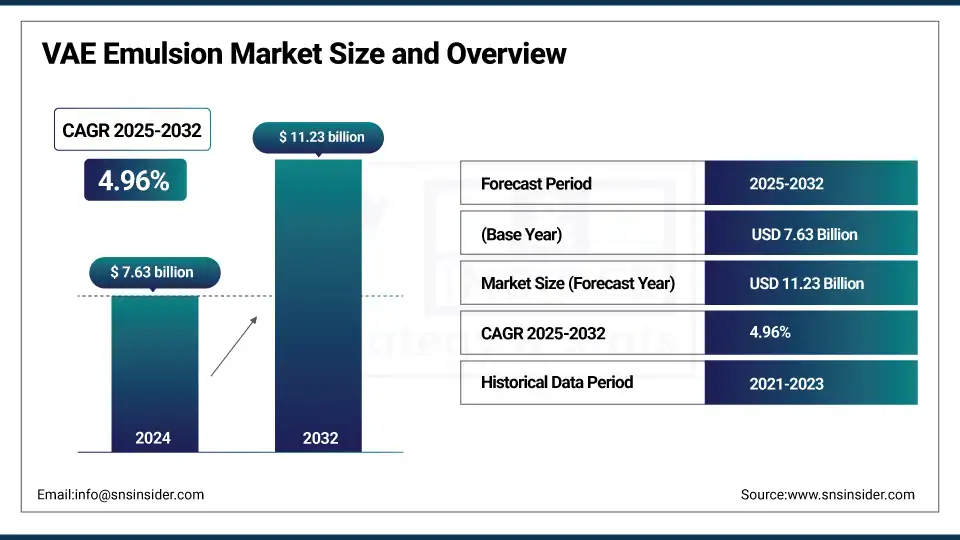
The VAE Emulsion market size was valued at USD 7.63 billion in 2024 and is expected to reach USD 11.23 billion by 2032, growing at a CAGR of 4.96% over the forecast period of 2025-2032.
The VAE emulsion market is wherein increasing use of eco-friendly adhesives and low-VOC binders in the paints and coatings and textile chemicals applications is the key contributing factor. VAE emulsion suppliers WACKER are developing the production of hybrid polymers as well as unveiling sustainable technologies at prestigious industry events such as the European Coatings Show 2025. The use of vinyl acetate ethylene emulsion has the advantages of flexibility, excellent adhesion, and an environmentally friendly nature, and is rapidly used in industry.
To Get more information On VAE Emulsion Market - Request Free Sample Report
Vinyl-acrylic systems make up approximately 27% of binder demand, and resins represent over $31 billion of the worldwide coatings raw materials market, according to the American Coatings Association. The VE emulsion market study shows better wet-scrub resistance against SA substitutes. These VAE emulsion market trends and developments are accelerating the growth of the VAE emulsion market share in construction, textiles, as well as packaging. With the growing sustainability ambitions, the VAE emulsion market size is anticipated to observe continuing VAE emulsions market demand worldwide in the prominent end-use industries.
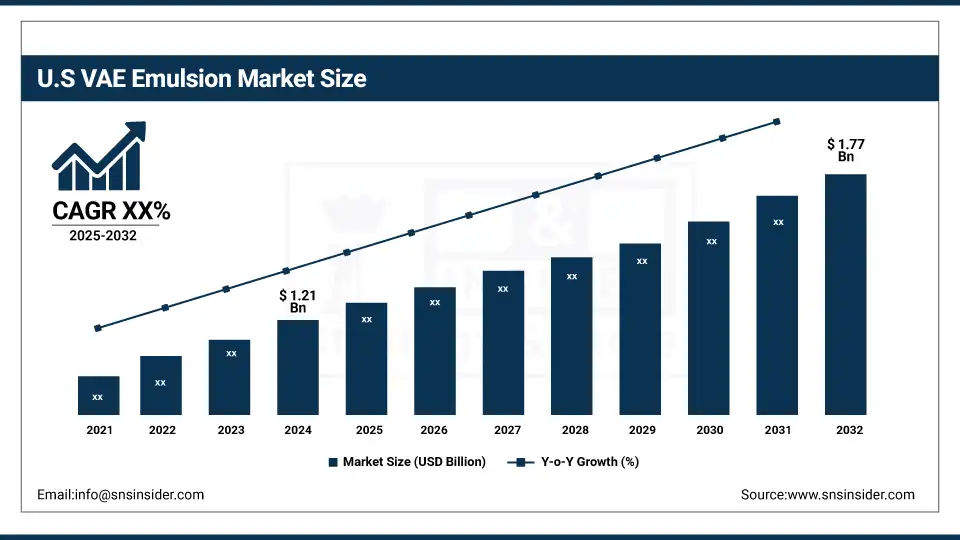
The U.S. accounted for approximately 71% of North America’s vinyl acetate ethylene emulsion market share with a market size of USD 1.21 billion in 2024 and is projected to reach a value of USD 1.77 billion by 2032. The dominance is propelled by robust demand for green adhesives and paints. According to the U.S. Green Building Council, LEED-certified building projects increased by over 9% year-over-year, driving VAE adoption in construction. Meanwhile, the American Coatings Association has highlighted the shift from solvent to water-based formulations, which boosts VAE emulsion market share across the paints and coatings industry and packaging applications. Key players are expanding their VOC-compliant product portfolios tailored to U.S. regulations.
Market Dynamics:
Drivers:
-
Expansion of hybrid polymer facilities for construction and adhesive applications supports VAE emulsion market growth
Wacker Chemie AG‘s new hybrid polymer production complex at Nünchritz complements its production of environmentally-friendly adhesives and waterproofing binders. The expansion is also designed for construction and the paints and coatings market, in particular, VOC-compliant, high-quality materials. Vinyl Acetate Ethylene Emulsion manufacturers are now evolving in specific segments of industries, with innovation and new developments branching out from the production process. These developments continue to fuel incremental growth in the VAE emulsion market, supported by the strengthening position of VAE emulsions in the newer generation of construction chemicals and packaging adhesives.
-
Sustainability mandates accelerate eco-innovation in the Vinyl Acetate Ethylene Emulsion industry
Rising regulatory pressure and accelerating environmental awareness are driving Vinyl Acetate Ethylene Emulsion producers to develop greener technologies. WACKER’s biomethanol-derived sealants and VOC-free hybrid polymers presented at the European Coatings Show 2025 exemplify this. These developments improve the eco-profile of adhesives, paints/coatings, and textile auxiliaries. Growing environmental concern in various industries globally is broadening the scope of such VAE emulsion market trends, which is contributing towards the increased preference for waterborne systems, adding to the expansion of the VAE emulsion market and growing their demand in eco-conscious applications.
Restraints:
-
Regulatory pressure on microplastics could restrict future adoption of VAE emulsions
New EU and U.S. regulations for microplastics are putting polymer-based dispersions under scrutiny. VEAE emulsions are water-based and may need reformulation if found to be a source of microplastics. Such a threat may delay innovation timing, increase compliance costs, and narrow the market share of VAE emulsion in sensitive applications such as decorative coating and textile additives. Regulatory ambiguity continues to pose a long-term challenge for Vinyl Acetate Ethylene Emulsions market players as they struggle to keep up with changing environmental regulations while matching performance.
Segmentation Analysis:
By Product
Ordinary Vinyl Acetate Ethylene Emulsions dominated the market in 2024 with a 58.5% share, mainly due to their broad use in adhesives and paints. Their outstanding performance, low cost, and compatibility with various substrates maintain their primacy. For instance, Wacker Chemie AG’s focus on traditional VAE emulsions for packaging adhesives is well-suited for the growing call for environmentally sound binders. That this is what VAE emulsions are about finds support in industry entities such as the American Coatings Association, which also notes the contribution of VAE emulsions towards lowering VOC emissions in both coatings as well as textiles.
Waterproof Vinyl Acetate Ethylene Emulsions are the fastest growing segment with a 5.09% CAGR forecast on account of increasing applications in waterproofing membranes and construction coatings. Companies such as Wacker have increased capacity to supply hybrid waterproof binders that are meeting the growing need for products that meet more rigorous environmental legislation. Growth is also promoted by government spending on infrastructure in durable, weather-resistant materials. The Vinyl Acetate Ethylene Emulsion market has also grown because of it is too waterproof emulsion and which is better for durability and flexibility problems in the construction chemicals and paints, and coatings industry.
By Application
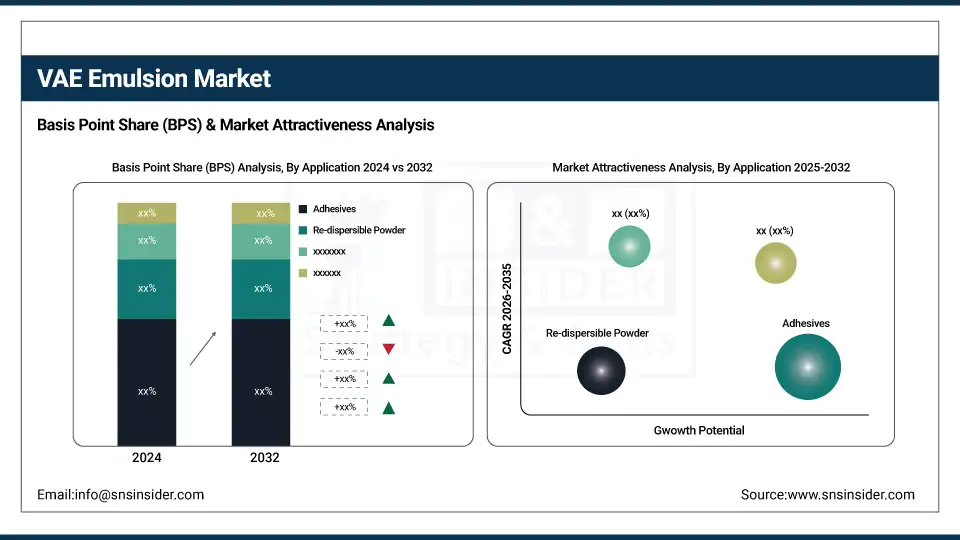
Adhesives commanded 35.2% market share in 2024, led by packaging adhesives, driven by booming e-commerce and sustainability trends. The Adhesive and Sealant Council’s 2024 Sustainability Summit highlighted that growth in low-VOC, aqueous adhesives will be driven by VAE emulsions. Pressure-sensitive and hot-melt adhesives for flexible packaging are particularly targeted by formulators for the growth of market share. Moreover, rising use in automotive and textile chemicals also helps in increasing the adoption, which in turn improves the footprint of the Vinyl Acetate Ethylene Emulsion Market in various industrial applications.
The re-dispersible powder segment is forecasted to grow fastest at a 5.31% CAGR, driven by demand in tile adhesives and cementitious articles. Partnerships such as Ashland Specialty Ingredients and Dairen Chemical increase the value of redispersible powders, increasing water retention and construction flexibility. Government infrastructure initiatives for green building materials are driving further adoption of the same. This growing demand is also driving the Vinyl Acetate Ethylene Emulsion Market growth as the product is also used in construction chemicals, which focus on durability, along with environmental factors.
Paints and coatings hold the second fastest growth rate with a 5.25% CAGR, based on low-VOC vinyl acetate–ethylene emulsions instead of solvent-based binders. The growing need for decorative, industrial coatings complements the urbanization and increasing stringency in air quality standards. New developments presented by VAE Emulsion suppliers at the European Coatings Show 2025 feature enhanced wet-scrub resistance and adhesion. Rising utilization of the product in the architectural and automotive sector, with the paints and coatings industry becoming increasingly focused towards sustainable binders, is expected to drive the growth of the Vinyl Acetate Ethylene Emulsion Market.
Regional Analysis:
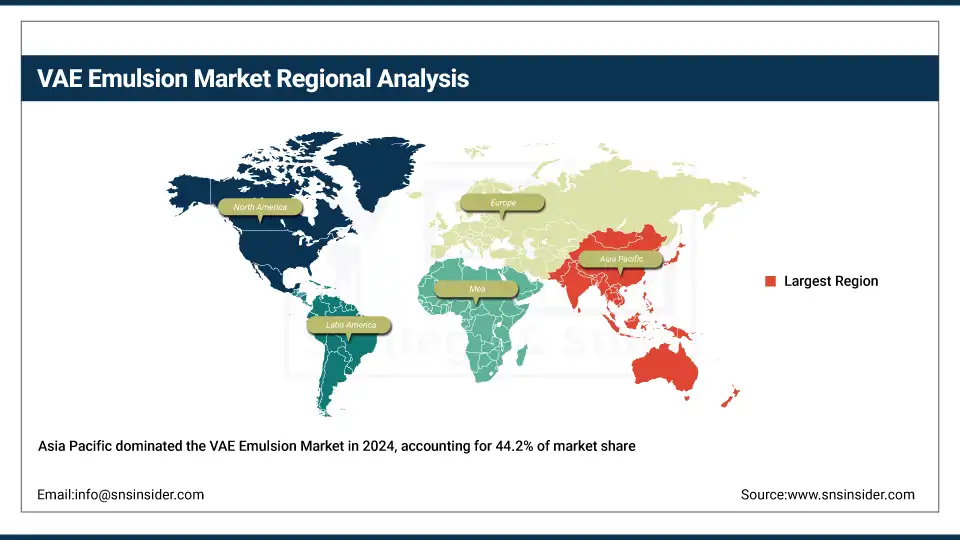
Asia Pacific dominated the vinyl acetate ethylene emulsion market with a 44.2% share in 2024, driven by rapid urbanization, growing demand for green coatings, and favorable government subsidies. China alone accounted for almost 60% of the regional consumption, because of environmental reform, infrastructure development. The Ministry of Ecology and Environment in China advocates low-VOC systems, and more than sixty percent of architectural coatings in China are now VAE-based, according to the China National Coatings Industry Association. Manufacturers are expanding output to keep up with increasing demand in construction, textile chemicals, and the paints and coatings sector.
Get Customized Report as per Your Business Requirement - Enquiry Now
Latin America is the fastest-growing region in the vinyl acetate ethylene emulsion market, projected to expand at a CAGR of 5.93% during the forecast period, driven by construction modernization and green government initiatives. The ABRAFATI Expo in Brazil spotlighted the rising use of waterproof emulsions and redispersible powders in adhesives. Brazil, contributing around 45% of the regional market, is leading this growth. Its Ministry of Infrastructure promotes low-emission building materials, accelerating the adoption of VOC-compliant VAE emulsions in tiling, cement, and packaging applications across the construction and paints and coatings industry.
North America held 22.3% of the vinyl acetate ethylene emulsion market in 2024, driven by strict low-VOC regulations and advanced adoption in packaging, adhesives, and the paints and coatings industry. The American Coatings Association encourages the use of water-based formulations, while the U.S. Environmental Protection Agency supports green chemistry innovations that promote VAE emulsions in construction and industrial coatings. Vinyl acetate ethylene emulsion companies are partnering with regional OEMs and construction firms to deliver sustainable products that comply with both environmental and performance standards, solidifying the region’s influence in the global market.
Key Players:
The major VAE emulsion market competitors include Wacker Chemie AG, Celanese Corporation, Dairen Chemical Corporation (DCC), China Petrochemical Corporation (Sinopec), Vinavil S.p.A., Shanxi Sanwei Group Co., Ltd., The Beijing Eastern Petro-chemical, Wanwei, Sinopec Sichuan Vinylon Works, and Shaanxi XuTai Technology Co., Ltd.
Recent Developments:
-
In March 2025, Stephenson launched Durosoft polyglyceryl esters for skin and hair care, offering COSMOS-certified, vegan emulsifiers ideal for mild, natural formulations, enhancing stability and foam in various personal care products.
-
In October 2023, Mallard Creek Polymers launched advanced VAE emulsions for adhesives, enhancing water-based formulations with better bonding strength, flexibility, and environmental compliance for packaging and sealant applications.
| Report Attributes | Details |
|---|---|
| Market Size in 2024 | USD 7.63 billion |
| Market Size by 2032 | USD 11.23 billion |
| CAGR | CAGR of 4.96% From 2025 to 2032 |
| Base Year | 2024 |
| Forecast Period | 2025-2032 |
| Historical Data | 2021-2023 |
| Report Scope & Coverage | Market Size, Segments Analysis, Competitive Landscape, Regional Analysis, DROC & SWOT Analysis, Forecast Outlook |
| Key Segments | •By Product (Waterproof VAE Emulsions, and Ordinary VAE Emulsions) •By Application (Adhesives, Re-dispersible Powder, Paints and Coatings, Textile Chemicals, and Others) |
| Regional Analysis/Coverage | North America (US, Canada, Mexico), Europe (Germany, France, UK, Italy, Spain, Poland, Turkey, Rest of Europe), Asia Pacific (China, India, Japan, South Korea, Singapore, Australia, Rest of Asia Pacific), Middle East & Africa (UAE, Saudi Arabia, Qatar, South Africa, Rest of Middle East & Africa), Latin America (Brazil, Argentina, Rest of Latin America) |
| Company Profiles | Wacker Chemie AG, Celanese Corporation, Dairen Chemical Corporation (DCC), China Petrochemical Corporation (Sinopec), Vinavil S.p.A., Shanxi Sanwei Group Co., Ltd., The Beijing Eastern Petro-chemical, Wanwei, Sinopec Sichuan Vinylon Works, and Shaanxi XuTai Technology Co., Ltd. |
Frequently Asked Questions
Emerging microplastics regulations may affect polymer compliance, posing risks to formulation and innovation timelines.
Wacker Chemie AG, Celanese, DCC, Vinavil, Sinopec, and Shanxi Sanwei are among the top VAE emulsion manufacturers.
Sustainability innovation, hybrid polymer expansion, and increasing adoption of waterproof and re-dispersible VAE binders are key trends.
Adhesives, paints and coatings industry, textile chemicals, and construction sectors are the major consumers of VAE emulsions globally.
Growing demand for eco-friendly adhesives and VOC-free binders in the construction, packaging, and coatings industries fuels market growth.
Get in Touch
