Vertical Software Market Report Scope & Overview:
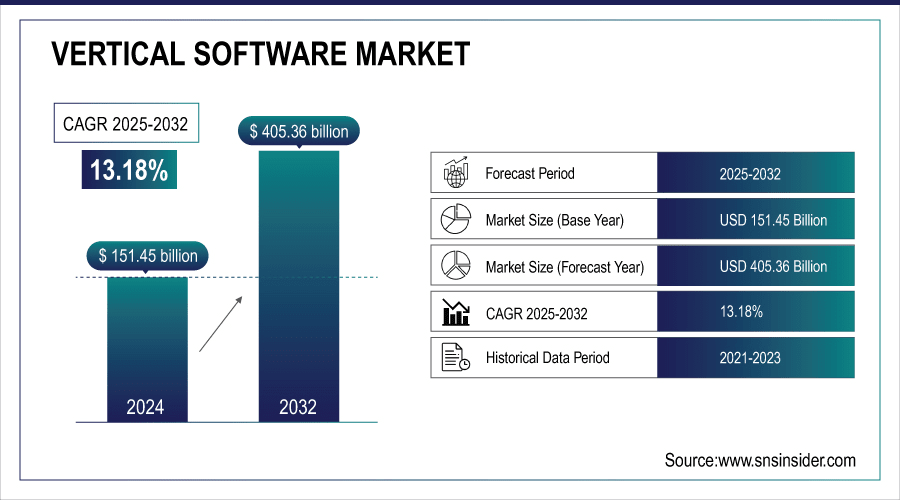
Vertical Software Market was valued at USD 151.45 billion in 2024 and is expected to reach USD 405.36 billion by 2032, growing at a CAGR of 13.18% from 2025-2032.
The Vertical Software Market is growing due to increasing digital transformation across industries, rising demand for industry-specific solutions, and the need for operational efficiency. Adoption of cloud-based platforms, AI, and analytics enhances decision-making and scalability. Businesses seek tailored software for sectors like healthcare, retail, BFSI, and manufacturing to improve productivity, customer engagement, and compliance. Additionally, remote work trends and automation requirements further accelerate market expansion globally. For example, in August 2025, Microsoft Corporation highlighted its manufacturing cloud modernization, BMW improved IoT data delivery and analysis tenfold using Azure AI, Azure Data Explorer, and generative AI–powered Power BI, enabling more accessible insights for decision-makers.
Key Vertical Software Market Trends
-
Growing demand for industry-specific solutions tailored to healthcare, retail, manufacturing, and finance.
-
Cloud-based deployment is enabling scalable, flexible, and cost-efficient software adoption.
-
Integration of AI, analytics, and automation is enhancing operational efficiency and decision-making.
-
Rising need for regulatory compliance drives adoption of specialized vertical software solutions.
-
Mobile and SaaS platforms are facilitating real-time access and collaboration across enterprises.
-
Increasing investments in digital transformation and workflow optimization are accelerating market growth.
-
Collaboration with fintech, IoT, and cybersecurity providers is creating more connected industry ecosystems.
U.S. Vertical Software Market was valued at USD 40.27 billion in 2024 and is expected to reach USD 106.40 billion by 2032, growing at a CAGR of 12.91% from 2025-2032.
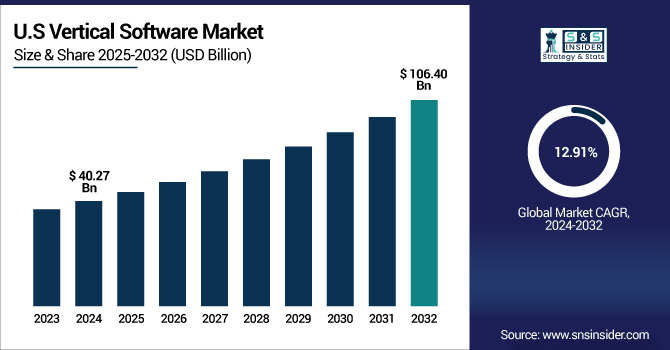
The U.S. Vertical Software Market is expanding due to rising digital transformation, demand for industry-specific solutions, and cloud adoption. Businesses increasingly leverage AI, analytics, and automation to enhance efficiency, compliance, and customer engagement, driving robust growth.
Vertical Software Market Growth Drivers:
-
Increasing digital transformation initiatives are fueling adoption of vertical software to streamline workflows and enable sector-specific operational efficiency
Increasing investments in digital transformation are driving the adoption of vertical software, as businesses shift toward automation and technology integration. Companies across sectors prioritize operational efficiency, real-time analytics, and improved customer experiences, which specialized vertical solutions deliver. For instance, cloud-based solutions enhance scalability in retail, while advanced analytics optimize patient care in healthcare. In manufacturing, digital platforms integrate IoT and supply chain visibility, boosting productivity. These tailored solutions help reduce costs, enhance accuracy, and accelerate innovation. As enterprises embrace modernization, vertical software adoption strengthens, ensuring long-term reliance on technology tailored to meet sector-specific requirements effectively and efficiently.
Vertical Software Market Restraints:
-
Data security and compliance complexities create obstacles for vertical software adoption in regulated industries like healthcare, banking, and government sectors
Stringent regulations around data protection and compliance create challenges for vertical software adoption in industries like healthcare, finance, and government. These sectors deal with sensitive personal, financial, and operational data, requiring robust security frameworks. Software providers must ensure compliance with strict standards such as HIPAA, GDPR, and PCI DSS, which significantly increases complexity and costs. Any breach or non-compliance risks severe financial penalties and reputational damage. As cyber threats grow, businesses hesitate to fully adopt digital solutions without strong assurances of security. These concerns slow adoption, limit flexibility, and increase resistance to implementing vertical software in heavily regulated environments.
Vertical Software Market Opportunities:
-
Rising demand for AI and advanced analytics in vertical software creates new opportunities for predictive insights and data-driven decision-making across industries
Rising integration of artificial intelligence (AI) and advanced analytics in vertical software offers immense growth potential, enabling predictive capabilities and smarter decision-making. Industries increasingly rely on real-time insights to optimize operations, enhance customer experiences, and improve forecasting accuracy. For example, AI-powered analytics in retail helps predict consumer demand, while in healthcare it supports personalized treatment. Manufacturing leverages predictive maintenance to avoid downtime, and finance benefits from fraud detection and risk modeling. These technologies enhance the value proposition of vertical solutions, making them essential for businesses seeking competitive advantage, efficiency gains, and innovation across specialized industry sectors globally.
Key Vertical Software Market Segment Analysis
-
By Vertical, BFSI dominated with ~27% share in 2024; Healthcare fastest growing (CAGR 15.64%).
-
By Organization Size, Large Enterprises dominated with ~61% share in 2024; SMEs fastest growing (CAGR 14.43%).
-
By Application, Enterprise Resource Planning (ERP) dominated with ~28% share in 2024; Supply Chain Management (SCM) fastest growing (CAGR 15.74%).
-
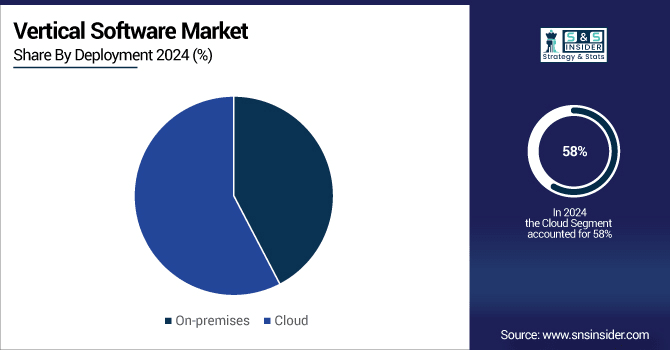
By Deployment, Cloud dominated with ~58% share in 2024; Cloud fastest growing (CAGR 14.10%).
By End Use BFSI dominated while Healthcare is expected to grow fastest
BFSI segment dominated the Vertical Software Market in 2024 due to its heavy reliance on advanced compliance, risk management, fraud detection, and secure digital transaction platforms. Increasing regulatory demands and rapid digitization across banking and financial institutions significantly drove large-scale adoption of industry-specific vertical solutions during the period.
Healthcare segment is expected to grow at the fastest CAGR from 2025 to 2032 owing to rising digital health initiatives, adoption of electronic health records, telemedicine expansion, and demand for AI-driven diagnostics. Increasing regulatory compliance and the shift toward patient-centric care are further accelerating the adoption of vertical software solutions.
By Organization Size Large Enterprises led while SMEs are projected to grow rapidly
Large Enterprises segment dominated the Vertical Software Market in 2024 due to their greater financial capacity, advanced IT infrastructure, and higher adoption of digital transformation strategies. These organizations implement customized, large-scale vertical solutions to improve operational efficiency, compliance, and competitiveness across diverse global business operations.
SMEs segment is expected to grow at the fastest CAGR from 2025 to 2032 driven by increasing affordability of cloud-based solutions, growing awareness of digital efficiency, and demand for cost-effective tools. Flexible subscription models and industry-specific scalability make vertical software increasingly accessible for small and medium-sized enterprises globally.
By Application Enterprise Resource Planning held the largest share while Supply Chain Management is expected to expand fastest
Enterprise Resource Planning segment dominated the Vertical Software Market in 2024 because of its role in centralizing operations, streamlining workflows, and improving efficiency across industries. Businesses heavily rely on ERP for financial management, human resources, and compliance, making it the most widely adopted vertical solution during the year.
Supply Chain Management segment is expected to grow at the fastest CAGR from 2025 to 2032 due to rising global trade complexities, demand for real-time visibility, and integration with IoT and AI. Industries increasingly adopt SCM software to optimize logistics, reduce costs, and ensure resilience in supply chain networks.
By Deployment Cloud dominated and is expected to grow fastest
Cloud segment dominated the Vertical Software Market in 2024 and is expected to grow at the fastest CAGR from 2025 to 2032 due to its scalability, flexibility, and cost-effectiveness. Organizations increasingly prefer cloud deployment for easier integration, real-time collaboration, and reduced infrastructure costs. Enhanced data security, remote accessibility, and subscription-based pricing models further drive widespread adoption, making cloud the most dominant and rapidly expanding deployment model across industries.
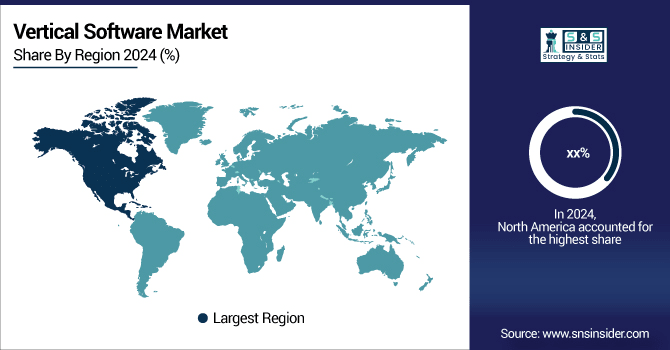
North America Vertical Software Market Insights
North America dominated the Vertical Software Market in 2024 due to strong technological infrastructure, high digital transformation investments, and the presence of leading software providers. Industries such as BFSI, healthcare, and retail adopted advanced solutions for compliance, analytics, and operational efficiency. Supportive regulatory frameworks, strong cybersecurity practices, and early adoption of cloud-based platforms further strengthened the region’s leadership, ensuring consistent demand and large-scale deployment of vertical software solutions.
Asia Pacific Vertical Software Market Insights
Asia Pacific is expected to grow at the fastest CAGR from 2025 to 2032 driven by rapid industrialization, rising digital adoption, and increasing investments in IT infrastructure. Expanding SMEs, government-backed digitization programs, and widespread adoption of cloud solutions contribute significantly to growth. Rising demand for healthcare, retail, and manufacturing software solutions further accelerates expansion, making Asia Pacific the most dynamic region for vertical software adoption in the forecast period.
Europe Vertical Software Market Insights
Europe in the Vertical Software Market is experiencing steady growth driven by stringent regulatory compliance, strong adoption of cloud-based solutions, and increasing demand across healthcare, BFSI, and manufacturing sectors. Rising investments in digital transformation, emphasis on data security, and support for industry-specific innovation foster market expansion, positioning Europe as a key contributor to global vertical software adoption and development.
Middle East & Africa and Latin America Vertical Software Market Insights
Middle East & Africa in the Vertical Software Market is growing steadily due to rising digital transformation initiatives, expanding BFSI and healthcare sectors, and government-led smart city projects. Latin America is witnessing increased adoption driven by growing SME investments, cloud-based affordability, and sectoral demand in retail and manufacturing, positioning both regions as emerging contributors to vertical software adoption and market expansion.
Vertical Software Market Competitive Landscape:
Microsoft Corporation, founded in 1975, is a key player in the Vertical Software Market, offering industry-specific solutions across healthcare, finance, manufacturing, and retail. Its cloud-based platforms, including Microsoft Dynamics 365, integrate AI, analytics, and automation to enhance operational efficiency, compliance, and customer engagement. Microsoft’s continuous innovation, strong enterprise presence, and global reach position it as a dominant provider of scalable, tailored software solutions, driving adoption across diverse industries.
-
In 2025, Microsoft introduced Copilot Tuning for Microsoft 365 enabling sector-specific AI agents. Industries like aviation or legal can train domain-expert Copilots using internal documents securely.
Veeva Systems, founded in 2007, is a leading provider in the Vertical Software Market, specializing in cloud-based solutions for the life sciences and healthcare sectors. Its platforms, including Veeva CRM and Veeva Vault, streamline regulatory compliance, data management, and customer engagement. With a focus on innovation, scalability, and industry-specific functionality, Veeva enables organizations to enhance operational efficiency, accelerate product development, and maintain compliance, solidifying its position as a trusted vertical software provider.
-
In 2024, Veeva Systems Released Vault CRM Campaign Manager, advancing its life-sciences software by uniting sales, marketing, and medical teams in one CRM ecosystem, enabling coordinated omnichannel campaign execution and stronger industry collaboration.
-
In 2023, Veeva Systems Announced first Vault CRM customer, with field medical teams going live in Q4 2023; general availability rolled out in April 2024, marking a next-gen milestone for life-sciences CRM platforms.
Key Players
Some of the Vertical Software Market Companies
-
Microsoft Corporation
-
Oracle Corporation
-
SAP SE
-
Salesforce, Inc.
-
Adobe Inc.
-
IBM Corporation
-
Intuit Inc.
-
Epic Systems Corporation
-
Infor Inc.
-
Constellation Software Inc.
-
McKesson Corporation
-
Autodesk Inc.
-
Cerner Corporation
-
Tyler Technologies Inc.
-
Paychex Inc.
-
Sage Group plc
-
Veeva Systems
-
Procore Technologies
-
Toast
-
Clio
Report Attributes | Details |
---|---|
Market Size in 2024 | USD 151.45 Billion |
Market Size by 2032 | USD 405.36 Billion |
CAGR | CAGR of 13.18% From 2025 to 2032 |
Base Year | 2024 |
Forecast Period | 2025-2032 |
Historical Data | 2021-2023 |
Report Scope & Coverage | Market Size, Segments Analysis, Competitive Landscape, Regional Analysis, DROC & SWOT Analysis, Forecast Outlook |
Key Segments | • By Organization Size (SMEs, Large Enterprises) • By Application (Customer Relationship Management (CRM), Enterprise Resource Planning (ERP), Supply Chain Management (SCM), Human Resource Management (HRM), Other) • By Deployment (On-premises, Cloud) • By End-use (BFSI, Media & Entertainment, Healthcare, IT & Telecom, Retail & E-commerce, Government & Public Sectors, Education, Others) |
Regional Analysis/Coverage | North America (US, Canada), Europe (Germany, UK, France, Italy, Spain, Russia, Poland, Rest of Europe), Asia Pacific (China, India, Japan, South Korea, Australia, ASEAN Countries, Rest of Asia Pacific), Middle East & Africa (UAE, Saudi Arabia, Qatar, South Africa, Rest of Middle East & Africa), Latin America (Brazil, Argentina, Mexico, Colombia, Rest of Latin America). |
Company Profiles | Microsoft Corporation, Oracle Corporation, SAP SE, Salesforce, Inc., Adobe Inc., IBM Corporation, Intuit Inc., Epic Systems Corporation, Infor Inc., Constellation Software Inc., McKesson Corporation, Autodesk Inc., Cerner Corporation, Tyler Technologies Inc., Paychex Inc., Sage Group plc, Veeva Systems, Procore Technologies, Toast, Clio |
Table Of Contents
1. Introduction
1.1 Market Definition & Scope
1.2 Research Assumptions & Abbreviations
1.3 Research Methodology
2. Executive Summary
2.1 Market Snapshot
2.2 Market Absolute $ Opportunity Assessment & Y-o-Y Analysis, 2021–2032
2.3 Market Size & Forecast, By Segmentation, 2021–2032
2.3.1 Market Size By Organization Size
2.3.2 Market Size By Application
2.3.3 Market Size By Deployment
2.3.4 Market Size By End-use
2.4 Market Share & Bps Analysis By Region, 2024
2.5 Industry Growth Scenarios – Conservative, Likely & Optimistic
2.6 Industry CxO’s Perspective
3. Market Overview
3.1 Market Dynamics
3.1.1 Drivers
3.1.2 Restraints
3.1.3 Opportunities
3.1.4 Key Market Trends
3.2 Industry PESTLE Analysis
3.3 Key Industry Forces (Porter’s) Impacting Market Growth
3.4 Industry Supply Chain Analysis
3.4.1 Raw Material Suppliers
3.4.2 Manufacturers
3.4.3 Distributors/Suppliers
3.4.4 Customers/End-Users
3.5 Industry Life Cycle Assessment
3.6 Parent Market Overview
3.7 Market Risk Assessment
4. Statistical Insights & Trends Reporting
4.1 Pricing & Cost Structure Analysis
4.1.1 Average Licensing & Subscription Fees by Software Type
4.1.2 Cost Breakdown (Implementation, Customization, Maintenance, Support)
4.1.3 Regional Pricing Variations
4.1.4 Pricing Trends by Organization Size (SME, Mid-Market, Enterprise)
4.1.5 Forecasted Price Adjustments Due to Cloud, SaaS, and Low-Code Platform Adoption
4.2 Deployment & Operational Metrics
4.2.1 Average Implementation Time (Months) By End-use Software Type
4.2.2 System Uptime & Reliability (%)
4.2.3 Number of Modules Integrated per Organization (e.g., ERP, CRM, Analytics)
4.2.4 Average Users per Deployment
4.2.5 Maintenance & Upgrade Frequency (Annually / Per Quarter)
4.3 Regulatory & Compliance Metrics
4.3.1 % Platforms Compliant with Industry-Specific Regulations (HIPAA, FINRA, GDPR, ISO)
4.3.2 Number of Compliance Audits per Year
4.3.3 Average Time to Regulatory Approval for Software Updates or New Features
4.3.4 Reported Incidence of Compliance Violations (%)
4.3.5 Impact of Regulatory Changes on Deployment & Operating Costs
4.4 R&D & Innovation Metrics
4.4.1 Annual R&D Spending by Top Vertical Software Providers
4.4.2 Number of Patents Filed for Industry-Specific Software Solutions
4.4.3 New Feature Rollouts per Year (By Industry)
4.4.4 Adoption Rate of Low-Code/No-Code Platforms for Vertical Software
4.4.5 Collaboration with Universities / Research Labs for Industry-Specific Solutions
5. Vertical Software Market Segmental Analysis & Forecast, By Organization Size, 2021 – 2032, Value (Usd Billion) & Volume (Number of Users)
5.1 Introduction
5.2 SMEs
5.2.1 Key Trends
5.2.2 Market Size & Forecast, 2021 – 2032
5.3 Large Enterprises
5.3.1 Key Trends
5.3.2 Market Size & Forecast, 2021 – 2032
6. Vertical Software Market Segmental Analysis & Forecast, By Application, 2021 – 2032, Value (Usd Billion) & Volume (Number of Users)
6.1 Introduction
6.2 Customer Relationship Management (CRM)
6.2.1 Key Trends
6.2.2 Market Size & Forecast, 2021 – 2032
6.3 Enterprise Resource Planning (ERP)
6.3.1 Key Trends
6.3.2 Market Size & Forecast, 2021 – 2032
6.4 Supply Chain Management (SCM)
6.4.1 Key Trends
6.4.2 Market Size & Forecast, 2021 – 2032
6.5 Human Resource Management (HRM)
6.5.1 Key Trends
6.5.2 Market Size & Forecast, 2021 – 2032
6.6 Other
6.6.1 Key Trends
6.6.2 Market Size & Forecast, 2021 – 2032
7. Vertical Software Market Segmental Analysis & Forecast, By Deployment, 2021 – 2032, Value (Usd Billion) & Volume (Number of Users)
7.1 Introduction
7.2 On-premises
7.2.1 Key Trends
7.2.2 Market Size & Forecast, 2021 – 2032
7.3 Cloud
7.3.1 Key Trends
7.3.2 Market Size & Forecast, 2021 – 2032
8. Vertical Software Market Segmental Analysis & Forecast, By End-use, 2021 – 2032, Value (Usd Billion) & Volume (Number of Users)
8.1 Introduction
8.2 BFSI
8.2.1 Key Trends
8.2.2 Market Size & Forecast, 2021 – 2032
8.3 Media & Entertainment
8.3.1 Key Trends
8.3.2 Market Size & Forecast, 2021 – 2032
8.4 Healthcare
8.4.1 Key Trends
8.4.2 Market Size & Forecast, 2021 – 2032
8.5 IT & Telecom
8.5.1 Key Trends
8.5.2 Market Size & Forecast, 2021 – 2032
8.6 Retail & E-commerce
8.6.1 Key Trends
8.6.2 Market Size & Forecast, 2021 – 2032
8.7 Government & Public Sectors
8.7.1 Key Trends
8.7.2 Market Size & Forecast, 2021 – 2032
8.8 Government & Public Sectors
8.8.1 Key Trends
8.8.2 Market Size & Forecast, 2021 – 2032
8.9 Others
8.9.1 Key Trends
8.9.2 Market Size & Forecast, 2021 – 2032
9. Vertical Software Market Segmental Analysis & Forecast By Region, 2021 – 2025, Value (Usd Billion) & Volume (Number of Users)
9.1 Introduction
9.2 North America
9.2.1 Key Trends
9.2.2 Vertical Software Market Size & Forecast, By Organization Size, 2021 – 2032
9.2.3 Vertical Software Market Size & Forecast, By Application, 2021 – 2032
9.2.4 Vertical Software Market Size & Forecast, By Deployment, 2021 – 2032
9.2.5 Vertical Software Market Size & Forecast, By End-use, 2021 – 2032
9.2.6 Vertical Software Market Size & Forecast, By Country, 2021 – 2032
9.2.6.1 USA
9.2.6.1.1 Vertical Software Market Size & Forecast, By Organization Size, 2021 – 2032
9.2.6.1.2 Vertical Software Market Size & Forecast, By Application, 2021 – 2032
9.2.6.1.3 Vertical Software Market Size & Forecast, By Deployment, 2021 – 2032
9.2.6.1.4 Vertical Software Market Size & Forecast, By End-use, 2021 – 2032
9.2.6.2 Canada
9.2.6.2.1 Vertical Software Market Size & Forecast, By Organization Size, 2021 – 2032
9.2.6.2.2 Vertical Software Market Size & Forecast, By Application, 2021 – 2032
9.2.6.2.3 Vertical Software Market Size & Forecast, By Deployment, 2021 – 2032
9.2.6.2.4 Vertical Software Market Size & Forecast, By End-use, 2021 – 2032
9.3 Europe
9.3.1 Key Trends
9.3.2 Vertical Software Market Size & Forecast, By Organization Size, 2021 – 2032
9.3.3 Vertical Software Market Size & Forecast, By Application, 2021 – 2032
9.3.4 Vertical Software Market Size & Forecast, By Deployment, 2021 – 2032
9.3.5 Vertical Software Market Size & Forecast, By End-use, 2021 – 2032
9.3.6 Vertical Software Market Size & Forecast, By Country, 2021 – 2032
9.3.6.1 Germany
9.3.6.1.1 Vertical Software Market Size & Forecast, By Organization Size, 2021 – 2032
9.3.6.1.2 Vertical Software Market Size & Forecast, By Application, 2021 – 2032
9.3.6.1.3 Vertical Software Market Size & Forecast, By Deployment, 2021 – 2032
9.3.6.1.4 Vertical Software Market Size & Forecast, By End-use, 2021 – 2032
9.3.6.2 UK
9.3.6.2.1 Vertical Software Market Size & Forecast, By Organization Size, 2021 – 2032
9.3.6.2.2 Vertical Software Market Size & Forecast, By Application, 2021 – 2032
9.3.6.2.3 Vertical Software Market Size & Forecast, By Deployment, 2021 – 2032
9.3.6.2.4 Vertical Software Market Size & Forecast, By End-use, 2021 – 2032
9.3.6.3 France
9.3.6.3.1 Vertical Software Market Size & Forecast, By Organization Size, 2021 – 2032
9.3.6.3.2 Vertical Software Market Size & Forecast, By Application, 2021 – 2032
9.3.6.3.3 Vertical Software Market Size & Forecast, By Deployment, 2021 – 2032
9.3.6.3.4 Vertical Software Market Size & Forecast, By End-use, 2021 – 2032
9.3.6.4 Italy
9.3.6.4.1 Vertical Software Market Size & Forecast, By Organization Size, 2021 – 2032
9.3.6.4.2 Vertical Software Market Size & Forecast, By Application, 2021 – 2032
9.3.6.4.3 Vertical Software Market Size & Forecast, By Deployment, 2021 – 2032
9.3.6.4.4 Vertical Software Market Size & Forecast, By End-use, 2021 – 2032
9.3.6.5 Spain
9.3.6.5.1 Vertical Software Market Size & Forecast, By Organization Size, 2021 – 2032
9.3.6.5.2 Vertical Software Market Size & Forecast, By Application, 2021 – 2032
9.3.6.5.3 Vertical Software Market Size & Forecast, By Deployment, 2021 – 2032
9.3.6.5.4 Vertical Software Market Size & Forecast, By End-use, 2021 – 2032
9.3.6.6 Russia
9.3.6.6.1 Vertical Software Market Size & Forecast, By Organization Size, 2021 – 2032
9.3.6.6.2 Vertical Software Market Size & Forecast, By Application, 2021 – 2032
9.3.6.6.3 Vertical Software Market Size & Forecast, By Deployment, 2021 – 2032
9.3.6.6.4 Vertical Software Market Size & Forecast, By End-use, 2021 – 2032
9.3.6.7 Poland
9.3.6.7.1 Vertical Software Market Size & Forecast, By Organization Size, 2021 – 2032
9.3.6.7.2 Vertical Software Market Size & Forecast, By Application, 2021 – 2032
9.3.6.7.3 Vertical Software Market Size & Forecast, By Deployment, 2021 – 2032
9.3.6.7.4 Vertical Software Market Size & Forecast, By End-use, 2021 – 2032
9.3.6.8 Rest of Europe
9.3.6.8.1 Vertical Software Market Size & Forecast, By Organization Size, 2021 – 2032
9.3.6.8.2 Vertical Software Market Size & Forecast, By Application, 2021 – 2032
9.3.6.8.3 Vertical Software Market Size & Forecast, By Deployment, 2021 – 2032
9.3.6.8.4 Vertical Software Market Size & Forecast, By End-use, 2021 – 2032
9.4 Asia-Pacific
9.4.1 Key Trends
9.4.2 Vertical Software Market Size & Forecast, By Organization Size, 2021 – 2032
9.4.3 Vertical Software Market Size & Forecast, By Application, 2021 – 2032
9.4.4 Vertical Software Market Size & Forecast, By Deployment, 2021 – 2032
9.4.5 Vertical Software Market Size & Forecast, By End-use, 2021 – 2032
9.4.6 Vertical Software Market Size & Forecast, By Country, 2021 – 2032
9.4.6.1 China
9.4.6.1.1 Vertical Software Market Size & Forecast, By Organization Size, 2021 – 2032
9.4.6.1.2 Vertical Software Market Size & Forecast, By Application, 2021 – 2032
9.4.6.1.3 Vertical Software Market Size & Forecast, By Deployment, 2021 – 2032
9.4.6.1.4 Vertical Software Market Size & Forecast, By End-use, 2021 – 2032
9.4.6.2 India
9.4.6.2.1 Vertical Software Market Size & Forecast, By Organization Size, 2021 – 2032
9.4.6.2.2 Vertical Software Market Size & Forecast, By Application, 2021 – 2032
9.4.6.2.3 Vertical Software Market Size & Forecast, By Deployment, 2021 – 2032
9.4.6.2.4 Vertical Software Market Size & Forecast, By End-use, 2021 – 2032
9.4.6.3 Japan
9.4.6.3.1 Vertical Software Market Size & Forecast, By Organization Size, 2021 – 2032
9.4.6.3.2 Vertical Software Market Size & Forecast, By Application, 2021 – 2032
9.4.6.3.3 Vertical Software Market Size & Forecast, By Deployment, 2021 – 2032
9.4.6.3.4 Vertical Software Market Size & Forecast, By End-use, 2021 – 2032
9.4.6.4 South Korea
9.4.6.4.1 Vertical Software Market Size & Forecast, By Organization Size, 2021 – 2032
9.4.6.4.2 Vertical Software Market Size & Forecast, By Application, 2021 – 2032
9.4.6.4.3 Vertical Software Market Size & Forecast, By Deployment, 2021 – 2032
9.4.6.4.4 Vertical Software Market Size & Forecast, By End-use, 2021 – 2032
9.4.6.5 Australia
9.4.6.5.1 Vertical Software Market Size & Forecast, By Organization Size, 2021 – 2032
9.4.6.5.2 Vertical Software Market Size & Forecast, By Application, 2021 – 2032
9.4.6.5.3 Vertical Software Market Size & Forecast, By Deployment, 2021 – 2032
9.4.6.5.4 Vertical Software Market Size & Forecast, By End-use, 2021 – 2032
9.4.6.6 ASEAN Countries
9.4.6.6.1 Vertical Software Market Size & Forecast, By Organization Size, 2021 – 2032
9.4.6.6.2 Vertical Software Market Size & Forecast, By Application, 2021 – 2032
9.4.6.6.3 Vertical Software Market Size & Forecast, By Deployment, 2021 – 2032
9.4.6.6.4 Vertical Software Market Size & Forecast, By End-use, 2021 – 2032
9.4.6.7 Rest of Asia-Pacific
9.4.6.7.1 Vertical Software Market Size & Forecast, By Organization Size, 2021 – 2032
9.4.6.7.2 Vertical Software Market Size & Forecast, By Application, 2021 – 2032
9.4.6.7.3 Vertical Software Market Size & Forecast, By Deployment, 2021 – 2032
9.4.6.7.4 Vertical Software Market Size & Forecast, By End-use, 2021 – 2032
9.5 Latin America
9.5.1 Key Trends
9.5.2 Vertical Software Market Size & Forecast, By Organization Size, 2021 – 2032
9.5.3 Vertical Software Market Size & Forecast, By Application, 2021 – 2032
9.5.4 Vertical Software Market Size & Forecast, By Deployment, 2021 – 2032
9.5.5 Vertical Software Market Size & Forecast, By End-use, 2021 – 2032
9.5.6 Vertical Software Market Size & Forecast, By Country, 2021 – 2032
9.5.6.1 Brazil
9.5.6.1.1 Vertical Software Market Size & Forecast, By Organization Size, 2021 – 2032
9.5.6.1.2 Vertical Software Market Size & Forecast, By Application, 2021 – 2032
9.5.6.1.3 Vertical Software Market Size & Forecast, By Deployment, 2021 – 2032
9.5.6.1.4 Vertical Software Market Size & Forecast, By End-use, 2021 – 2032
9.5.6.2 Argentina
9.5.6.2.1 Vertical Software Market Size & Forecast, By Organization Size, 2021 – 2032
9.5.6.2.2 Vertical Software Market Size & Forecast, By Application, 2021 – 2032
9.5.6.2.3 Vertical Software Market Size & Forecast, By Deployment, 2021 – 2032
9.5.6.2.4 Vertical Software Market Size & Forecast, By End-use, 2021 – 2032
9.5.6.3 Mexico
9.5.6.3.1 Vertical Software Market Size & Forecast, By Organization Size, 2021 – 2032
9.5.6.3.2 Vertical Software Market Size & Forecast, By Application, 2021 – 2032
9.5.6.3.3 Vertical Software Market Size & Forecast, By Deployment, 2021 – 2032
9.5.6.3.4 Vertical Software Market Size & Forecast, By End-use, 2021 – 2032
9.5.6.4 Colombia
9.5.6.4.1 Vertical Software Market Size & Forecast, By Organization Size, 2021 – 2032
9.5.6.4.2 Vertical Software Market Size & Forecast, By Application, 2021 – 2032
9.5.6.4.3 Vertical Software Market Size & Forecast, By Deployment, 2021 – 2032
9.5.6.4.4 Vertical Software Market Size & Forecast, By End-use, 2021 – 2032
9.5.6.5 Rest of Latin America
9.5.6.5.1 Vertical Software Market Size & Forecast, By Organization Size, 2021 – 2032
9.5.6.5.2 Vertical Software Market Size & Forecast, By Application, 2021 – 2032
9.5.6.5.3 Vertical Software Market Size & Forecast, By Deployment, 2021 – 2032
9.5.6.5.4 Vertical Software Market Size & Forecast, By End-use, 2021 – 2032
9.6 Middle East & Africa
9.6.1 Key Trends
9.6.2 Vertical Software Market Size & Forecast, By Organization Size, 2021 – 2032
9.6.3 Vertical Software Market Size & Forecast, By Application, 2021 – 2032
9.6.4 Vertical Software Market Size & Forecast, By Deployment, 2021 – 2032
9.6.5 Vertical Software Market Size & Forecast, By End-use, 2021 – 2032
9.6.6 Vertical Software Market Size & Forecast, By Country, 2021 – 2032
9.6.6.1 UAE
9.6.6.1.1 Vertical Software Market Size & Forecast, By Organization Size, 2021 – 2032
9.6.6.1.2 Vertical Software Market Size & Forecast, By Application, 2021 – 2032
9.6.6.1.3 Vertical Software Market Size & Forecast, By Deployment, 2021 – 2032
9.6.6.1.4 Vertical Software Market Size & Forecast, By End-use, 2021 – 2032
9.6.6.2 Saudi Arabia
9.6.6.2.1 Vertical Software Market Size & Forecast, By Organization Size, 2021 – 2032
9.6.6.2.2 Vertical Software Market Size & Forecast, By Application, 2021 – 2032
9.6.6.2.3 Vertical Software Market Size & Forecast, By Deployment, 2021 – 2032
9.6.6.2.4 Vertical Software Market Size & Forecast, By End-use, 2021 – 2032
9.6.6.3 Qatar
9.6.6.3.1 Vertical Software Market Size & Forecast, By Organization Size, 2021 – 2032
9.6.6.3.2 Vertical Software Market Size & Forecast, By Application, 2021 – 2032
9.6.6.3.3 Vertical Software Market Size & Forecast, By Deployment, 2021 – 2032
9.6.6.3.4 Vertical Software Market Size & Forecast, By End-use, 2021 – 2032
9.6.6.4 Egypt
9.6.6.4.1 Vertical Software Market Size & Forecast, By Organization Size, 2021 – 2032
9.6.6.4.2 Vertical Software Market Size & Forecast, By Application, 2021 – 2032
9.6.6.4.3 Vertical Software Market Size & Forecast, By Deployment, 2021 – 2032
9.6.6.4.4 Vertical Software Market Size & Forecast, By End-use, 2021 – 2032
9.6.6.5 South Africa
9.6.6.5.1 Vertical Software Market Size & Forecast, By Organization Size, 2021 – 2032
9.6.6.5.2 Vertical Software Market Size & Forecast, By Application, 2021 – 2032
9.6.6.5.3 Vertical Software Market Size & Forecast, By Deployment, 2021 – 2032
9.6.6.5.4 Vertical Software Market Size & Forecast, By End-use, 2021 – 2032
9.6.6.6 Rest of Middle East & Africa
9.6.6.6.1 Vertical Software Market Size & Forecast, By Organization Size, 2021 – 2032
9.6.6.6.2 Vertical Software Market Size & Forecast, By Application, 2021 – 2032
9.6.6.6.3 Vertical Software Market Size & Forecast, By Deployment, 2021 – 2032
9.6.6.6.4 Vertical Software Market Size & Forecast, By End-use, 2021 – 2032
10. Competitive Landscape
10.1 Key Players' Positioning
10.2 Competitive Developments
10.2.1 Key Strategies Adopted (%), By Key Players, 2024
10.2.2 Year-Wise Strategies & Development, 2021 – 2025
10.2.3 Number Of Strategies Adopted By Key Players, 2024
10.3 Market Share Analysis, 2024
10.4 Product/Service & Application Benchmarking
10.4.1 Product/Service Specifications & Features By Key Players
10.4.2 Product/Service Heatmap By Key Players
10.4.3 Application Heatmap By Key Players
10.5 Industry Start-Up & Innovation Landscape
10.6 Key Company Profiles
10.6.1 Microsoft Corporation
10.6.1.1 Company Overview & Snapshot
10.6.1.2 Product/Service Portfolio
10.6.1.3 Key Company Financials
10.6.1.4 SWOT Analysis
10.6.2 Oracle Corporation
10.6.2.1 Company Overview & Snapshot
10.6.2.2 Product/Service Portfolio
10.6.2.3 Key Company Financials
10.6.2.4 SWOT Analysis
10.6.3 SAP SE
10.6.3.1 Company Overview & Snapshot
10.6.3.2 Product/Service Portfolio
10.6.3.3 Key Company Financials
10.6.3.4 SWOT Analysis
10.6.4 Salesforce, Inc.
10.6.4.1 Company Overview & Snapshot
10.6.4.2 Product/Service Portfolio
10.6.4.3 Key Company Financials
10.6.4.4 SWOT Analysis
10.6.5 Adobe Inc.
10.6.5.1 Company Overview & Snapshot
10.6.5.2 Product/Service Portfolio
10.6.5.3 Key Company Financials
10.6.5.4 SWOT Analysis
10.6.6 IBM Corporation
10.6.6.1 Company Overview & Snapshot
10.6.6.2 Product/Service Portfolio
10.6.6.3 Key Company Financials
10.6.6.4 SWOT Analysis
10.6.7 Intuit Inc.
10.6.7.1 Company Overview & Snapshot
10.6.7.2 Product/Service Portfolio
10.6.7.3 Key Company Financials
10.6.7.4 SWOT Analysis
10.6.8 Epic Systems Corporation
10.6.8.1 Company Overview & Snapshot
10.6.8.2 Product/Service Portfolio
10.6.8.3 Key Company Financials
10.6.8.4 SWOT Analysis
10.6.9 Infor Inc.
10.6.9.1 Company Overview & Snapshot
10.6.9.2 Product/Service Portfolio
10.6.9.3 Key Company Financials
10.6.9.4 SWOT Analysis
10.6.10 Constellation Software Inc.
10.6.10.1 Company Overview & Snapshot
10.6.10.2 Product/Service Portfolio
10.6.10.3 Key Company Financials
10.6.10.4 SWOT Analysis
10.6.11 McKesson Corporation
10.6.11.1 Company Overview & Snapshot
10.6.11.2 Product/Service Portfolio
10.6.11.3 Key Company Financials
10.6.11.4 SWOT Analysis
10.6.12 Autodesk Inc.
10.6.12.1 Company Overview & Snapshot
10.6.12.2 Product/Service Portfolio
10.6.12.3 Key Company Financials
10.6.12.4 SWOT Analysis
10.6.13 Cerner Corporation
10.6.13.1 Company Overview & Snapshot
10.6.13.2 Product/Service Portfolio
10.6.13.3 Key Company Financials
10.6.13.4 SWOT Analysis
10.6.14 Tyler Technologies Inc.
10.6.14.1 Company Overview & Snapshot
10.6.14.2 Product/Service Portfolio
10.6.14.3 Key Company Financials
10.6.14.4 SWOT Analysis
10.6.15 Paychex Inc.
10.6.15.1 Company Overview & Snapshot
10.6.15.2 Product/Service Portfolio
10.6.15.3 Key Company Financials
10.6.15.4 SWOT Analysis
10.6.16 Sage Group plc
10.6.16.1 Company Overview & Snapshot
10.6.16.2 Product/Service Portfolio
10.6.16.3 Key Company Financials
10.6.16.4 SWOT Analysis
10.6.17 Veeva Systems
10.6.17.1 Company Overview & Snapshot
10.6.17.2 Product/Service Portfolio
10.6.17.3 Key Company Financials
10.6.17.4 SWOT Analysis
10.6.18 Procore Technologies
10.6.18.1 Company Overview & Snapshot
10.6.18.2 Product/Service Portfolio
10.6.18.3 Key Company Financials
10.6.18.4 SWOT Analysis
10.6.19 Toast
10.6.19.1 Company Overview & Snapshot
10.6.19.2 Product/Service Portfolio
10.6.19.3 Key Company Financials
10.6.19.4 SWOT Analysis
10.6.20 Clio
10.6.20.1 Company Overview & Snapshot
10.6.20.2 Product/Service Portfolio
10.6.20.3 Key Company Financials
10.6.20.4 SWOT Analysis
11. Analyst Recommendations
11.1 SNS Insider Opportunity Map
11.2 Industry Low-Hanging Fruit Assessment
11.3 Market Entry & Growth Strategy
11.4 Analyst Viewpoint & Suggestions On Market Growth
12. Assumptions
13. Disclaimer
14. Appendix
14.1 List Of Tables
14.2 List Of Figures
Key Segments:
By Organization Size
-
-
SMEs
-
Large Enterprises
-
By Application
-
-
Customer Relationship Management (CRM)
-
Enterprise Resource Planning (ERP)
-
Supply Chain Management (SCM)
-
Human Resource Management (HRM)
-
Other
-
By Deployment
-
-
On-premises
-
Cloud
-
By End-use
-
-
BFSI
-
Media & Entertainment
-
Healthcare
-
IT & Telecom
-
Retail & E-commerce
-
Government & Public Sectors
-
Education
-
Others
-
Request for Segment Customization as per your Business Requirement: Segment Customization Request
Regional Coverage:
North America
-
US
-
Canada
Europe
-
Germany
-
France
-
UK
-
Italy
-
Spain
-
Poland
-
Russia
-
Rest of Europe
Asia Pacific
-
China
-
India
-
Japan
-
South Korea
-
Australia
-
ASEAN Countries
-
Rest of Asia Pacific
Middle East & Africa
-
UAE
-
Saudi Arabia
-
Qatar
-
South Africa
-
Rest of Middle East & Africa
Latin America
-
Brazil
-
Argentina
-
Mexico
-
Colombia
-
Rest of Latin America
Request for Country Level Research Report: Country Level Customization Request
Available Customization
With the given market data, SNS Insider offers customization as per the company’s specific needs. The following customization options are available for the report:
-
Detailed Volume Analysis
-
Criss-Cross segment analysis (e.g. Product X Application)
-
Competitive Product Benchmarking
-
Geographic Analysis
-
Additional countries in any of the regions
-
Customized Data Representation
-
Detailed analysis and profiling of additional market players
An accurate research report requires proper strategizing as well as implementation. There are multiple factors involved in the completion of good and accurate research report and selecting the best methodology to compete the research is the toughest part. Since the research reports we provide play a crucial role in any company’s decision-making process, therefore we at SNS Insider always believe that we should choose the best method which gives us results closer to reality. This allows us to reach at a stage wherein we can provide our clients best and accurate investment to output ratio.
Each report that we prepare takes a timeframe of 350-400 business hours for production. Starting from the selection of titles through a couple of in-depth brain storming session to the final QC process before uploading our titles on our website we dedicate around 350 working hours. The titles are selected based on their current market cap and the foreseen CAGR and growth.
The 5 steps process:
Step 1: Secondary Research:
Secondary Research or Desk Research is as the name suggests is a research process wherein, we collect data through the readily available information. In this process we use various paid and unpaid databases which our team has access to and gather data through the same. This includes examining of listed companies’ annual reports, Journals, SEC filling etc. Apart from this our team has access to various associations across the globe across different industries. Lastly, we have exchange relationships with various university as well as individual libraries.

Step 2: Primary Research
When we talk about primary research, it is a type of study in which the researchers collect relevant data samples directly, rather than relying on previously collected data. This type of research is focused on gaining content specific facts that can be sued to solve specific problems. Since the collected data is fresh and first hand therefore it makes the study more accurate and genuine.
We at SNS Insider have divided Primary Research into 2 parts.
Part 1 wherein we interview the KOLs of major players as well as the upcoming ones across various geographic regions. This allows us to have their view over the market scenario and acts as an important tool to come closer to the accurate market numbers. As many as 45 paid and unpaid primary interviews are taken from both the demand and supply side of the industry to make sure we land at an accurate judgement and analysis of the market.
This step involves the triangulation of data wherein our team analyses the interview transcripts, online survey responses and observation of on filed participants. The below mentioned chart should give a better understanding of the part 1 of the primary interview.

Part 2: In this part of primary research the data collected via secondary research and the part 1 of the primary research is validated with the interviews from individual consultants and subject matter experts.
Consultants are those set of people who have at least 12 years of experience and expertise within the industry whereas Subject Matter Experts are those with at least 15 years of experience behind their back within the same space. The data with the help of two main processes i.e., FGDs (Focused Group Discussions) and IDs (Individual Discussions). This gives us a 3rd party nonbiased primary view of the market scenario making it a more dependable one while collation of the data pointers.
Step 3: Data Bank Validation
Once all the information is collected via primary and secondary sources, we run that information for data validation. At our intelligence centre our research heads track a lot of information related to the market which includes the quarterly reports, the daily stock prices, and other relevant information. Our data bank server gets updated every fortnight and that is how the information which we collected using our primary and secondary information is revalidated in real time.

Step 4: QA/QC Process
After all the data collection and validation our team does a final level of quality check and quality assurance to get rid of any unwanted or undesired mistakes. This might include but not limited to getting rid of the any typos, duplication of numbers or missing of any important information. The people involved in this process include technical content writers, research heads and graphics people. Once this process is completed the title gets uploader on our platform for our clients to read it.
Step 5: Final QC/QA Process:
This is the last process and comes when the client has ordered the study. In this process a final QA/QC is done before the study is emailed to the client. Since we believe in giving our clients a good experience of our research studies, therefore, to make sure that we do not lack at our end in any way humanly possible we do a final round of quality check and then dispatch the study to the client.