Electronic Grade Nitric Acid Market Analysis & Overview:
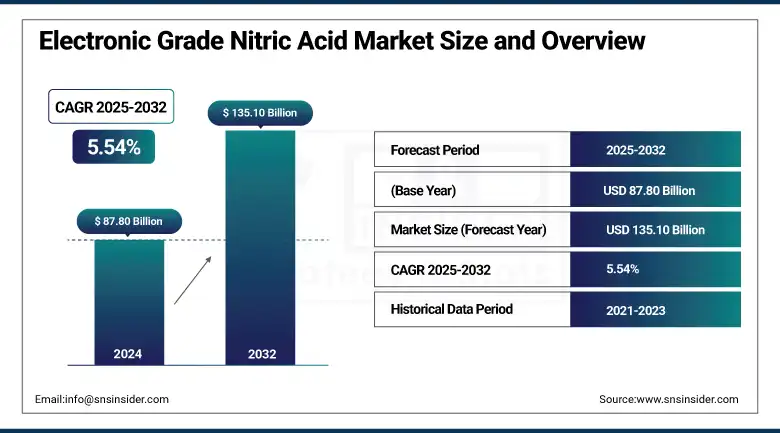
The Electronic Grade Nitric Acid Market size was valued at USD 87.80 million in 2024 and is expected to reach USD 135.10 million by 2032, growing at a CAGR of 5.54% over the forecast period of 2025-2032.
With the semiconductor, solar, and EV battery industries driving demand for ultra-high purity chemicals, the electronic grade nitric acid market is growing at a strong pace. Some of the primary drivers of the electronic grade nitric acid market are the technological advancements in purification techniques, such as sub-boiling distillation and ion exchange, and increased sustainability practices in the high-purity nitric acid market that focus on nitric acid recycling. Electronic grade nitric acid companies are shifting production home to consolidate supply chains.
To Get more information On Electronic Grade Nitric Acid Market - Request Free Sample Report
-
For instance, in April 2024, Mitsubishi Chemical Group increased Oregon capacity in response to growing demand in the US. In Japan, a 98% acid recovery is achieved in a 2023 pilot plant in Fukuoka.
-
In April 2025, BASF unveiled an investment in the high double-digit million-euro range for a new ultra-pure acid facility in Ludwigshafen.
These developments underscore robust growth in the electronic grade nitric acid market and the regional market, particularly in the North American electronic grade nitric acid industry, and the electronic chemicals and materials market in general.
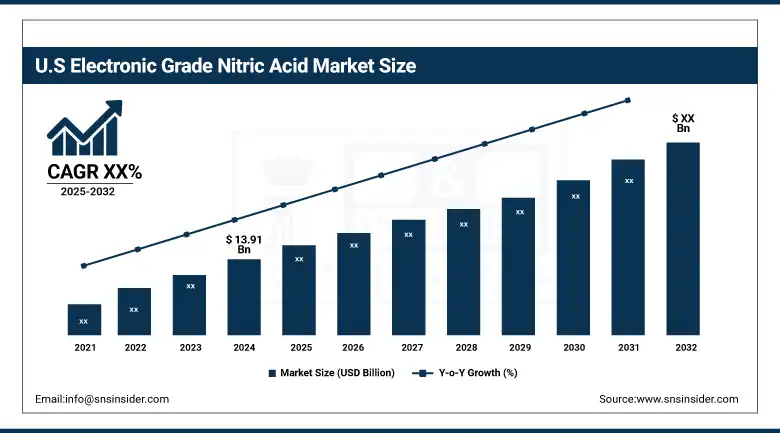
The U.S market size is valued to be USD 13.91 Billion with a market share of 72% in 2024. Additionally, growing consumption of high-performance computing types of equipment in the region promotes the demand for ultra-high-purity nitric acid.
Electronic Grade Nitric Acid Market Dynamics
Drivers
-
Federal CHIPS Act incentives accelerate domestic high-purity nitric acid production
The U.S. CHIPS and Science Act of 2022 allocated more than $39 billion in funding to strengthen domestic semiconductor production, and this directly drives demand for ultra-high-purity chemicals, including electronic grade nitric acid. With new fabs rolling out, producers have recorded a 12% increase in US electronic-grade acid orders year-over-year, further heralding the CHIPS Act in easing offshoring of critical supply chains and the advance of North American EGN nitric acid market share. This increasing demand has led top electronic grade nitric acid manufacturers to accelerate their capacity expansion and technology enhancements investments, confirming a robust, domestically available source for integrated device manufacturers (IDMs) and foundries in the United States.
-
Low natural gas prices drive cost-efficiencies for electronic grade nitric acid producers
The principal raw material for the production of ammonia and nitric acid, natural gas, witnessed historic low US Henry Hub spot prices at an average of $3.25 /MMBtu in 2024, as compared to those of $4.10 /MMBtu in 2023, as reported by the US Energy Information Administration. This had translated in a 15% reduction of production costs for manufacturers of electronic grade nitric acid; and reinvestment into purifications upgrades and margin enhancements. Producers are using these cost savings to create increased competition on ultra-high-purity nitric acid, pushing growth in end-use segments like semiconductor etching and battery electrode production in the Electronic Grade Nitric Acid Market.
Restraints
-
Stringent EPA NSPS and NESHAP regulations increase compliance expenditures for manufacturers
The U.S. EPA (Environmental Protection Agency) NSPS (New Source Performance Standards) and NESHAP (National Emission Standards for Hazardous Air Pollutants) restrict nitrogen oxide and acid mist discharge from new or modified nitric acid plants to strict levels. Facility compliance with revised 2012 NSPS will entail fitting in new advanced tail gas treatment (ATGT) systems that will raise capital costs by up to 20 %. Continued monitoring and reports, and the risk of fines for not complying, will lift operating costs, squeezing profit margins. With stricter scrutiny from all over the world on regulations, electronic grade nitric acid producers encounter not only a higher access threshold, but also have to spend much more on investing in environmental protection to add new capacity.
Electronic Grade Nitric Acid Market Segmentation Analysis
By Purity
Ultra-High Purity (99.9999% and above) dominated the electronic grade nitric acid market with a 51.6% market share in 2024. This domination results from the critical needs of the microlithography market for ultrapure chemicals used in the advanced chip-processing technology. For example, EL Grade (the highest degree of purity) is commonly used in the semiconductor process for its low metallic ion contamination. Asia-Pacific, holding some of the leading semiconductor foundries, among others, accounts for upwards of 75% of the EL Grade nitric acid demand in the sector.
On the other hand, the Ultra High Purity (99.9999% and above) is also growing at the highest CAGR at 5.87% from 2025 to 2032. This is also driven by the growing requirement for high-quality semiconductors in new and emerging technologies such as AI, IoT, and 5 G, such that there is a critical need for ultra-pure nitric acid in these processes, as even trace impurities in the nitric acid can adversely impact the performance of devices. Moreover, the growth of the semiconductor sector, especially in Asia-Pacific, provides impetus to this segment.
By Application
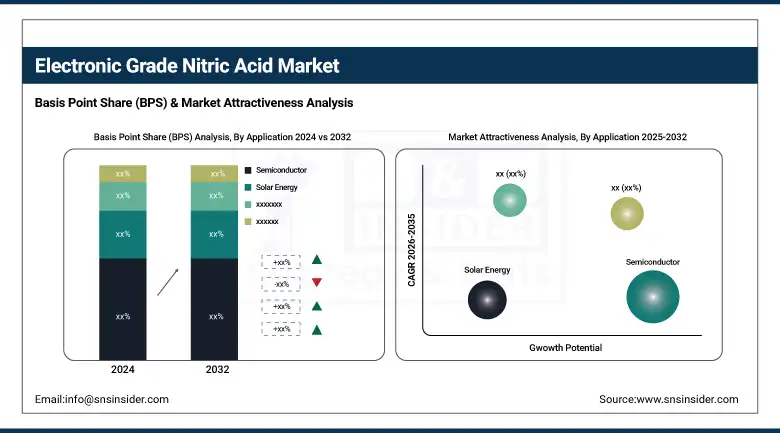
In 2024, the semiconductor application segment dominated the Electronic Grade Nitric Acid Market with a 57.2% market share. This is due to the need to clean and etch silicon wafers in the semiconductor manufacturing process using electronic-grade nitric acid. The consumer electronics and high-tech types of equipment market has been flourishing globally, which has resulted in the rise in the production of semiconductors that make use of high-purity nitric acid.
The solar energy application segment is the fastest-growing, with a CAGR of 6.71% in 2024. The worldwide trend favoring the use of renewable energy sources has led to an increase in demand for Liters of Photovoltaic cells for which electronic grade Nitric Acid is used in the Texturization of silicon wafers. This process has an important impact on the worldwide demand for high-purity nitric acid due to growth in the solar energy market.
Electronic Grade Nitric Acid Market Regional Outlook
The North American region is the fastest-growing market for Electronic Grade Nitric Acid, with an impressive CAGR of 6.8% in 2024. The growth of the region is also complemented by the growth in the semiconductor industry, which is the prominent end-user of electronic-grade nitric acid. The U.S. in particular dominates the region when it comes to major developments in semiconductor manufacturing, with companies like Intel and TSMC building up new foundries.
Europe holds the second-largest share in the Electronic Grade Nitric Acid market at 19.2%. Growth is attributed to the increasing demand for high-tech applications due to the semiconductor manufacturing in countries such as Germany, France, and the UK, among others. The automotive and renewables industries in Europe are also large end-users of electronic grade nitric acid, particularly in the production of solar panels. Germany is a central contributor, thanks to its leadership in semiconductor technology and clean energy.
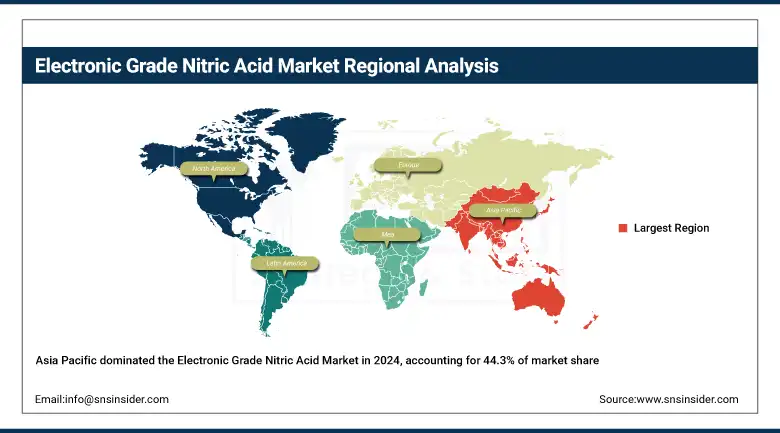
Asia Pacific dominates the Electronic Grade Nitric Acid market with a substantial 44.3% market share in 2024. The region is the center of global semiconductor manufacturing, and China, South Korea, Japan, and Taiwan dominate the market. There are only a few Taiwanese TSMC and South Korean Samsung Electronics, among others, behind offering demand for ultra-high purity nitric acid. Rapid technological period and heavy capital spending in semiconductor factories also contribute to the strengthening power of the region.
Get Customized Report as per Your Business Requirement - Enquiry Now
The Latin American region is a growing market for Electronic Grade Nitric Acid, with the largest market in solar energy and general industrial manufacturing. Brazil and Mexico are the main suppliers, mainly of solar photovoltaic cell production, which uses high-purity nitric acid in the wafer texturing process. Rising focus of the region on renewable energy projects is also likely to drive demand for electronic chemicals.
The Middle East & Africa region is projected to witness moderate growth during the forecast period, as the demand for electronic materials is increasing in the region with the growing electronics and manufacturing industry. Certain countries, including Saudi Arabia and the UAE, are investing in technology enhancement and expansion of semiconductor industry, which drive the demand for Electronic Grade Nitric Acid. In addition, investments in energy and tech infrastructure also play a part in this trend.
Key Players
The major competitors in the electronic grade nitric acid market include Mitsubishi Chemical Group Corp, BASF, Kanto Chemical Co., Inc., KMG Electronic Chemicals, Dongwoo Fine-Chem Co., Ltd., UBE Corporation, Tokuyama Corporation, Asia Union Electronic Chemical Corporation, Jianghua Microelectronics Materials Co., Ltd., and Suzhou Crystal Clear Chemical Co., Ltd.
Recent Developments
-
October 2023: Fujifilm completed the acquisition, rebranding the unit and adding 12 sites globally to strengthen its semiconductor materials and chemical management services.
-
May 2023: Fujifilm agreed to acquire CMC Materials KMG Corporation from Entegris for $700 million to expand its electronic chemicals portfolio for semiconductors.
| Report Attributes | Details |
|---|---|
| Market Size in 2024 | USD 87.80 million |
| Market Size by 2032 | USD 135.10 million |
| CAGR | CAGR of 5.54% From 2025 to 2032 |
| Base Year | 2024 |
| Forecast Period | 2025-2032 |
| Historical Data | 2021-2023 |
| Report Scope & Coverage | Market Size, Segments Analysis, Competitive Landscape, Regional Analysis, DROC & SWOT Analysis, Forecast Outlook |
| Key Segments | •By Purity (High Purity (99.999% and above), Ultra High Purity (99.9999% and above), Standard Purity (85% to 98%)) •By Application (Semiconductor, Solar Energy, LCD Panel, Others) |
| Regional Analysis/Coverage | North America (US, Canada, Mexico), Europe (Germany, France, UK, Italy, Spain, Poland, Turkey, Rest of Europe), Asia Pacific (China, India, Japan, South Korea, Singapore, Australia, Rest of Asia Pacific), Middle East & Africa (UAE, Saudi Arabia, Qatar, South Africa, Rest of Middle East & Africa), Latin America (Brazil, Argentina, Rest of Latin America) |
| Company Profiles | Mitsubishi Chemical Group Corp, BASF, Kanto Chemical Co., Inc., KMG Electronic Chemicals, Dongwoo Fine-Chem Co., Ltd., UBE Corporation, Tokuyama Corporation, Asia Union Electronic Chemical Corporation, Jianghua Microelectronics Materials Co., Ltd., and Suzhou Crystal Clear Chemical Co., Ltd. |
Frequently Asked Questions
The electronic grade nitric acid market size reached USD 87.80 million in 2024, driven by semiconductor and solar applications.
The semiconductor application dominated the electronic grade nitric acid market share in 2024 with 57.2%, due to high wafer cleaning demand.
The CHIPS Act supports the electronic grade nitric acid market growth by boosting U.S. semiconductor production and ultra-pure chemical demand.
Top electronic grade nitric acid companies include Mitsubishi Chemical, BASF, KMG Electronic Chemicals, UBE Corp, and Kanto Chemical.
Asia Pacific led the electronic grade nitric acid market share in 2024 with 44.3%, dominated by Taiwan, South Korea, and Japan.
Get in Touch
