Get More Information on Waterjet Cutting Machine Market - Request Sample Report
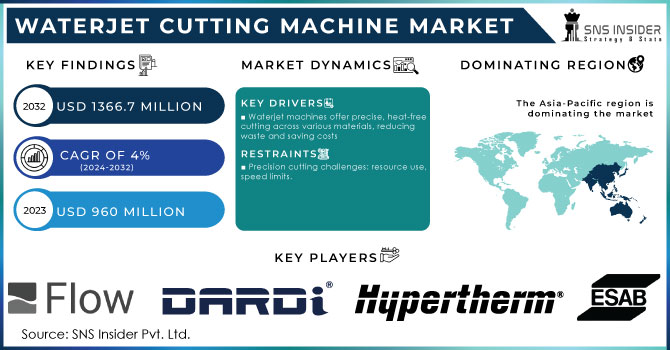
The Waterjet Cutting Machine Market size was estimated at USD 960 Million in 2023 and is expected to reach USD 1366.7 Million by 2032 at a CAGR of 4% during the forecast period of 2024-2032.
The Waterjet Cutting Machine Market is driven by its exceptional capability to accurately cut intricate shapes in various materials. The prominent products like Flow International Corporation's Mach series have the capability to process materials as thick as 24 inches. This technology is extremely flexible, enabling quick drilling and cutting of delicate details or exact shapes in materials like glass, stones, and metals. An abrasive cutter's pressure can hit 55,000 PSI, with water coming out of the nozzle at 762 m/s, exceeding the speed of sound by 2.5 times. Adding garnet sand changes the water jet to a grinding and cutting tool, creating forces at 305 m/s. Waterjet cutting technology consists of two types of ultra-high-pressure (UHP) water cutting: pure water cutting and abrasive cutting, with cutting slits varying from 0.1 to 1.8mm. An intricate waterjet machine can carve wood with a thickness of up to 125 mm at a speed of 15 m/min, without causing noticeable surface moisture or delamination, to allow for detailed carvings. Waterjets have the capability to penetrate materials that are 300 mm thick, with the potential to reach 600 mm for certain materials. Waterjets can process virtually any material, unlike laser cutting limitations with metals up to 25 mm thick and exclusion of reflective metals, and EDM restrictions to conductive materials under 300 mm thick. Both plasma cutting and flame cutting have restrictions despite their abilities to cut thick metals up to 75 mm and 150 mm respectively. For example, flame cutting is not suitable for aluminum and copper alloys and typically results in inferior edge quality when compared to waterjets.
In June 2024: The tech company WAZER, based in New York, has launched the WAZER Pro, a high-tech waterjet system for cutting materials in-house. Priced at $18,999, the WAZER Pro offers fast cutting abilities, allowing users to create parts quickly, either in minutes or hours. The cutting speed of the new WAZER Desktop model is two to four times quicker than the previous version. This strong system is capable of processing dense materials like aluminum, glass, plastic, and tile up to one inch in thickness, as well as steel up to three-eighths of an inch thick.
MARKET DYNAMICS
DRIVERS
Waterjet cutting machines are essential in numerous industries due to their precise cutting capability, ability to cut various materials without producing heat, and effectiveness in minimizing material waste, which leads to cost savings and resource optimization.
Waterjet cutting machines have become crucial in numerous industries due to their exceptional precision and versatility. These machines use a strong water stream, sometimes with abrasives, to slice various materials like metals, glass, ceramics, and composites. This method of cutting is highly appreciated for its precision in creating accurate cuts without generating heat. Waterjet cutting preserves the material's integrity, delivering clean edges and reducing the need for additional processing, unlike traditional cutting methods that may lead to thermal distortion or changes in material properties. Furthermore, waterjet cutting minimizes material waste by optimizing material use, resulting in cost savings and improved resource management. Waterjet cutting is a crucial tool in industries like automotive manufacturing, architecture, and metal fabrication due to its accuracy and minimal material wastage.
The increasing need for high-precision cutting, supported by waterjet cutting's cool process to prevent thermal distortion and its safety advantages of not generating harmful fumes or dust, is crucial for sectors such as aerospace and defense, and attractive in strict regulatory settings.
The increasing need for precise cutting in different industries, particularly in aerospace and defense, underscores the importance of waterjet cutting technology. The process's natural lack of heat prevents thermal distortion, a crucial benefit in applications needing precise tolerances and material integrity. Waterjet cutting improves safety and compliance by getting rid of hazardous fumes, dust, or particles that may be produced by different cutting techniques. This feature is especially appealing in sectors with rigorous regulation and safety protocols. By following these rules and guaranteeing accurate cuts, waterjet cutting fulfills the technical requirements of modern manufacturing while also complying with health and environmental standards, promoting a safer and more eco-friendly production setting.
RESTRAIN
The growing demand for precision cutting, along with its environmental and safety benefits, faces challenges from operational issues like continuous water and abrasive consumption, cutting speed and thickness limitations, complicating logistical and environmental management, and restricting its use in high-volume production environments.
The increasing need for precise cutting across different sectors is fueled by its capacity to create detailed and high-quality equipment with exceptional precision. This technology provides important environmental and safety advantages, such as decreased waste and improved workplace safety by reducing manual handling. Nonetheless, it encounters significant obstacles that affect its extensive acceptance, especially in high-volume manufacturing environments. Constant usage of water and abrasives needed for cooling and cutting may result in higher operational expenses and make waste disposal more challenging. Furthermore, the efficiency and throughput of precision cutting systems are limited by the cutting speed and thickness constraints they possess. These elements create logistical challenges and environmental concerns, which complicate the incorporation of precision cutting into large-scale production methods. Addressing operational constraints is essential for industries to maximize the potential of precision cutting technology while minimizing its impact on resources and production workflows.
By Industry
In 2023, the Automotive Industry has dominated a market share of 32%. Because waterjet cutting machines are widely used in producing complex automotive parts, the industry is growing and becoming more influential. Furthermore, the increase of robotic systems in the automotive industry, combined with the integration of WCMs on assembly lines, is leading to improved operational effectiveness.
By Product Type
The market is mostly led by 3D waterjet cutting machines, holding a majority share of 53% in 2023. Due to recent developments in the technology of 3D waterjet cutting machines, cutting heads can now perform 3D cutting by incorporating five-axis capabilities into their process. The method involves a turning head that can rotate 360 degrees and make cuts at angles of up to 46 degrees on all materials. Besides being capable of moving in the X, Y, and Z directions, it can also rotate between -360° and +360° around its axis, while the cutting head can pivot between +90° and -90°, making it easier to design in 3D.
By Offering
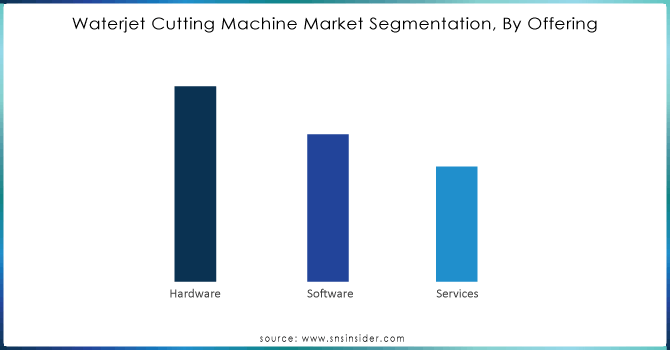
The Hardware holds a 45% market share in 2023, making it the most dominant player. Waterjet cutting machines, along with key components such as high-pressure pumps, nozzles, and cutting heads, are the main expense for buyers.
The software segment is experiencing rapid growth in the Waterjet Cutting Machine Market. The growing demand for advanced software solutions is fueled by the rising requirement for automation, precision, and efficiency in cutting processes. These software programs improve the performance of waterjet cutting machines by Offering better control, simulation, and design features.
Get Customized Report as per your Business Requirement - Request For Customized Report
REGIONAL ANALYSIS
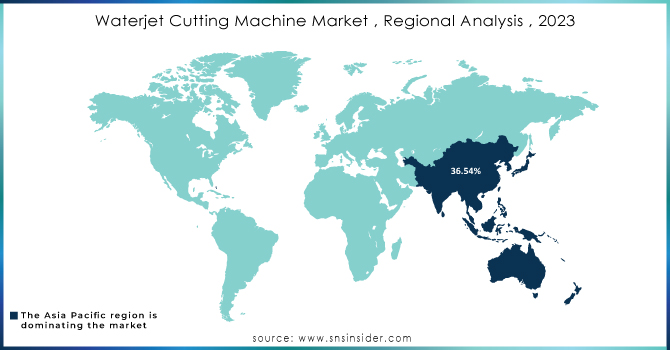
The Asia Pacific region dominated with a market share of 36.54% in 2023. Anticipated growth in the region's economy and industrialization, particularly in China, India, and South Korea, is expected to lead to an increase in product demand in the region. During the forecast period, the market is expected to be propelled by growth in the material handling, electronic component, metal and mining, food, beverage, and tobacco sectors in the region.
The major key players are Dardi International Corporation, ESAB, Flow International Corporation, Hypertherm, Inc., Jet Edge, Inc., Koike Aronson, Inc., OMAX Corporation, Resato International, WARDJet, KMT and others
RECENT DEVELOPMENT
In June 2023: Flow International Corporation unveiled Mach 200c and EchoJet waterjet systems, transforming precise cutting with bevel and five-axis functionalities. These advancements set new benchmarks in the industry, allowing for intricate manufacturing of parts.
Report Attributes | Details |
---|---|
Market Size in 2023 | US$ 960 Million |
Market Size by 2032 | US$ 1366.7 Million |
CAGR | CAGR of 4% From 2024 to 2032 |
Base Year | 2023 |
Forecast Period | 2024-2032 |
Historical Data | 2020-2022 |
Report Scope & Coverage | Market Size, Segments Analysis, Competitive Landscape, Regional Analysis, DROC & SWOT Analysis, Forecast Outlook |
Key Segments | • By Industry (Electronics, Automotive, Aerospace, Metal Fabrication, Construction, Others) • By Product Type (3D, Micro, Robotic) • By Offerings (Hardware, Software, Services) |
Regional Analysis/Coverage | North America (US, Canada, Mexico), Europe (Eastern Europe [Poland, Romania, Hungary, Turkey, Rest of Eastern Europe] Western Europe] Germany, France, UK, Italy, Spain, Netherlands, Switzerland, Austria, Rest of Western Europe]), Asia Pacific (China, India, Japan, South Korea, Vietnam, Singapore, Australia, Rest of Asia Pacific), Middle East & Africa (Middle East [UAE, Egypt, Saudi Arabia, Qatar, Rest of Middle East], Africa [Nigeria, South Africa, Rest of Africa], Latin America (Brazil, Argentina, Colombia, Rest of Latin America) |
Company Profiles | Dardi International Corporation, ESAB, Flow International Corporation, Hypertherm, Inc., Jet Edge, Inc., Koike Aronson, Inc., OMAX Corporation, Resato International, WARDJet, KMT |
Key Drivers |
• Waterjet cutting machines are essential in numerous industries due to their precise cutting capability, ability to cut various materials without producing heat, and effectiveness in minimizing material waste, which leads to cost savings and resource optimization. • The increasing need for high-precision cutting, supported by waterjet cutting's cool process to prevent thermal distortion and its safety advantages of not generating harmful fumes or dust, is crucial for sectors such as aerospace and defense, and attractive in strict regulatory settings. |
Restraints | • The growing demand for precision cutting, along with its environmental and safety benefits, faces challenges from operational issues like continuous water and abrasive consumption, cutting speed and thickness limitations, complicating logistical and environmental management, and restricting its use in high-volume production environments. |
Ans: The Waterjet Cutting Machine Market is expected to grow at a CAGR of 4%.
Ans: Waterjet Cutting Machine Market size was USD 960 Million in 2023 and is expected to Reach USD 1366.7 Million by 2032.
Ans: 3D is the dominating segment by product type capacity in the Waterjet Cutting Machine Market.
Ans: Waterjet cutting machines are essential in numerous industries due to their precise cutting capability, ability to cut various materials without producing heat, and effectiveness in minimizing material waste, which leads to cost savings and resource optimization.
Ans: Asia-Pacific is the dominating region in the Waterjet Cutting Machine Market.
Table Of Content
1. Introduction
1.1 Market Definition
1.2 Scope (Inclusion and Exclusions)
1.3 Research Assumptions
2. Executive Summary
2.1 Market Overview
2.2 Regional Synopsis
2.3 Competitive Summary
3. Research Methodology
3.1 Top-Down Approach
3.2 Bottom-up Approach
3.3. Data Validation
3.4 Primary Interviews
4. Market Dynamics Impact Analysis
4.1 Market Driving Factors Analysis
4.1.1 Drivers
4.1.2 Restraints
4.1.3 Opportunities
4.1.4 Challenges
4.2 PESTLE Analysis
4.3 Porter’s Five Forces Model
5. Statistical Insights and Trends Reporting
5.1 Manufacturing Output, by region, (2020-2023)
5.2 Utilization Rates, by region, (2020-2023)
5.3 Maintenance and Downtime Metrix
5.4 Technological Adoption Rates, by region
5.5 Export/Import Data, by region (2023)
6. Competitive Landscape
6.1 List of Major Companies, By Region
6.2 Market Share Analysis, By Region
6.3 Product Benchmarking
6.3.1 Product specifications and features
6.3.2 Pricing
6.4 Strategic Initiatives
6.4.1 Marketing and promotional activities
6.4.2 Distribution and supply chain strategies
6.4.3 Expansion plans and new product launches
6.4.4 Strategic partnerships and collaborations
6.5 Technological Advancements
6.6 Market Positioning and Branding
7. Waterjet Cutting Machine Market Segmentation, By Industry
7.1 Chapter Overview
7.2 Electronics
7.2.1 Electronics Market Trends Analysis (2020-2032)
7.2.2 Electronics Market Size Estimates and Forecasts to 2032 (USD Million)
7.3 Automotive
7.3.1 Automotive Market Trends Analysis (2020-2032)
7.3.2 Automotive Market Size Estimates and Forecasts to 2032 (USD Million)
7.4 Aerospace
7.4.1 Aerospace Market Trends Analysis (2020-2032)
7.4.2 Aerospace Market Size Estimates and Forecasts to 2032 (USD Million)
7.5 Metal Fabrication
7.5.1 Metal Fabrication Market Trends Analysis (2020-2032)
7.5.2 Metal Fabrication Market Size Estimates and Forecasts to 2032 (USD Million)
7.6 Construction
7.6.1 Construction Market Trends Analysis (2020-2032)
7.6.2 Construction Market Size Estimates and Forecasts to 2032 (USD Million)
7.7 Others
7.7.1 Others Market Trends Analysis (2020-2032)
7.7.2 Others Market Size Estimates and Forecasts to 2032 (USD Million)
8. Waterjet Cutting Machine Market Segmentation, By Product Type
8.1 Chapter Overview
8.2 3D
8.2.1 3D Market Trends Analysis (2020-2032)
8.2.2 3D Market Size Estimates and Forecasts to 2032 (USD Million)
8.3 Micro
8.3.1 Micro Market Trends Analysis (2020-2032)
8.3.2 Micro Market Size Estimates and Forecasts to 2032 (USD Million)
8.4 Robotic
8.4.1 Robotic Market Trends Analysis (2020-2032)
8.4.2 Robotic Market Size Estimates and Forecasts to 2032 (USD Million)
9. Waterjet Cutting Machine Market Segmentation, By Offering
9.1 Chapter Overview
9.2 Hardware
9.2.1 Hardware Market Trends Analysis (2020-2032)
9.2.2 Hardware Market Size Estimates and Forecasts to 2032 (USD Million)
9.3 Software
9.3.1 Software Market Trends Analysis (2020-2032)
9.3.2 Software Market Size Estimates and Forecasts to 2032 (USD Million)
9.4 Services
9.4.1 Services Market Trends Analysis (2020-2032)
9.4.2 Services Market Size Estimates and Forecasts to 2032 (USD Million)
10. Regional Analysis
10.1 Chapter Overview
10.2 North America
10.2.1 Trends Analysis
10.2.2 North America Waterjet Cutting Machine Market Estimates and Forecasts, by Country (2020-2032) (USD Million)
10.2.3 North America Waterjet Cutting Machine Market Estimates and Forecasts, by Industry (2020-2032) (USD Million)
10.2.4 North America Waterjet Cutting Machine Market Estimates and Forecasts, by Product Tye (2020-2032) (USD Million)
10.2.5 North America Waterjet Cutting Machine Market Estimates and Forecasts, by Offering (2020-2032) (USD Million)
10.2.6 USA
10.2.6.1 USA Waterjet Cutting Machine Market Estimates and Forecasts, by Industry (2020-2032) (USD Million)
10.2.6.2 USA Waterjet Cutting Machine Market Estimates and Forecasts, by Product Tye (2020-2032) (USD Million)
10.2.6.3 USA Waterjet Cutting Machine Market Estimates and Forecasts, by Offering (2020-2032) (USD Million)
10.2.7 Canada
10.2.7.1 Canada Waterjet Cutting Machine Market Estimates and Forecasts, by Industry (2020-2032) (USD Million)
10.2.7.2 Canada Waterjet Cutting Machine Market Estimates and Forecasts, by Product Tye (2020-2032) (USD Million)
10.2.7.3 Canada Waterjet Cutting Machine Market Estimates and Forecasts, by Offering (2020-2032) (USD Million)
10.2.8 Mexico
10.2.8.1 Mexico Waterjet Cutting Machine Market Estimates and Forecasts, by Industry (2020-2032) (USD Million)
10.2.8.2 Mexico Waterjet Cutting Machine Market Estimates and Forecasts, by Product Tye (2020-2032) (USD Million)
10.2.8.3 Mexico Waterjet Cutting Machine Market Estimates and Forecasts, by Offering (2020-2032) (USD Million)
10.3 Europe
10.3.1 Eastern Europe
10.3.1.1 Trends Analysis
10.3.1.2 Eastern Europe Waterjet Cutting Machine Market Estimates and Forecasts, by Country (2020-2032) (USD Million)
10.3.1.3 Eastern Europe Waterjet Cutting Machine Market Estimates and Forecasts, by Industry (2020-2032) (USD Million)
10.3.1.4 Eastern Europe Waterjet Cutting Machine Market Estimates and Forecasts, by Product Tye (2020-2032) (USD Million)
10.3.1.5 Eastern Europe Waterjet Cutting Machine Market Estimates and Forecasts, by Offering (2020-2032) (USD Million)
10.3.1.6 Poland
10.3.1.6.1 Poland Waterjet Cutting Machine Market Estimates and Forecasts, by Industry (2020-2032) (USD Million)
10.3.1.6.2 Poland Waterjet Cutting Machine Market Estimates and Forecasts, by Product Tye (2020-2032) (USD Million)
10.3.1.6.3 Poland Waterjet Cutting Machine Market Estimates and Forecasts, by Offering (2020-2032) (USD Million)
10.3.1.7 Romania
10.3.1.7.1 Romania Waterjet Cutting Machine Market Estimates and Forecasts, by Industry (2020-2032) (USD Million)
10.3.1.7.2 Romania Waterjet Cutting Machine Market Estimates and Forecasts, by Product Tye (2020-2032) (USD Million)
10.3.1.7.3 Romania Waterjet Cutting Machine Market Estimates and Forecasts, by Offering (2020-2032) (USD Million)
10.3.1.8 Hungary
10.3.1.8.1 Hungary Waterjet Cutting Machine Market Estimates and Forecasts, by Industry (2020-2032) (USD Million)
10.3.1.8.2 Hungary Waterjet Cutting Machine Market Estimates and Forecasts, by Product Tye (2020-2032) (USD Million)
10.3.1.8.3 Hungary Waterjet Cutting Machine Market Estimates and Forecasts, by Offering (2020-2032) (USD Million)
10.3.1.9 Turkey
10.3.1.9.1 Turkey Waterjet Cutting Machine Market Estimates and Forecasts, by Industry (2020-2032) (USD Million)
10.3.1.9.2 Turkey Waterjet Cutting Machine Market Estimates and Forecasts, by Product Tye (2020-2032) (USD Million)
10.3.1.9.3 Turkey Waterjet Cutting Machine Market Estimates and Forecasts, by Offering (2020-2032) (USD Million)
10.3.1.10 Rest of Eastern Europe
10.3.1.10.1 Rest of Eastern Europe Waterjet Cutting Machine Market Estimates and Forecasts, by Industry (2020-2032) (USD Million)
10.3.1.10.2 Rest of Eastern Europe Waterjet Cutting Machine Market Estimates and Forecasts, by Product Tye (2020-2032) (USD Million)
10.3.1.10.3 Rest of Eastern Europe Waterjet Cutting Machine Market Estimates and Forecasts, by Offering (2020-2032) (USD Million)
10.3.2 Western Europe
10.3.2.1 Trends Analysis
10.3.2.2 Western Europe Waterjet Cutting Machine Market Estimates and Forecasts, by Country (2020-2032) (USD Million)
10.3.2.3 Western Europe Waterjet Cutting Machine Market Estimates and Forecasts, by Industry (2020-2032) (USD Million)
10.3.2.4 Western Europe Waterjet Cutting Machine Market Estimates and Forecasts, by Product Tye (2020-2032) (USD Million)
10.3.2.5 Western Europe Waterjet Cutting Machine Market Estimates and Forecasts, by Offering (2020-2032) (USD Million)
10.3.2.6 Germany
10.3.2.6.1 Germany Waterjet Cutting Machine Market Estimates and Forecasts, by Industry (2020-2032) (USD Million)
10.3.2.6.2 Germany Waterjet Cutting Machine Market Estimates and Forecasts, by Product Tye (2020-2032) (USD Million)
10.3.2.6.3 Germany Waterjet Cutting Machine Market Estimates and Forecasts, by Offering (2020-2032) (USD Million)
10.3.2.7 France
10.3.2.7.1 France Waterjet Cutting Machine Market Estimates and Forecasts, by Industry (2020-2032) (USD Million)
10.3.2.7.2 France Waterjet Cutting Machine Market Estimates and Forecasts, by Product Tye (2020-2032) (USD Million)
10.3.2.7.3 France Waterjet Cutting Machine Market Estimates and Forecasts, by Offering (2020-2032) (USD Million)
10.3.2.8 UK
10.3.2.8.1 UK Waterjet Cutting Machine Market Estimates and Forecasts, by Industry (2020-2032) (USD Million)
10.3.2.8.2 UK Waterjet Cutting Machine Market Estimates and Forecasts, by Product Tye (2020-2032) (USD Million)
10.3.2.8.3 UK Waterjet Cutting Machine Market Estimates and Forecasts, by Offering (2020-2032) (USD Million)
10.3.2.9 Italy
10.3.2.9.1 Italy Waterjet Cutting Machine Market Estimates and Forecasts, by Industry (2020-2032) (USD Million)
10.3.2.9.2 Italy Waterjet Cutting Machine Market Estimates and Forecasts, by Product Tye (2020-2032) (USD Million)
10.3.2.9.3 Italy Waterjet Cutting Machine Market Estimates and Forecasts, by Offering (2020-2032) (USD Million)
10.3.2.10 Spain
10.3.2.10.1 Spain Waterjet Cutting Machine Market Estimates and Forecasts, by Industry (2020-2032) (USD Million)
10.3.2.10.2 Spain Waterjet Cutting Machine Market Estimates and Forecasts, by Product Tye (2020-2032) (USD Million)
10.3.2.10.3 Spain Waterjet Cutting Machine Market Estimates and Forecasts, by Offering (2020-2032) (USD Million)
10.3.2.11 Netherlands
10.3.2.11.1 Netherlands Waterjet Cutting Machine Market Estimates and Forecasts, by Industry (2020-2032) (USD Million)
10.3.2.11.2 Netherlands Waterjet Cutting Machine Market Estimates and Forecasts, by Product Tye (2020-2032) (USD Million)
10.3.2.11.3 Netherlands Waterjet Cutting Machine Market Estimates and Forecasts, by Offering (2020-2032) (USD Million)
10.3.2.12 Switzerland
10.3.2.12.1 Switzerland Waterjet Cutting Machine Market Estimates and Forecasts, by Industry (2020-2032) (USD Million)
10.3.2.12.2 Switzerland Waterjet Cutting Machine Market Estimates and Forecasts, by Product Tye (2020-2032) (USD Million)
10.3.2.12.3 Switzerland Waterjet Cutting Machine Market Estimates and Forecasts, by Offering (2020-2032) (USD Million)
10.3.2.13 Austria
10.3.2.13.1 Austria Waterjet Cutting Machine Market Estimates and Forecasts, by Industry (2020-2032) (USD Million)
10.3.2.13.2 Austria Waterjet Cutting Machine Market Estimates and Forecasts, by Product Tye (2020-2032) (USD Million)
10.3.2.13.3 Austria Waterjet Cutting Machine Market Estimates and Forecasts, by Offering (2020-2032) (USD Million)
10.3.2.14 Rest of Western Europe
10.3.2.14.1 Rest of Western Europe Waterjet Cutting Machine Market Estimates and Forecasts, by Industry (2020-2032) (USD Million)
10.3.2.14.2 Rest of Western Europe Waterjet Cutting Machine Market Estimates and Forecasts, by Product Tye (2020-2032) (USD Million)
10.3.2.14.3 Rest of Western Europe Waterjet Cutting Machine Market Estimates and Forecasts, by Offering (2020-2032) (USD Million)
10.4 Asia Pacific
10.4.1 Trends Analysis
10.4.2 Asia Pacific Waterjet Cutting Machine Market Estimates and Forecasts, by Country (2020-2032) (USD Million)
10.4.3 Asia Pacific Waterjet Cutting Machine Market Estimates and Forecasts, by Industry (2020-2032) (USD Million)
10.4.4 Asia Pacific Waterjet Cutting Machine Market Estimates and Forecasts, by Product Tye (2020-2032) (USD Million)
10.4.5 Asia Pacific Waterjet Cutting Machine Market Estimates and Forecasts, by Offering (2020-2032) (USD Million)
10.4.6 China
10.4.6.1 China Waterjet Cutting Machine Market Estimates and Forecasts, by Industry (2020-2032) (USD Million)
10.4.6.2 China Waterjet Cutting Machine Market Estimates and Forecasts, by Product Tye (2020-2032) (USD Million)
10.4.6.3 China Waterjet Cutting Machine Market Estimates and Forecasts, by Offering (2020-2032) (USD Million)
10.4.7 India
10.4.7.1 India Waterjet Cutting Machine Market Estimates and Forecasts, by Industry (2020-2032) (USD Million)
10.4.7.2 India Waterjet Cutting Machine Market Estimates and Forecasts, by Product Tye (2020-2032) (USD Million)
10.4.7.3 India Waterjet Cutting Machine Market Estimates and Forecasts, by Offering (2020-2032) (USD Million)
10.4.8 Japan
10.4.8.1 Japan Waterjet Cutting Machine Market Estimates and Forecasts, by Industry (2020-2032) (USD Million)
10.4.8.2 Japan Waterjet Cutting Machine Market Estimates and Forecasts, by Product Tye (2020-2032) (USD Million)
10.4.8.3 Japan Waterjet Cutting Machine Market Estimates and Forecasts, by Offering (2020-2032) (USD Million)
10.4.9 South Korea
10.4.9.1 South Korea Waterjet Cutting Machine Market Estimates and Forecasts, by Industry (2020-2032) (USD Million)
10.4.9.2 South Korea Waterjet Cutting Machine Market Estimates and Forecasts, by Product Tye (2020-2032) (USD Million)
10.4.9.3 South Korea Waterjet Cutting Machine Market Estimates and Forecasts, by Offering (2020-2032) (USD Million)
10.4.10 Vietnam
10.4.10.1 Vietnam Waterjet Cutting Machine Market Estimates and Forecasts, by Industry (2020-2032) (USD Million)
10.4.10.2 Vietnam Waterjet Cutting Machine Market Estimates and Forecasts, by Product Tye (2020-2032) (USD Million)
10.4.10.3 Vietnam Waterjet Cutting Machine Market Estimates and Forecasts, by Offering (2020-2032) (USD Million)
10.4.11 Singapore
10.4.11.1 Singapore Waterjet Cutting Machine Market Estimates and Forecasts, by Industry (2020-2032) (USD Million)
10.4.11.2 Singapore Waterjet Cutting Machine Market Estimates and Forecasts, by Product Tye (2020-2032) (USD Million)
10.4.11.3 Singapore Waterjet Cutting Machine Market Estimates and Forecasts, by Offering (2020-2032) (USD Million)
10.4.12 Australia
10.4.12.1 Australia Waterjet Cutting Machine Market Estimates and Forecasts, by Industry (2020-2032) (USD Million)
10.4.12.2 Australia Waterjet Cutting Machine Market Estimates and Forecasts, by Product Tye (2020-2032) (USD Million)
10.4.12.3 Australia Waterjet Cutting Machine Market Estimates and Forecasts, by Offering (2020-2032) (USD Million)
10.4.13 Rest of Asia Pacific
10.4.13.1 Rest of Asia Pacific Waterjet Cutting Machine Market Estimates and Forecasts, by Industry (2020-2032) (USD Million)
10.4.13.2 Rest of Asia Pacific Waterjet Cutting Machine Market Estimates and Forecasts, by Product Tye (2020-2032) (USD Million)
10.4.13.3 Rest of Asia Pacific Waterjet Cutting Machine Market Estimates and Forecasts, by Offering (2020-2032) (USD Million)
10.5 Middle East and Africa
10.5.1 Middle East
10.5.1.1 Trends Analysis
10.5.1.2 Middle East Waterjet Cutting Machine Market Estimates and Forecasts, by Country (2020-2032) (USD Million)
10.5.1.3 Middle East Waterjet Cutting Machine Market Estimates and Forecasts, by Industry (2020-2032) (USD Million)
10.5.1.4 Middle East Waterjet Cutting Machine Market Estimates and Forecasts, by Product Tye (2020-2032) (USD Million)
10.5.1.5 Middle East Waterjet Cutting Machine Market Estimates and Forecasts, by Offering (2020-2032) (USD Million)
10.5.1.6 UAE
10.5.1.6.1 UAE Waterjet Cutting Machine Market Estimates and Forecasts, by Industry (2020-2032) (USD Million)
10.5.1.6.2 UAE Waterjet Cutting Machine Market Estimates and Forecasts, by Product Tye (2020-2032) (USD Million)
10.5.1.6.3 UAE Waterjet Cutting Machine Market Estimates and Forecasts, by Offering (2020-2032) (USD Million)
10.5.1.7 Egypt
10.5.1.7.1 Egypt Waterjet Cutting Machine Market Estimates and Forecasts, by Industry (2020-2032) (USD Million)
10.5.1.7.2 Egypt Waterjet Cutting Machine Market Estimates and Forecasts, by Product Tye (2020-2032) (USD Million)
10.5.1.7.3 Egypt Waterjet Cutting Machine Market Estimates and Forecasts, by Offering (2020-2032) (USD Million)
10.5.1.8 Saudi Arabia
10.5.1.8.1 Saudi Arabia Waterjet Cutting Machine Market Estimates and Forecasts, by Industry (2020-2032) (USD Million)
10.5.1.8.2 Saudi Arabia Waterjet Cutting Machine Market Estimates and Forecasts, by Product Tye (2020-2032) (USD Million)
10.5.1.8.3 Saudi Arabia Waterjet Cutting Machine Market Estimates and Forecasts, by Offering (2020-2032) (USD Million)
10.5.1.9 Qatar
10.5.1.9.1 Qatar Waterjet Cutting Machine Market Estimates and Forecasts, by Industry (2020-2032) (USD Million)
10.5.1.9.2 Qatar Waterjet Cutting Machine Market Estimates and Forecasts, by Product Tye (2020-2032) (USD Million)
10.5.1.9.3 Qatar Waterjet Cutting Machine Market Estimates and Forecasts, by Offering (2020-2032) (USD Million)
10.5.1.10 Rest of Middle East
10.5.1.10.1 Rest of Middle East Waterjet Cutting Machine Market Estimates and Forecasts, by Industry (2020-2032) (USD Million)
10.5.1.10.2 Rest of Middle East Waterjet Cutting Machine Market Estimates and Forecasts, by Product Tye (2020-2032) (USD Million)
10.5.1.10.3 Rest of Middle East Waterjet Cutting Machine Market Estimates and Forecasts, by Offering (2020-2032) (USD Million)
10.5.2 Africa
10.5.2.1 Trends Analysis
10.5.2.2 Africa Waterjet Cutting Machine Market Estimates and Forecasts, by Country (2020-2032) (USD Million)
10.5.2.3 Africa Waterjet Cutting Machine Market Estimates and Forecasts, by Industry (2020-2032) (USD Million)
10.5.2.4 Africa Waterjet Cutting Machine Market Estimates and Forecasts, by Product Tye (2020-2032) (USD Million)
10.5.2.5 Africa Waterjet Cutting Machine Market Estimates and Forecasts, by Offering (2020-2032) (USD Million)
10.5.2.6 South Africa
10.5.2.6.1 South Africa Waterjet Cutting Machine Market Estimates and Forecasts, by Industry (2020-2032) (USD Million)
10.5.2.6.2 South Africa Waterjet Cutting Machine Market Estimates and Forecasts, by Product Tye (2020-2032) (USD Million)
10.5.2.6.3 South Africa Waterjet Cutting Machine Market Estimates and Forecasts, by Offering (2020-2032) (USD Million)
10.5.2.7 Nigeria
10.5.2.7.1 Nigeria Waterjet Cutting Machine Market Estimates and Forecasts, by Industry (2020-2032) (USD Million)
10.5.2.7.2 Nigeria Waterjet Cutting Machine Market Estimates and Forecasts, by Product Tye (2020-2032) (USD Million)
10.5.2.7.3 Nigeria Waterjet Cutting Machine Market Estimates and Forecasts, by Offering (2020-2032) (USD Million)
10.5.2.8 Rest of Africa
10.5.2.8.1 Rest of Africa Waterjet Cutting Machine Market Estimates and Forecasts, by Industry (2020-2032) (USD Million)
10.5.2.8.2 Rest of Africa Waterjet Cutting Machine Market Estimates and Forecasts, by Product Tye (2020-2032) (USD Million)
10.5.2.8.3 Rest of Africa Waterjet Cutting Machine Market Estimates and Forecasts, by Offering (2020-2032) (USD Million)
10.6 Latin America
10.6.1 Trends Analysis
10.6.2 Latin America Waterjet Cutting Machine Market Estimates and Forecasts, by Country (2020-2032) (USD Million)
10.6.3 Latin America Waterjet Cutting Machine Market Estimates and Forecasts, by Industry (2020-2032) (USD Million)
10.6.4 Latin America Waterjet Cutting Machine Market Estimates and Forecasts, by Product Tye (2020-2032) (USD Million)
10.6.5 Latin America Waterjet Cutting Machine Market Estimates and Forecasts, by Offering (2020-2032) (USD Million)
10.6.6 Brazil
10.6.6.1 Brazil Waterjet Cutting Machine Market Estimates and Forecasts, by Industry (2020-2032) (USD Million)
10.6.6.2 Brazil Waterjet Cutting Machine Market Estimates and Forecasts, by Product Tye (2020-2032) (USD Million)
10.6.6.3 Brazil Waterjet Cutting Machine Market Estimates and Forecasts, by Offering (2020-2032) (USD Million)
10.6.7 Argentina
10.6.7.1 Argentina Waterjet Cutting Machine Market Estimates and Forecasts, by Industry (2020-2032) (USD Million)
10.6.7.2 Argentina Waterjet Cutting Machine Market Estimates and Forecasts, by Product Tye (2020-2032) (USD Million)
10.6.7.3 Argentina Waterjet Cutting Machine Market Estimates and Forecasts, by Offering (2020-2032) (USD Million)
10.6.8 Colombia
10.6.8.1 Colombia Waterjet Cutting Machine Market Estimates and Forecasts, by Industry (2020-2032) (USD Million)
10.6.8.2 Colombia Waterjet Cutting Machine Market Estimates and Forecasts, by Product Tye (2020-2032) (USD Million)
10.6.8.3 Colombia Waterjet Cutting Machine Market Estimates and Forecasts, by Offering (2020-2032) (USD Million)
10.6.9 Rest of Latin America
10.6.9.1 Rest of Latin America Waterjet Cutting Machine Market Estimates and Forecasts, by Industry (2020-2032) (USD Million)
10.6.9.2 Rest of Latin America Waterjet Cutting Machine Market Estimates and Forecasts, by Product Tye (2020-2032) (USD Million)
10.6.9.3 Rest of Latin America Waterjet Cutting Machine Market Estimates and Forecasts, by Offering (2020-2032) (USD Million)
11. Company Profiles
11.1 Dardi International Corporation
11.1.1 Company Overview
11.1.2 Financial
11.1.3 Products/ Services Offered
11.1.4 SWOT Analysis
11.2 ESAB
11.2.1 Company Overview
11.2.2 Financial
11.2.3 Products/ Services Offered
11.2.4 SWOT Analysis
11.3 Flow International Corporation
11.3.1 Company Overview
11.3.2 Financial
11.3.3 Products/ Services Offered
11.3.4 SWOT Analysis
11.4 Hypertherm, Inc.,
11.4.1 Company Overview
11.4.2 Financial
11.4.3 Products/ Services Offered
11.4.4 SWOT Analysis
11.5 Jet Edge, Inc
11.5.1 Company Overview
11.5.2 Financial
11.5.3 Products/ Services Offered
11.5.4 SWOT Analysis
11.6 Koike Aronson, Inc.
11.6.1 Company Overview
11.6.2 Financial
11.6.3 Products/ Services Offered
11.6.4 SWOT Analysis
11.7 OMAX Corporation
11.7.1 Company Overview
11.7.2 Financial
11.7.3 Products/ Services Offered
11.7.4 SWOT Analysis
11.8 Resato International
11.8.1 Company Overview
11.8.2 Financial
11.8.3 Products/ Services Offered
11.8.4 SWOT Analysis
11.9 WARDJet
11.9.1 Company Overview
11.9.2 Financial
11.9.3 Products/ Services Offered
11.9.4 SWOT Analysis
11.10 KMT
11.10.1 Company Overview
11.10.2 Financial
11.10.3 Products/ Services Offered
11.10.4 SWOT Analysis
12. Use Cases and Best Practices
13. Conclusion
An accurate research report requires proper strategizing as well as implementation. There are multiple factors involved in the completion of good and accurate research report and selecting the best methodology to compete the research is the toughest part. Since the research reports we provide play a crucial role in any company’s decision-making process, therefore we at SNS Insider always believe that we should choose the best method which gives us results closer to reality. This allows us to reach at a stage wherein we can provide our clients best and accurate investment to output ratio.
Each report that we prepare takes a timeframe of 350-400 business hours for production. Starting from the selection of titles through a couple of in-depth brain storming session to the final QC process before uploading our titles on our website we dedicate around 350 working hours. The titles are selected based on their current market cap and the foreseen CAGR and growth.
The 5 steps process:
Step 1: Secondary Research:
Secondary Research or Desk Research is as the name suggests is a research process wherein, we collect data through the readily available information. In this process we use various paid and unpaid databases which our team has access to and gather data through the same. This includes examining of listed companies’ annual reports, Journals, SEC filling etc. Apart from this our team has access to various associations across the globe across different industries. Lastly, we have exchange relationships with various university as well as individual libraries.
Step 2: Primary Research
When we talk about primary research, it is a type of study in which the researchers collect relevant data samples directly, rather than relying on previously collected data. This type of research is focused on gaining content specific facts that can be sued to solve specific problems. Since the collected data is fresh and first hand therefore it makes the study more accurate and genuine.
We at SNS Insider have divided Primary Research into 2 parts.
Part 1 wherein we interview the KOLs of major players as well as the upcoming ones across various geographic regions. This allows us to have their view over the market scenario and acts as an important tool to come closer to the accurate market numbers. As many as 45 paid and unpaid primary interviews are taken from both the demand and supply side of the industry to make sure we land at an accurate judgement and analysis of the market.
This step involves the triangulation of data wherein our team analyses the interview transcripts, online survey responses and observation of on filed participants. The below mentioned chart should give a better understanding of the part 1 of the primary interview.
Part 2: In this part of primary research the data collected via secondary research and the part 1 of the primary research is validated with the interviews from individual consultants and subject matter experts.
Consultants are those set of people who have at least 12 years of experience and expertise within the industry whereas Subject Matter Experts are those with at least 15 years of experience behind their back within the same space. The data with the help of two main processes i.e., FGDs (Focused Group Discussions) and IDs (Individual Discussions). This gives us a 3rd party nonbiased primary view of the market scenario making it a more dependable one while collation of the data pointers.
Step 3: Data Bank Validation
Once all the information is collected via primary and secondary sources, we run that information for data validation. At our intelligence centre our research heads track a lot of information related to the market which includes the quarterly reports, the daily stock prices, and other relevant information. Our data bank server gets updated every fortnight and that is how the information which we collected using our primary and secondary information is revalidated in real time.
Step 4: QA/QC Process
After all the data collection and validation our team does a final level of quality check and quality assurance to get rid of any unwanted or undesired mistakes. This might include but not limited to getting rid of the any typos, duplication of numbers or missing of any important information. The people involved in this process include technical content writers, research heads and graphics people. Once this process is completed the title gets uploader on our platform for our clients to read it.
Step 5: Final QC/QA Process:
This is the last process and comes when the client has ordered the study. In this process a final QA/QC is done before the study is emailed to the client. Since we believe in giving our clients a good experience of our research studies, therefore, to make sure that we do not lack at our end in any way humanly possible we do a final round of quality check and then dispatch the study to the client.
Key Segments
By Industry
Electronics
Automotive
Aerospace
Metal Fabrication
Construction
Others
By Product Type
3D
Micro
Robotic
By Offerings
Hardware
Software
Services
Request for Segment Customization as per your Business Requirement: Segment Customization Request
Regional Coverage
North America
US
Canada
Mexico
Europe
Eastern Europe
Poland
Romania
Hungary
Turkey
Rest of Eastern Europe
Western Europe
Germany
France
UK
Italy
Spain
Netherlands
Switzerland
Austria
Rest of Western Europe
Asia Pacific
China
India
Japan
South Korea
Vietnam
Singapore
Australia
Rest of Asia Pacific
Middle East & Africa
Middle East
UAE
Egypt
Saudi Arabia
Qatar
Rest of the Middle East
Africa
Nigeria
South Africa
Rest of Africa
Latin America
Brazil
Argentina
Colombia
Rest of Latin America
Request for Country Level Research Report: Country Level Customization Request
Available Customization
With the given market data, SNS Insider offers customization as per the company’s specific needs. The following customization options are available for the report:
Product Analysis
Criss-Cross segment analysis (e.g. Product X Application)
Product Matrix which gives a detailed comparison of the product portfolio of each company
Geographic Analysis
Additional countries in any of the regions
Company Information
Detailed analysis and profiling of additional market players (Up to five)
The Pneumatic Tube System Market size was valued at USD 2.43 Billion in 2023 and is expected to reach USD 4.44 Billion by 2032 and grow at a CAGR of 7.40% over the forecast period 2024-2032.
The Membrane Bioreactor Market Size was esteemed at USD 4.01 billion in 2023 and is supposed to arrive at USD 5.46 billion by 2032 and develop at a CAGR of 10.5% over the forecast period 2024-2032.
The Smart Window Market Size was esteemed at USD 5.65 billion in 2023 and is supposed to arrive at USD 14.57 billion by 2032 and develop at a CAGR of 11.1% over the forecast period 2024-2032.
The Non-Destructive Testing Market size is expected to value USD 20.04 Billion in 2023 and is estimated to reach USD 38.32 Billion by 2032 with a growing CAGR of 7.47 % over the forecast period 2024-2032
The Smart Elevator Market size was estimated at USD 29.01 billion in 2023 and is expected to reach USD 64.04 billion by 2032 at a CAGR of 9.2% during the forecast period of 2024-2032.
The Food Processing and Handling Equipment Market size was estimated at USD 106.90 billion in 2022 and is expected to reach USD 163.24 billion by 2030 at a CAGR of 5.4% during the forecast period of 2023-2030.
Hi! Click one of our member below to chat on Phone