image

Wearable Fitness Technology Market Report Scope & Overview:
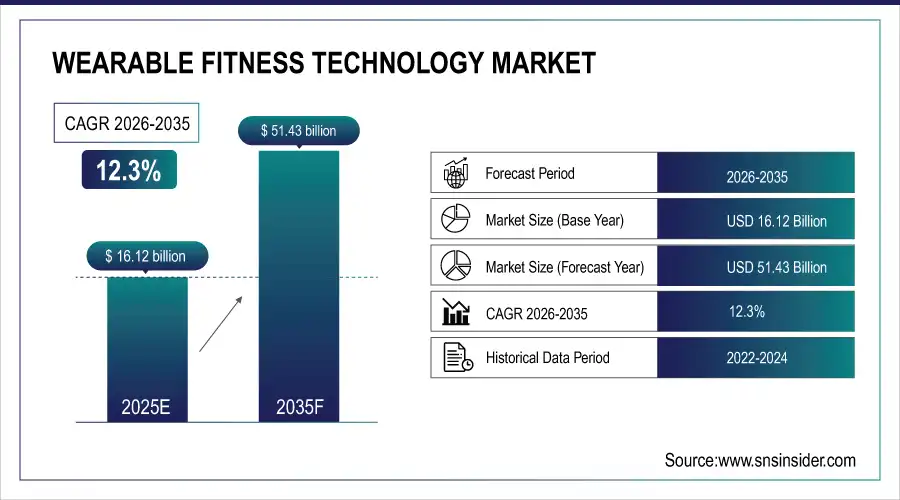
The Wearable Fitness Technology Market Size was valued at USD 14.59 billion in 2024 and is expected to reach USD 36.95 billion by 2032 and grow at a CAGR of 12.3% over the forecast period 2025-2032.

Wearable Fitness Technology Market is the innovation of newer technologies that enable people to keep an eye on health and fitness using sensor technology, AI, connectivity, etc., and is in a constant state of evolution. Wearable technology encompasses a wide range of devices smartwatches, fitness bands, and even smart clothing, to give you immediate information about heart rate, sleep, and activity levels. The growing health consciousness, the increasing adoption of fitness apps, and a rising demand for personalized wellness solutions are fuelling the market growth. Seamless integration with smartphones and healthcare platforms brings an even higher user experience and data integrity. Innovations are underway to further ramp up this market and allow patients and physicians to make more informed and proactive health choices.

According to research, in 2023, smartwatches became the favorite wearable devices among 75% of users due to their multi-functional facilities such as fitness tracking, health monitoring, etc. Coming in second place were fitness tracker watches with a 34% share. Smart rings are another growing category; Oura, a leader in the space, has shipped more than 2.5 million devices since launch. Moreover, the wrist worn segment is expected to hold 43.4% share of the wearable fitness tracker market by 2024. Such trends are part of a bigger movement towards personal health tracking, as consumers continue to adopt wearable technology to track various aspects of health and well-being, and the desire for other, personalized tracking solutions grows strong.

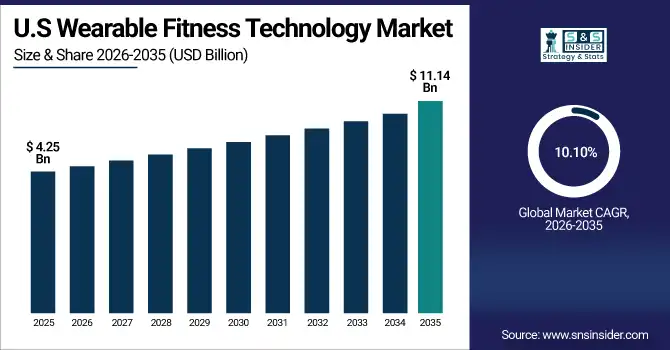
The U.S. Wearable Fitness Technology Market size was USD 3.85 billion in 2024 and is expected to reach USD 8.33 billion by 2032, growing at a CAGR of 10.10% over the forecast period of 2025–2032. The U.S. wearable fitness technology market analysis is expected to the increase in health consciousness and fitness awareness among consumers, high smartphone penetration, and the rapid integration of advanced sensors and artificial intelligence (AI). Owing to its healthy technology infrastructure, adoption of innovations, and a significant number of key players, the U.S. leads North America, and the U.S. ecosystem ensures an ongoing supply of new products and constant demand from consumers.

Market Dynamics

Key Drivers:

  • Growing Demand for Eco-Friendly Products in Various Industries Boosts Wearable Fitness Technology Market Growth

The growing demand for eco-friendly products among consumers in various industries is driving the growth of the wearable fitness technology industry. With sustainability taking center stage in 2024, manufacturers are investing in design principles that employ recycled materials and components that consume energy efficiently to help reduce their carbon footprints. For Instance, Garmin's "Venu 2S Eco Edition" smartwatch is made from recycled materials and can charge with sunlight, which matches consumers' environmental identity. Not only does this transition align with what we want out of an environmental perspective, but it also caters to the preferences of environmentally active purchasers, which leads to further market growth. With sensitivity about the environment increasing, we expect the designs of wearables utilizing eco-friendly practices to be a major influencer on the future direction of the market.

Restraints:

  • Data Privacy and Security Concerns Hinder Wearable Fitness Technology Market Expansion

Widespread concerns regarding data privacy and security pose major impediments to the expansion of the wearable fitness technology market. In 2024, a study found that 80 percent of fitness apps convey user information to third parties, invoking sensitive data, including health metrics and personally identifiable information. Highly publicized sharing of data has consumers concerned that their personal information will be misused. Moreover, inadequate regulation on data privacy within wearable tech can create even more fear and apprehension, leading more people to refuse to adapt to these devices. Manufacturers need to deploy stringent data protection practices and transparent data management to restore consumer confidence and contribute to market expansion.

Opportunities:

  • Integration of AI and Machine Learning Enhances Personalization in Wearable Fitness Technology

Artificial Intelligence (AI) and Machine Learning (ML) integration: AI and machine learning (ML) have massive prospects in the wearable fitness technology market. Digital physical therapy company Hinge Health announced in May 2025 that it is using AI to automate care delivery and improve patient outcomes. The company is focused on reducing clinician hours and scaling into other areas of care using AI-powered motion tracking and care coordination tools. The news highlights the ability of AI and ML to offer personalized user experiences, deliver timely health information, and boost general health. The incorporation of AI and ML technology will pave the way for innovation in wearable fitness devices, as anticipated by the expansion in the wearable fitness devices market.

Challenges:

  • Limited Battery Life Impedes Continuous Usage of Wearable Fitness Devices

The wearable fitness technology market trend is the limitation of battery life in devices. Despite notable advancements in power-efficient components and smarter energy management systems, many fitness wearables still require daily or frequent charging. This affects the user experience, particularly for those relying on continuous health monitoring features like sleep tracking or 24/7 heart rate analysis. For active users or individuals with medical monitoring needs, interruptions due to battery constraints can be frustrating and disruptive. Moreover, the inclusion of more advanced sensors and connectivity features such as GPS, Wi-Fi, and LTE further strains battery performance. Addressing this challenge requires a holistic approach combining hardware innovation, software optimization, and perhaps user education on power-saving modes. Until a breakthrough in battery technology is achieved, limited battery life remains a persistent hurdle in ensuring a seamless and uninterrupted wearable experience.

Segmentation Analysis:

By Component

Sensors led the wearable fitness technology market with a 22% revenue share in 2024, as these devices primarily determine physiological metrics, such as heart rate, movement, and temperature. The latest smartwatches launched by companies like Apple and Garmin bring in new sensors with better accuracy, thereby improving health monitoring. This ever-increasing demand for near-real-time data and accuracy has led to sensor innovation through the continuous introduction of new sensors, making them ubiquitous in wearable fitness products, and exploiting their use in personal health and medical applications.

Power management components, which are among the fastest growing components, in fitness wearables as manufacturers try to improve battery life and efficiency. This is also highlighted by the recent moves from Sony and Xiaomi with their low-power chipsets and smart battery optimization systems. Wearables are being packed with features but using them adds to the energy consumption and that needs to be lifetime provisioned with usage.

By Product

In 2024, smartwatches account for 47% of the market, as multifunctionality, eye-catching designs, and health-oriented capabilities are crucial. The past year has seen Apple, Fitbit, and Samsung update their respective smartwatch lines with ECG monitoring, sleep analysis, and personalized coaching. Smartwatches have gained more popularity with the growing fitness awareness among people, and smart tracking of health remotely, seamless integration with smartphones is increasing their usability.

The demand for smartshirts and jackets is growing at a high rate, CAGR of 15.24%, due to increasing interest in wearable textiles used to provide biometric tracking without the discomfort associated with wearing non-flexible devices against the skin. Sensor-embedded garments are coming from companies like Hexoskin and Ralph Lauren that provide ECG, respiration, and movement data. Such products are now finding traction with athletes and healthcare practitioners for near-real-time analytics on the human body.
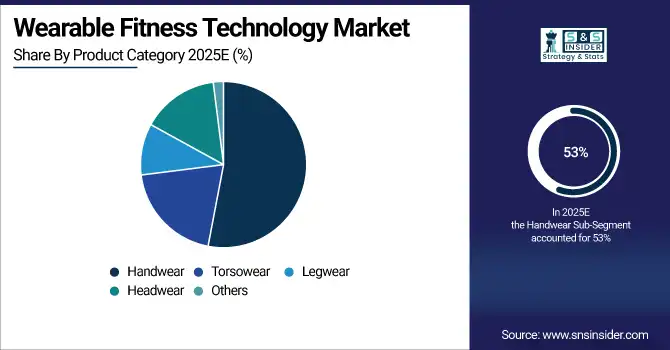
By Product Category

Handwear dominates product category share at 53% in 2024, largely due to the popularity of wrist-worn devices like smartwatches and fitness bands. Such instruments have a simple interface, continuous health monitoring, and mobile connectivity as well. Driven by the launch of high-end models with built-in GPS and health analytics from companies like Garmin and Huawei, the segment continues to grow. With the evolution of functional capabilities, strong market preferences secure handwear as the current dominating form factor for the wearable fitness tech ecosystem, with its convenience of usage.

Legwear wearables are experiencing the fastest growth with a 15.51% CAGR, powered by innovations in the form of smart leggings and socks that can detect muscle activity, posture, and step quality. With startups and fitness brands launching runner-focused products, as well as physical therapy and back pain posture ranges. Such devices provide biomechanical feedback to help with athletic training and injury prevention. With an emphasis on lower-body fit and recovery assistance,  this legwear sets the stage for legwear to be the next great category in the wearable fitness technology market.

Regional Analysis:

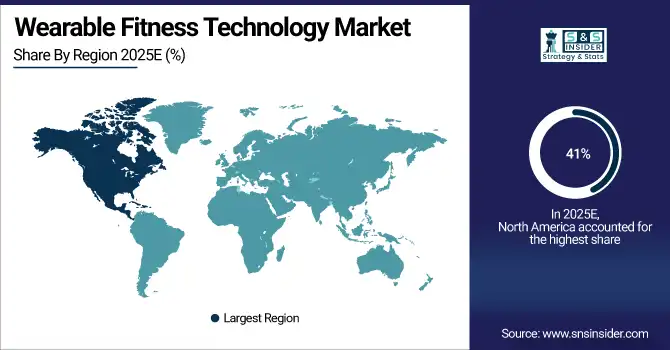
The North America Region accounted for a Wearable Fitness Technology Market Share of 41% in 2024. Regional markets are led by high consumer health awareness, early technology adoption, and the incorporation of wearables in fitness, insurance, and healthcare. The North American market is further segmented into the U.S., Canada, and Mexico. U.S. consumers are utilizing smartwatches and fitness bands more than before to monitor their health proactively. Market expansion is enhanced by ongoing innovations from domestic technology giants and increasing collaborations with healthcare providers, cementing the U.S. as the regional engine of growth.

Asia Pacific Fastest the fastest-growing region in 2024, and the CAGR is 15.17%. Wearable adoption in Asian economies with high populations is being expedited by rapid digitalization, coupled with an expanding middle class and growing fitness trend. India, as the fastest-growing market in Asia, has seen a good tech environment, where health-conscious behaviour is developing. Foreign brands are introducing affordable, innovative wearables specifically for local consumers. Increased consumer dependence on fitness technologies complements the country’s increasing attention towards AI and data-driven healthcare. Due to high rates of smartphone penetration and a growing fitness culture amongst younger age groups, China is the regional leader in wearable technology market uptake.

In 2024, Europe’s market is steadily expanding, led by Germany, which dominates due to its advanced healthcare system and strong focus on preventive health. In 2024, Europe’s Market is steadily expanding, led by Germany, which dominates due to its advanced healthcare system and strong focus on preventive health. Government healthcare digitization efforts and rising preventive health awareness are driving wearable fitness technology adoption across key European markets. German consumers increasingly adopt wearable devices for fitness tracking and chronic disease management. The country’s robust manufacturing base and innovation in sensor technologies further bolster market growth. Increasing government initiatives to promote digital health and rising health awareness across Europe are also contributing to the wider adoption of wearable fitness technologies throughout the region.

The MEA has seen a rise in awareness of health and fitness, and with urban centers seeing a surge in the popularity of smartwatches, this market is also expected to grow considerably. Gulf countries are also spending on digital health infrastructure, as well as initiatives aimed at health and wellness. Other contributors include South Africa and the UAE, with fitness culture and personal tracking interests accordingly. In Latin America (LA) is expanding, primarily thanks to Brazil and Mexico. Adoption is being driven by increased smartphone usage, fitness trends from social media, and the launch of smart bands at low price points. Wearables for lifestyle and wellness improvement have been embraced by urban consumers.

Key Players:

The Wearable Fitness Technology Market companies are Apple Inc., Fitbit (Google), Garmin Ltd., Samsung Electronics, Huawei Technologies Co., Xiaomi Corporation, Whoop, Inc., Amazfit (Zepp Health Corporation), Polar Electro Oy, Oura Health Ltd., and others.

Recent Developments:

  • September 2024: Apple unveiled the Apple Watch Series 10, featuring a sleep apnea detection capability (pending FDA approval), enhanced fitness tracking for activities like kayaking and rowing, and a faster-charging battery. The device was released on September 20, 2024.

  • August 2024: Google announced a strategic shift, focusing on the Pixel Watch as its primary smartwatch offering. Consequently, there are no plans to release successors to the Fitbit Sense and Versa series. Fitbit will continue to produce fitness trackers, emphasizing simplicity and long battery life.

  • November 2023: Garmin received six CES 2024 Innovation Awards, including a Best of Innovation honor, for its advanced fitness and health smartwatches like the Venu 3, epix Pro, and MARQ Golfer—Carbon Edition. These accolades highlight Garmin's commitment to innovation in wearable fitness technology.

Wearable Fitness Technology Market Report Scope:

Report Attributes Details
Market Size in 2024 USD 14.59 Billion 
Market Size by 2032 USD 36.95 Billion 
CAGR CAGR of 12.3% From 2025 to 2032
Base Year 2024
Forecast Period 2025-2032
Historical Data 2021-2023
Report Scope & Coverage Market Size, Segments Analysis, Competitive Landscape, Regional Analysis, DROC & SWOT Analysis, Forecast Outlook
Key Segments • By Component (Displays, Processors, Memory Chips, Power Management Components, Networking Components, User Interface Components, Sensors, Mechanical Components, Others)
• By Product (Smartwatch, Wristband, Smartshoe, Smartshirt/Jacket, Headband/Smartcap, Others)
• By Product Category (Handwear, Torsowear, Legwear, Headwear, Others)
Regional Analysis/Coverage North America (US, Canada, Mexico), Europe (Germany, France, UK, Italy, Spain, Poland, Turkey, Rest of Europe), Asia Pacific (China, India, Japan, South Korea, Singapore, Australia, Taiwan,  Rest of Asia Pacific), Middle East & Africa (UAE, Saudi Arabia, Qatar, South Africa, Rest of Middle East & Africa), Latin America (Brazil, Argentina, Rest of Latin America)
Company Profiles Apple Inc., Fitbit (Google), Garmin Ltd., Samsung Electronics, Huawei Technologies Co., Xiaomi Corporation, Whoop, Inc., Amazfit (Zepp Health Corporation), Polar Electro Oy, Oura Health Ltd., and Others.

Frequently Asked Questions

Ans: The Wearable Fitness Technology Market is expected to grow at a CAGR of 12.3% during 2025-2032.

Ans: The Wearable Fitness Technology Market size was USD 14.59 billion in 2024 and is expected to reach USD 36.95 billion by 2032.

Ans: The major growth factor of the Wearable Fitness Technology Market is the increasing consumer focus on health monitoring and personalized fitness tracking.

Ans: The Sensors segment dominated the Wearable Fitness Technology Market.

Ans: North America dominated the Wearable Fitness Technology Market in 2024.

Table of Contents

1. Introduction

1.1 Market Definition

1.2 Scope (Inclusion and Exclusions)

1.3 Research Assumptions

2. Executive Summary

2.1 Market Overview

2.2 Regional Synopsis

2.3 Competitive Summary

3. Research Methodology

3.1 Top-Down Approach

3.2 Bottom-up Approach

3.3. Data Validation

3.4 Primary Interviews

4. Market Dynamics Impact Analysis

4.1 Market Driving Factors Analysis

4.1.1 Drivers

4.1.2 Restraints

4.1.3 Opportunities

4.1.4 Challenges

4.2 PESTLE Analysis

4.3 Porter’s Five Forces Model

5. Statistical Insights and Trends Reporting

5.1 User Demographics & Behavior Analytics

5.2 Device Penetration and Adoption Trends by Region

5.3 Unit Shipments & Installed Base Forecast

5.4 Product Return, Failure, and Replacement Rates

6. Competitive Landscape

6.1 List of Major Companies, By Region

6.2 Market Share Analysis, By Region

6.3 Product Benchmarking

6.3.1 Product specifications and features

6.3.2 Pricing

6.4 Strategic Initiatives

6.4.1 Marketing and promotional activities

6.4.2 Distribution and Supply Chain Strategies

6.4.3 Expansion plans and new Product launches

6.4.4 Strategic partnerships and collaborations

6.5 Technological Advancements

6.6 Market Positioning and Branding

7. Wearable Fitness Technology Market Segmentation By Component

7.1 Chapter Overview

7.2 Displays

7.2.1 Displays Market Trends Analysis (2021-2032)

7.2.2 Displays Market Size Estimates and Forecasts to 2032 (USD Billion)

7.3 Processors

     7.3.1 Processors Market Trends Analysis (2021-2032)

           7.3.2 Processors Market Size Estimates and Forecasts to 2032 (USD Billion)

7.4 Memory Chips

     7.4.1 Memory Chips Market Trends Analysis (2021-2032)

           7.4.2 Memory Chips Market Size Estimates and Forecasts to 2032 (USD Billion)

7.5 Power Management Components

     7.5.1 Power Management Components Market Trends Analysis (2021-2032)

           7.5.2 Power Management Components Market Size Estimates and Forecasts to 2032 (USD Billion)

7.6 Networking Components

     7.6.1 Networking Components Market Trends Analysis (2021-2032)

           7.6.2 Networking Components Market Size Estimates and Forecasts to 2032 (USD Billion)

7.7 User Interface Components

     7.7.1 User Interface Components Market Trends Analysis (2021-2032)

           7.7.2 User Interface Components Market Size Estimates and Forecasts to 2032 (USD Billion)

7.8 Sensors

     7.8.1 Sensors Market Trends Analysis (2021-2032)

           7.8.2 Sensors Market Size Estimates and Forecasts to 2032 (USD Billion)

7.9 Mechanical Components

     7.9.1 Mechanical Components Market Trends Analysis (2021-2032)

           7.9.2 Mechanical Components Market Size Estimates and Forecasts to 2032 (USD Billion)

7.10 Others

     7.10.1 Others Market Trends Analysis (2021-2032)

           7.10.2 Others Market Size Estimates and Forecasts to 2032 (USD Billion)

8. Wearable Fitness Technology Market Segmentation By Product

8.1 Chapter Overview

8.2 Smartwatch

     8.2.1 Smartwatch Market Trend Analysis (2021-2032)

           8.2.2 Smartwatch Market Size Estimates and Forecasts to 2032 (USD Billion)

8.3 Wristband

      8.3.1 Wristband Market Trends Analysis (2021-2032)

           8.3.2 Wristband Market Size Estimates and Forecasts to 2032 (USD Billion)

8.4 Smartshoe

      8.4.1 Smartshoe Market Trends Analysis (2021-2032)

           8.4.2 Smartshoe Market Size Estimates and Forecasts to 2032 (USD Billion)

8.5 Smartshirt/Jacket

      8.5.1 Smartshirt/Jacket Market Trends Analysis (2021-2032)

           8.5.2 Smartshirt/Jacket Market Size Estimates and Forecasts to 2032 (USD Billion)

8.6 Headband/Smartcap

      8.6.1 Headband/Smartcap Market Trends Analysis (2021-2032)

           8.6.2 Headband/Smartcap Market Size Estimates and Forecasts to 2032 (USD Billion)

8.7 Others

      8.7.1 Others Market Trends Analysis (2021-2032)

           8.7.2 Others Market Size Estimates and Forecasts to 2032 (USD Billion)

9. Wearable Fitness Technology Market Segmentation By Product Category

9.1 Chapter Overview

9.2 Handwear

        9.2.1 Handwear Market Trends Analysis (2021-2032)

9.2.2 Handwear Market Size Estimates and Forecasts to 2032 (USD Billion)

9.3 Torsowear

        9.3.1 Torsowear Market Trends Analysis (2021-2032)

9.3.2 Torsowear Market Size Estimates and Forecasts to 2032 (USD Billion)

9.4 Legwear

        9.4.1 Legwear Market Trends Analysis (2021-2032)

9.4.2 Legwear Market Size Estimates and Forecasts to 2032 (USD Billion)

9.5 Headwear

        9.5.1 Headwear Market Trends Analysis (2021-2032)

9.5.2 Headwear Market Size Estimates and Forecasts to 2032 (USD Billion)

9.6 Others

        9.6.1 Others Market Trends Analysis (2021-2032)

9.6.2 Others Market Size Estimates and Forecasts to 2032 (USD Billion)

10. Regional Analysis

10.1 Chapter Overview

10.2 North America

10.2.1 Trends Analysis

10.2.2 North America Wearable Fitness Technology Market Estimates and Forecasts, by Country (2021-2032) (USD Billion)

10.2.3 North America Wearable Fitness Technology Market Estimates and Forecasts, By Component (2021-2032) (USD Billion) 

10.2.4 North America Wearable Fitness Technology Market Estimates and Forecasts, By Product (2021-2032) (USD Billion)

10.2.5 North America Wearable Fitness Technology Market Estimates and Forecasts, By Product Category (2021-2032) (USD Billion)

10.2.6 USA

10.2.6.1 USA Wearable Fitness Technology Market Estimates and Forecasts, By Component (2021-2032) (USD Billion)

10.2.6.2 USA Wearable Fitness Technology Market Estimates and Forecasts, By Product (2021-2032) (USD Billion)

10.2.6.3 USA Wearable Fitness Technology Market Estimates and Forecasts, By Product Category (2021-2032) (USD Billion)

10.2.7 Canada

10.2.7.1 Canada Wearable Fitness Technology Market Estimates and Forecasts, By Component (2021-2032) (USD Billion)

10.2.7.2 Canada Wearable Fitness Technology Market Estimates and Forecasts, By Product (2021-2032) (USD Billion)

10.2.7.3 Canada Wearable Fitness Technology Market Estimates and Forecasts, By Product Category (2021-2032) (USD Billion)

10.2.8 Mexico

10.2.8.1 Mexico Wearable Fitness Technology Market Estimates and Forecasts, By Component (2021-2032) (USD Billion)

10.2.8.2 Mexico Wearable Fitness Technology Market Estimates and Forecasts, By Product (2021-2032) (USD Billion)

10.2.8.3 Mexico Wearable Fitness Technology Market Estimates and Forecasts, By Product Category (2021-2032) (USD Billion)

10.3 Europe

10.3.1 Trends Analysis

10.3.2 Europe Wearable Fitness Technology Market Estimates and Forecasts, by Country (2021-2032) (USD Billion)

10.3.3 Europe Wearable Fitness Technology Market Estimates and Forecasts, By Component (2021-2032) (USD Billion) 

10.3.4 Europe Wearable Fitness Technology Market Estimates and Forecasts, By Product (2021-2032) (USD Billion)

10.3.5 Europe Wearable Fitness Technology Market Estimates and Forecasts, By Product Category(2021-2032) (USD Billion)

10.3.6 Germany

10.3.1.6.1 Germany Wearable Fitness Technology Market Estimates and Forecasts, By Component (2021-2032) (USD Billion)

10.3.1.6.2 Germany Wearable Fitness Technology Market Estimates and Forecasts, By Product (2021-2032) (USD Billion)

10.3.1.6.3 Germany Wearable Fitness Technology Market Estimates and Forecasts, By Product Category (2021-2032) (USD Billion)

10.3.7 France

10.3.7.1 France Wearable Fitness Technology Market Estimates and Forecasts, By Component (2021-2032) (USD Billion)

10.3.7.2 France a Wearable Fitness Technology Market Estimates and Forecasts, By Product (2021-2032) (USD Billion)

10.3.7.3 France Wearable Fitness Technology Market Estimates and Forecasts, By Product Category (2021-2032) (USD Billion)

10.3.8 UK

10.3.8.1 UK Wearable Fitness Technology Market Estimates and Forecasts, By Component (2021-2032) (USD Billion)

10.3.8.2 UK Wearable Fitness Technology Market Estimates and Forecasts, By Product (2021-2032) (USD Billion)

10.3.8.3 UK Wearable Fitness Technology Market Estimates and Forecasts, By Product Category (2021-2032) (USD Billion)

10.3.9 Italy

10.3.9.1 Italy Wearable Fitness Technology Market Estimates and Forecasts, By Component (2021-2032) (USD Billion)

10.3.9.2 Italy Wearable Fitness Technology Market Estimates and Forecasts, By Product (2021-2032) (USD Billion)

10.3.9.3 Italy Wearable Fitness Technology Market Estimates and Forecasts, By Product Category (2021-2032) (USD Billion)

10.3.10 Spain

10.3.10.1 Spain Wearable Fitness Technology Market Estimates and Forecasts, By Component (2021-2032) (USD Billion)

10.3.10.2 Spain Wearable Fitness Technology Market Estimates and Forecasts, By Product (2021-2032) (USD Billion)

10.3.10.3 Spain Wearable Fitness Technology Market Estimates and Forecasts, By Product Category (2021-2032) (USD Billion)

10.3.12 Poland

10.3.12.1 Poland Wearable Fitness Technology Market Estimates and Forecasts, by Country (2021-2032) (USD Billion)

10.3.12.1 Poland Wearable Fitness Technology Market Estimates and Forecasts, By Component (2021-2032) (USD Billion) 

10.3.12.3 Poland Wearable Fitness Technology Market Estimates and Forecasts, By Product (2021-2032) (USD Billion)

10.3.12.3 Poland Wearable Fitness Technology Market Estimates and Forecasts, By Product Category (2021-2032) (USD Billion)

10.3.13 Turkey

10.3.13.1 Turkey Wearable Fitness Technology Market Estimates and Forecasts, By Component (2021-2032) (USD Billion)

10.3.13.2 Turkey Wearable Fitness Technology Market Estimates and Forecasts, By Product (2021-2032) (USD Billion)

10.3.13.3 Turkey Wearable Fitness Technology Market Estimates and Forecasts, By Product Category (2021-2032) (USD Billion)

10.3.14 Rest of Europe

10.3.14.1 Rest of Europe Wearable Fitness Technology Market Estimates and Forecasts, By Component (2021-2032) (USD Billion)

10.3.14.2 Rest of Europe Wearable Fitness Technology Market Estimates and Forecasts, By Product (2021-2032) (USD Billion)

10.3.14.3 Rest of Europe Wearable Fitness Technology Market Estimates and Forecasts, By Product Category(2021-2032) (USD Billion)

10.4 Asia-Pacific

10.4.1 Trends Analysis

  10.4.2 Asia-Pacific Wearable Fitness Technology Market Estimates and Forecasts, by Country (2021-2032) (USD Billion)

 10.4.3 Asia-Pacific Wearable Fitness Technology Market Estimates and Forecasts, By Component (2021-2032) (USD Billion) 

 10.4.4 Asia-Pacific Wearable Fitness Technology Market Estimates and Forecasts, By Product (2021-2032) (USD Billion)

 10.4.5 Asia-Pacific Wearable Fitness Technology Market Estimates and Forecasts, By Product Category (2021-2032) (USD Billion)

10.4.6 China

10.4.6.1 China Wearable Fitness Technology Market Estimates and Forecasts, By Component (2021-2032) (USD Billion)

10.4.6.2 China Wearable Fitness Technology Market Estimates and Forecasts, By Product (2021-2032) (USD Billion)

10.4.6.3 China Wearable Fitness Technology Market Estimates and Forecasts, By Product Category (2021-2032) (USD Billion)

10.4.7 India

10.4.7.1 India Wearable Fitness Technology Market Estimates and Forecasts, By Component (2021-2032) (USD Billion)

10.4.7.2 India Wearable Fitness Technology Market Estimates and Forecasts, By Product (2021-2032) (USD Billion)

10.4.7.3 India Wearable Fitness Technology Market Estimates and Forecasts, By Product Category (2021-2032) (USD Billion)

10.4.8 Japan

10.4.8.1 Japan Wearable Fitness Technology Market Estimates and Forecasts, By Component (2021-2032) (USD Billion)

10.4.8.2 Japan Wearable Fitness Technology Market Estimates and Forecasts, By Product (2021-2032) (USD Billion)

10.4.8.3 Japan Wearable Fitness Technology Market Estimates and Forecasts, By Product Category (2021-2032) (USD Billion)

10.4.9 South Korea

10.4.9.1 South Korea Wearable Fitness Technology Market Estimates and Forecasts, By Component (2021-2032) (USD Billion)

10.4.9.2 South Korea Wearable Fitness Technology Market Estimates and Forecasts, By Product (2021-2032) (USD Billion)

10.4.9.3 South Korea Wearable Fitness Technology Market Estimates and Forecasts, By Product Category (2021-2032) (USD Billion)

10.4.10 Singapore

10.4.10.1 Singapore Wearable Fitness Technology Market Estimates and Forecasts, By Component (2021-2032) (USD Billion)

10.4.10.2 Singapore Wearable Fitness Technology Market Estimates and Forecasts, By Product (2021-2032) (USD Billion)

10.4.10.3 Singapore Wearable Fitness Technology Market Estimates and Forecasts, By Product Category (2021-2032) (USD Billion)

10.4.11 Australia

10.4.11.1 Australia Wearable Fitness Technology Market Estimates and Forecasts, By Component (2021-2032) (USD Billion)

10.4.11.2 Australia Wearable Fitness Technology Market Estimates and Forecasts, By Product (2021-2032) (USD Billion)

10.4.11.3 Australia Wearable Fitness Technology Market Estimates and Forecasts, By Product Category (2021-2032) (USD Billion)

10.4.12 Rest of Asia-Pacific

10.4.12.1 Rest of Asia-Pacific Wearable Fitness Technology Market Estimates and Forecasts, By Component (2021-2032) (USD Billion)

10.4.12.2 Rest of Asia-Pacific Wearable Fitness Technology Market Estimates and Forecasts, By Product (2021-2032) (USD Billion)

10.4.12.3 Rest of Asia-Pacific Wearable Fitness Technology Market Estimates and Forecasts, By Product Category (2021-2032) (USD Billion)

10.5 Middle East and Africa

10.5.1 Trends Analysis

10.5.2 Middle East and Africa East Wearable Fitness Technology Market Estimates and Forecasts, by Country (2021-2032) (USD Billion)

10.5.3Middle East and Africa Wearable Fitness Technology Market Estimates and Forecasts, By Component (2021-2032) (USD Billion) 

10.5.4 Middle East and Africa Wearable Fitness Technology Market Estimates and Forecasts, By Product (2021-2032) (USD Billion)

10.5.5 Middle East and Africa Wearable Fitness Technology Market Estimates and Forecasts, By Product Category (2021-2032) (USD Billion)

10.5.6 UAE

10.5.6.1 UAE Wearable Fitness Technology Market Estimates and Forecasts, By Component (2021-2032) (USD Billion)

10.5.6.2 UAE Wearable Fitness Technology Market Estimates and Forecasts, By Product (2021-2032) (USD Billion)

10.5.6.3 UAE Wearable Fitness Technology Market Estimates and Forecasts, By Product Category (2021-2032) (USD Billion)

10.5.7 Saudi Arabia

10.5.7.1 Saudi Arabia Wearable Fitness Technology Market Estimates and Forecasts, By Component (2021-2032) (USD Billion)

10.5.7.2 Saudi Arabia Wearable Fitness Technology Market Estimates and Forecasts, By Product (2021-2032) (USD Billion)

10.5.7.3 Saudi Arabia Wearable Fitness Technology Market Estimates and Forecasts, By Product Category (2021-2032) (USD Billion)

10.5.8 Qatar

10.5.8.1 Qatar Wearable Fitness Technology Market Estimates and Forecasts, By Component (2021-2032) (USD Billion)

10.5.8.2 Qatar Wearable Fitness Technology Market Estimates and Forecasts, By Product (2021-2032) (USD Billion)

10.5.8.3 Qatar Wearable Fitness Technology Market Estimates and Forecasts, By Product Category (2021-2032) (USD Billion)

10.5.9 South Africa

10.5.9 1 South Africa Wearable Fitness Technology Market Estimates and Forecasts, By Component (2021-2032) (USD Billion)

10.5.9 2 South Africa Wearable Fitness Technology Market Estimates and Forecasts By Product (2021-2032) (USD Billion)

10.5.9 3 South Africa Wearable Fitness Technology Market Estimates and Forecasts, By Product Category (2021-2032) (USD Billion)

10.5.10 Rest of Middle East & Africa

10.5.10.1 Rest of Middle East & Africa Wearable Fitness Technology Market Estimates and Forecasts, By Component (2021-2032) (USD Billion)

10.5.10.2 Rest of Middle East & Africa Wearable Fitness Technology Market Estimates and Forecasts, By Product (2021-2032) (USD Billion)

10.5.10.3 Rest of Middle East & Africa Wearable Fitness Technology Market Estimates and Forecasts, By Product Category (2021-2032) (USD Billion)

10.6 Latin America

10.6.1 Trends Analysis

10.6.2 Latin America Wearable Fitness Technology Market Estimates and Forecasts, by Country (2021-2032) (USD Billion)

10.6.3 Latin America Wearable Fitness Technology Market Estimates and Forecasts, By Component (2021-2032) (USD Billion) 

10.6.4 Latin America Wearable Fitness Technology Market Estimates and Forecasts, By Product (2021-2032) (USD Billion)

10.6.5 Latin America Wearable Fitness Technology Market Estimates and Forecasts, By Product Category (2021-2032) (USD Billion)

10.6.6 Brazil

10.6.6.1 Brazil Wearable Fitness Technology Market Estimates and Forecasts, By Component (2021-2032) (USD Billion)

10.6.6.2 Brazil Wearable Fitness Technology Market Estimates and Forecasts, By Product (2021-2032) (USD Billion)

10.6.6.3 Brazil Wearable Fitness Technology Market Estimates and Forecasts, By Product Category (2021-2032) (USD Billion)

10.6.7 Argentina

10.6.7.1 Argentina Wearable Fitness Technology Market Estimates and Forecasts, By Component (2021-2032) (USD Billion)

10.6.7.2 Argentina Wearable Fitness Technology Market Estimates and Forecasts, By Product (2021-2032) (USD Billion)

10.6.7.3 Argentina Wearable Fitness Technology Market Estimates and Forecasts, By Product Category (2021-2032) (USD Billion)

10.6.8 Rest of Latin America

10.6.8.1 Rest of Latin America Wearable Fitness Technology Market Estimates and Forecasts, By Component (2021-2032) (USD Billion)

10.6.8.2 Rest of Latin America Wearable Fitness Technology Market Estimates and Forecasts, By Product (2021-2032) (USD Billion)

10.6.8.3 Rest of Latin America Wearable Fitness Technology Market Estimates and Forecasts, By Product Category (2021-2032) (USD Billion)

12. Company Profiles

12.1 Apple Inc.

          12.1.1 Company Overview

12.1.2 Financial

12.1.3 Products/ Services Offered

12.1.4 SWOT Analysis

12.2 Fitbit (Google)

           12.2.1 Company Overview

12.2.2 Financial

12.2.3 Products/ Services Offered

12.2.4 SWOT Analysis

12.3 Garmin Ltd.

          12.3.1 Company Overview

12.3.2 Financial

12.3.3 Products/ Services Offered

12.3.4 SWOT Analysis

12.4 Samsung Electronics

          12.4.1 Company Overview

12.4.2 Financial

12.4.3 Products/ Services Offered

12.4.4 SWOT Analysis

12.5 Huawei Technologies Co.

          12.5.1 Company Overview

12.5.2 Financial

12.5.3 Products/ Services Offered

12.5.4 SWOT Analysis

12.6 Xiaomi Corporation

            12.6.1 Company Overview

12.6.2 Financial

12.6.3 Products/ Services Offered

12.6.4 SWOT Analysis

12.7 Whoop, Inc.

          12.7.1 Company Overview

12.7.2 Financial

12.7.3 Products/ Services Offered

12.7.4 SWOT Analysis

12.8 Amazfit (Zepp Health Corporation)

12.8.1 Company Overview

12.8.2 Financial

12.8.3 Products/ Services Offered

12.8.4 SWOT Analysis

12.9 Polar Electro Oy

12.9.1 Company Overview

12.9.2 Financial

12.9.3 Products/ Services Offered

12.9.4 SWOT Analysis

12.10 Oura Health Ltd.

12.10.1 Company Overview

12.10.2 Financial

12.10.3 Products/ Services Offered

12.10.4 SWOT Analysis

12. Use Cases and Best Practices

13. Conclusion

An accurate research report requires proper strategizing as well as implementation. There are multiple factors involved in the completion of good and accurate research report and selecting the best methodology to compete the research is the toughest part. Since the research reports we provide play a crucial role in any company’s decision-making process, therefore we at SNS Insider always believe that we should choose the best method which gives us results closer to reality. This allows us to reach at a stage wherein we can provide our clients best and accurate investment to output ratio.

Each report that we prepare takes a timeframe of 350-400 business hours for production. Starting from the selection of titles through a couple of in-depth brain storming session to the final QC process before uploading our titles on our website we dedicate around 350 working hours. The titles are selected based on their current market cap and the foreseen CAGR and growth.


The 5 steps process:

Step 1: Secondary Research:

Secondary Research or Desk Research is as the name suggests is a research process wherein, we collect data through the readily available information. In this process we use various paid and unpaid databases which our team has access to and gather data through the same. This includes examining of listed companies’ annual reports, Journals, SEC filling etc. Apart from this our team has access to various associations across the globe across different industries. Lastly, we have exchange relationships with various university as well as individual libraries.

Secondary Research

Step 2: Primary Research

When we talk about primary research, it is a type of study in which the researchers collect relevant data samples directly, rather than relying on previously collected data.  This type of research is focused on gaining content specific facts that can be sued to solve specific problems. Since the collected data is fresh and first hand therefore it makes the study more accurate and genuine.

We at SNS Insider have divided Primary Research into 2 parts.

Part 1 wherein we interview the KOLs of major players as well as the upcoming ones across various geographic regions. This allows us to have their view over the market scenario and acts as an important tool to come closer to the accurate market numbers. As many as 45 paid and unpaid primary interviews are taken from both the demand and supply side of the industry to make sure we land at an accurate judgement and analysis of the market.

This step involves the triangulation of data wherein our team analyses the interview transcripts, online survey responses and observation of on filed participants. The below mentioned chart should give a better understanding of the part 1 of the primary interview.

Primary Research

Part 2: In this part of primary research the data collected via secondary research and the part 1 of the primary research is validated with the interviews from individual consultants and subject matter experts.

Consultants are those set of people who have at least 12 years of experience and expertise within the industry whereas Subject Matter Experts are those with at least 15 years of experience behind their back within the same space. The data with the help of two main processes i.e., FGDs (Focused Group Discussions) and IDs (Individual Discussions). This gives us a 3rd party nonbiased primary view of the market scenario making it a more dependable one while collation of the data pointers.

Step 3: Data Bank Validation

Once all the information is collected via primary and secondary sources, we run that information for data validation. At our intelligence centre our research heads track a lot of information related to the market which includes the quarterly reports, the daily stock prices, and other relevant information. Our data bank server gets updated every fortnight and that is how the information which we collected using our primary and secondary information is revalidated in real time.

Data Bank Validation

Step 4: QA/QC Process

After all the data collection and validation our team does a final level of quality check and quality assurance to get rid of any unwanted or undesired mistakes. This might include but not limited to getting rid of the any typos, duplication of numbers or missing of any important information. The people involved in this process include technical content writers, research heads and graphics people. Once this process is completed the title gets uploader on our platform for our clients to read it.

Step 5: Final QC/QA Process:

This is the last process and comes when the client has ordered the study. In this process a final QA/QC is done before the study is emailed to the client. Since we believe in giving our clients a good experience of our research studies, therefore, to make sure that we do not lack at our end in any way humanly possible we do a final round of quality check and then dispatch the study to the client.

Key Segments: 

By Component

  • Displays

  • Processors

  • Memory Chips

  • Power Management Components

  • Networking Components

  • User Interface Components

  • Sensors

  • Mechanical Components

  • Others

By Product

  • Smartwatch

  • Wristband

  • Smartshoe

  • Smartshirt/Jacket

  • Headband/Smartcap

  • Others

By Product Category

  • Handwear

  • Torsowear

  • Legwear

  • Headwear

  • Others

Request for Segment Customization as per your Business Requirement: Segment Customization Request

Regional Coverage: 

North America

  • US

  • Canada

  • Mexico

Europe

  • Germany

  • France

  • UK

  • Italy

  • Spain

  • Poland

  • Turkey

  • Rest of Europe

Asia Pacific

  • China

  • India

  • Japan

  • South Korea

  • Singapore

  • Australia

  • Rest of Asia Pacific

Middle East & Africa

  • UAE

  • Saudi Arabia

  • Qatar

  • South Africa

  • Rest of Middle East & Africa

Latin America

  • Brazil

  • Argentina

  • Rest of Latin America

Request for Country Level Research Report: Country Level Customization Request

Available Customization 

With the given market data, SNS Insider offers customization as per the company’s specific needs. The following customization options are available for the report: 

  • Detailed Volume Analysis 

  • Criss-Cross segment analysis (e.g. Product X Application) 

  • Competitive Product Benchmarking 

  • Geographic Analysis 

  • Additional countries in any of the regions 

  • Customized Data Representation 

  • Detailed analysis and profiling of additional market players

Explore Key Insights 


  • Analyzes market trends, forecasts, and regional dynamics
  • Covers core offerings, innovations, and industry use cases
  • Profiles major players, value chains, and strategic developments
  • Highlights innovation trends, regulatory impacts, and growth opportunities
Request an Analyst Call