Wired Interface Market Report Scope & Overview:
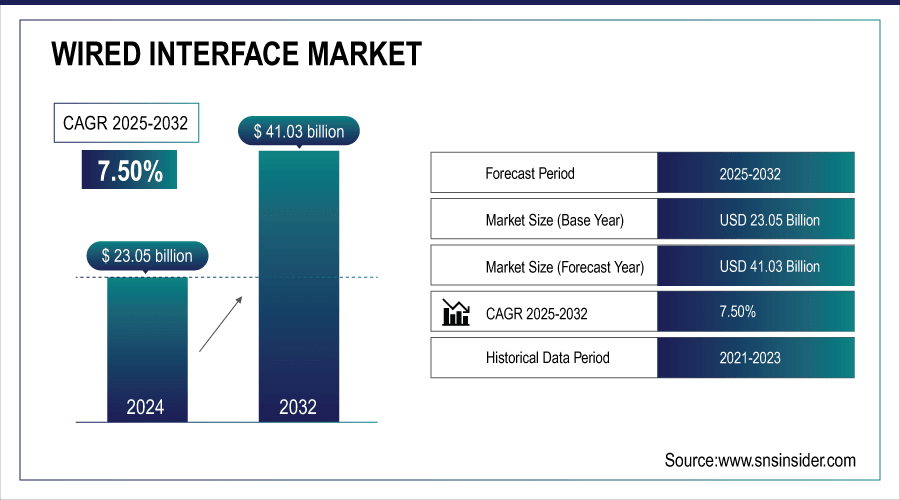
The Wired Interface Market size was valued at USD 23.05 Billion in 2024 and is projected to reach USD 41.03 Billion by 2032, growing at a CAGR of 7.50% during 2025-2032.
The Wired Interface Market is expanding due to the rising use of USB, HDMI, and Ethernet standards to boost growth on account of compatibility and efficiency. Increasing preference for automation in manufacturing, and requirement for stable connection in mission-critical tasks also drive the market demand. Furthermore, miniaturization of connectors and adoption of environmentally friendly, lead-free material is increasing in a wide range of industries.
Downtime cost in manufacturing: Unplanned outages cost $260,000 per hour on average; wired interfaces reduce risk by 40–60%.

To Get More Information On Wired Interface Market - Request Free Sample Report
Wired Interface Market Trends
-
Wired connections are still in vogue because they offer fast and stable data transfer as well as effective device charging.
-
Wired connectivity is being adopted in electric vehicles, infotainment and advanced driver-assistance systems. Adoption in the automotive sector continues to fuel strong need for low latency, high bandwidth and rugged connectivity.
-
Proliferation of digital health monitoring devices drives wired interface adoption in healthcare Industry.
-
Wired networks become the go-to solution for factories, industrial applications for smart automation and IoT device communication.
-
Wired connections are a requirement for AR/VR headsets and immersive system for low latency, and high-quality performance.
The U.S. Wired Interface Market size was valued at USD 3.77 Billion in 2024 and is projected to reach USD 7.00 Billion by 2032, growing at a CAGR of 8.06% during 2025-2032. Wired Interface Market growth is driven by increasing adoption of wired connectivity in smartphones, laptops and gaming consoles for stable operations and quick charging is stimulating growth of the U.S. wired interface market. Key Semiconductor and Connector Manufacturers Drive Demand The most notable and influential equipment manufacturers in the world are in Japan. The growing need for automotive industry, primarily for infotainment, safety, Electric Vehicle (EV) charging solutions propels the market to further extend.

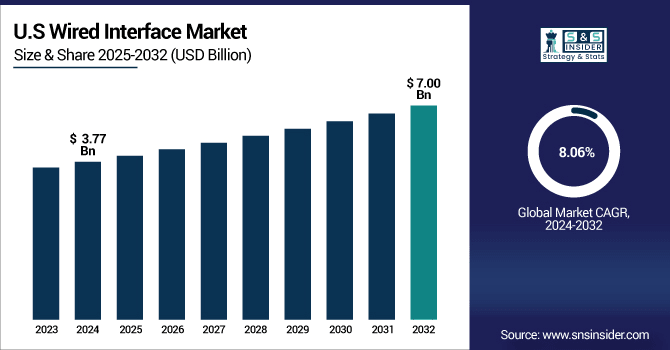
The trend toward miniaturization and high performance of connectors fits in well with consumer demand for smaller devices. Also, the focus on sustainability and lead-free manufacturing requirements are driving further adoption in other industries.
Wired Interface Market Segment Analysis
-
By type, USB led the market with approximately 37.52% share in 2024, while HDMI was the fastest-growing segment with a CAGR of 8.18%.
-
By device, smartphones dominated the market with around 31.21% share in 2024, whereas virtual reality devices showed the fastest growth with a CAGR of 8.56%.
-
By application, automotive led the market with about 36.25% share in 2024, and healthcare emerged as the fastest-growing segment with a CAGR of 8.20%.
-
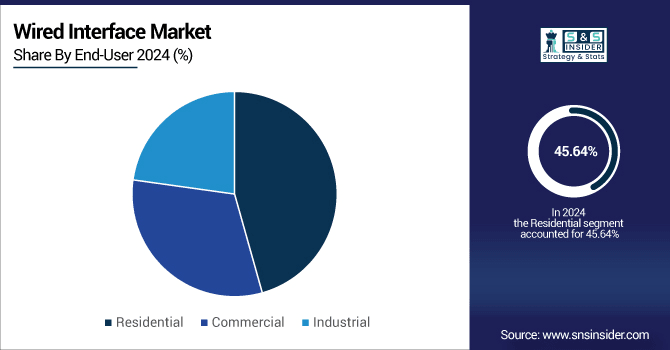
By end-user, the residential segment held the largest share at approximately 45.64% in 2024, while the commercial segment experienced the fastest growth with a CAGR of 7.79%.
By End-User, Residential Lead While Commercial Grow Fastest
On the basis of end-user, the residential segment dominates the wired interface market as the majority of smartphone, laptop, TV and gaming console customers require stable wired links. Growing proliferation of home entertainment systems and smart gadgets also fuels the demand. Conversely, the commercial sector is the fastest growing, as use in offices, data centers, and industrial-automation settings becomes more common.

By Type, USB Leads Market While HDMI Registers Fastest Growth
In 2024, by type the USB dominates the wired interface market as it is compatible more or less with each and every device (consumer electronics and industrial devices) and because of the low cost. Its supremacy is cemented through ongoing innovations, like USB-C, that give it faster charging and better data transfer. Meanwhile, HDMI is experiencing the most rapid expansion, fueled by the boom in high-definition displays, gaming, and home theater systems.
By Device, Smartphone Dominate While Virtual Reality Shows Rapid Growth
In 2024, the smartphone segment holds the largest share of the wired interface market by device, as smartphones is the biggest user base in the world and use USB-C and lightening connectors for charging and synchronizing data. Strong demand in both consumer and enterprise market segments remains consistent. When it comes to jacking into the matrix, however, VR seems to be growing faster. With immersive experiences becoming increasingly reliant on wired connections to enable latency sensitive interactions and for bandwidth intensive high resolution content.
By Application, Automotive Lead While Healthcare Registers Fastest Growth
In 2024, by application automotive dominates the wired interface market and as vehicles require better connectivity than ever with robust connectivity required for infotainment, safety systems and electric vehicle charging infrastructure etc. The dominance is further empowered by the industry’s need for ruggedized, high-performance connectors. In the meantime, healthcare is growing the fastest as devices used for diagnostic, medical equipment, and more need safe, accurate and interference free data transfer.
Wired Interface Market Growth Drivers:
-
Rising Need for Stable, High-Speed Data Transfer in Consumer Electronics and Industrial Applications.
With the fast data transfer and charging, it contributes to a wired interface popularity. Smartphones, laptops, and gaming consoles are still pretty dependent on USB, HDMI, and Ethernet connectors. Transportation and health care applications further promote uptake thanks to the need for secured, interference-free wired communication. Furthermore, the market acceptability is increasing due to advancement of connector miniaturization and green materials.
Connector size has reduced by up to 60% over the last decade, with micro-USB and USB-C replacing bulky legacy ports.
Wired Interface Market Restraints:
-
Growing Popularity of Wireless Technologies Reducing Dependence on Traditional Wired Connectivity Solutions
High-growth in the adoption of Wi-Fi, Bluetooth and 5G limits the dependence on physical wired connections. Consumers continue turning toward wireless for portability on mobile and smart devices. Increased spending on wireless infrastructure is likely to also moderate wired interface adoption in certain areas. It is difficult to form more ports due to miniaturization problems and design limitation in compact structures.
Wired Interface Market Opportunities:
-
Expanding Applications in Electric Vehicles, Data Centers, and Advanced Medical Equipment Worldwide
Wired Interfaces are essential in EV charging, infotainment and safety systems, leading automotive opportunities. Wired networks require a scalable and reliable architecture for the cloud services and enterprise connectivity. Health care expansion spurs usage, with diagnostic and monitoring devices requiring accurate wired communication. Moving AR/VR, industrial automation, and IoT framework continue to offer tremendous opportunities for innovative wired solutions.
Over 75% of enterprise networks use wired backbones even with Wi-Fi 6/6E, due to security, bandwidth, and low latency.
Wired Interface Market Regional Analysis
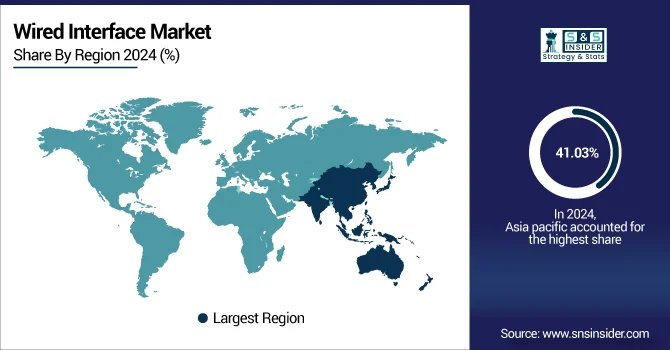
Asia-pacific Wired Interface Market Insights
In 2024 Asia-Pacific dominated the Wired Interface Market and accounted for 41.03% of revenue share, this leadership is due to increasing use of smartphones, laptops, gaming devices, among others is enabling users to opt for continuous wired connectivity. Robust industrial and automotive markets enhance leading market position on dependable, high performing connectors. Furthermore, fast technological advancement and favorable government initiatives boost the production and implementation of wired interfaces in the region.

Get Customized Report as Per Your Business Requirement - Enquiry Now
China Wired Interface Market Insights
China is a significant contributor in the global wired interface industry on account of its massive production of electronics. There is a steady growth thanks to high demands from consumer electronics, automotive, and industrial applications. It also updated to: Now supported with new standards such as USB, HDMI, and Ethernet add device compatibility and support.
North America Wired Interface Market Insights
North America is a key contributor in the global wired interface market due to the strong consumer electronics and automotive industries in the region. This growth is attributed to the growing need of the high-speed data transmission solutions in such end-use industry applications in the region including, consumer electronics, telecommunications, and enterprise networking among others. Advanced wireline interfaces are rapidly being rolled out in data centers, smart homes, and high speed networking with the USA and Canada being the first to deploy them.
U.S. Wired Interface Market Insights
U.S. Wired Interface Market is witnessing high growth on account of rising need for high-speed data transmission across consumer electronics, automotive, and industrial automation industries. With faster and more reliable types of connections like USB Type-C, HDMI or Ethernet, new devices can now be connected. Wired Storage Growing Demand in Data Centers Boost the Demand for USB 3.x Devices The increasing number of smart devices, increasing number of data centers, and the advent of 5G infrastructure have also escalated the demand for wired interfaces.
Europe Wired Interface Market Insights
Europe is growing steadily due to the growth in the IT infrastructure and the automotive manufacturing and the industrial automation investments, which are backed by the government initiatives and digital transformation. Countries such as Germany, France, and Italy are leading the adoption of wired interfaces because of the increasing demand for connected vehicles, industrial automation, and high-performance consumer electronics.
Germany Wired Interface Market Insights
In Germany, wired interface market is growing steadily, on the back of increasing automobile technology, industrial automation, and telecommunications. Strong industrial base in the country and focus on digital transformation are two factors behind this expansion. Many wired communication technologies receive a significant boost by government policies for improving digital infrastructure.
Latin America (LATAM) and Middle East & Africa (MEA) Wired Interface Market Insights
The Wired Interface Market is experiencing moderate growth in the Latin America (LATAM) and Middle East & Africa (MEA) regions, due to automotive, consumer electronics and telecommunications sectors are growing on the back of increasing disposable incomes and urbanization. The MEA market is mainly influenced by the growing demand in end-users such as, healthcare, telecommunications, and oil & gas, owing to increasing infrastructure and digital transformation projects. These trends are increasing connectivity and creating market opportunities in both regions.
Wired Interface Market Competitive Landscape
Koch Industries, Inc. is a global leader for its broad product portfolio and global footprint. The company offers advanced connectivity systems for consumer electronics, automotive and industrial applications. With emphasis on higher technologies and eco-friendly materials, our products are good in features, performance and marketability.
-
In August 2024, Koch Equity Development LLC, the principal investment and acquisition arm of Koch, Inc., announced an agreement to acquire iconectiv, LLC, a telecommunications solutions leader, from Ericsson and affiliates of Francisco Partners. This acquisition enhances Koch's capabilities in providing advanced connectivity solutions across various sectors.
Amphenol Corporation. Design and manufacturer of electronic, electrical connectors, fiber optics, and coaxial use in an array of applications. Their products are serving applications in a broad range of industry segments, including automotive, industrial automation, communications systems and consumer electronics.
-
In April 2025, Amphenol expanded its AT Circular connector series with a new 6-pin configuration designed to meet the evolving needs of industrial applications. This addition underscores Amphenol's commitment to providing versatile and robust connectivity solutions.
Japan Aviation Electronics Industry, Ltd. is contributing to the world's development by providing different services to the users though development and manufacture of wired interface connectors which are becoming more and more necessary for the wireless age. Founded in 1953 JAE is well known for its unique and innovative Hardware options for Automotive, Industrial Automation and Solid State Lighting applications to complement its excellent Electronic connector offering.
-
In August 2023, JAE launched the KW11 Series, a CCS Type-1 compliant connector designed for electric vehicle fast charging. This product supports the growing demand for efficient and standardized charging solutions in the electric vehicle sector.
Mouser Electronics, Inc. is a leading authorized distributor of electronic components featuring the industry's widest selection of off-the-shelf wired interface products. The company features a comprehensive portfolio of industrial connectors – including USB, HDMI, Ethernet, and fiber optics – for numerous market applications, ranging from automotive and industrial automation to harsh environments, telecommunications, and consumer products.
-
In July 2024, Mouser launched over 10,000 new part numbers, with more than 5,000 introduced in May alone, enhancing its inventory across various categories, including wired interface components.
Wired Interface Market Key Players
Some of the Wired Interface Market Companies are:
-
Koch Industries, Inc.,
-
Amphenol Corporation,
-
Japan Aviation Electronics Industry, Ltd.,
-
Mouser Electronics, Inc.,
-
STMicroelectronics,
-
NXP Semiconductors,
-
Texas Instruments Incorporated,
-
Cypress Semiconductor Corporation,
-
TE Connectivity,
-
ROHM CO. LTD.,
-
HIROSE ELECTRIC CO. LTD.,
-
Semiconductor Components Industries, LLC,
-
Analog Devices Inc.,
-
Diodes Incorporated,
-
Murata Manufacturing Co. Ltd.,
-
Vishay Intertechnology, Inc.,
-
Silicon Laboratories,
-
Maxim Integrated,
-
Orbital Energy Group
-
Yamaichi Electronics Co. Ltd.
Report Attributes | Details |
---|---|
Market Size in 2024 | USD 23.05 Billion |
Market Size by 2032 | USD 41.03 Billion |
CAGR | CAGR of 7.50% From 2025 to 2032 |
Base Year | 2024 |
Forecast Period | 2025-2032 |
Historical Data | 2021-2023 |
Report Scope & Coverage | Market Size, Segments Analysis, Competitive Landscape, Regional Analysis, DROC & SWOT Analysis, Forecast Outlook |
Key Segments | • By Type (USB, HDMI, DisplayPort, Ethernet, Others), • By Device (Smartphone, Tablet, Laptop and Desktop PCs, TV, Virtual Reality, Drones, Gaming Consoles) • By Application (Consumer Electronics, Automotive, Industrial, Healthcare, Others) • By End-User (Residential, Commercial, Industrial) |
Regional Analysis/Coverage | North America (US, Canada, Mexico), Europe (Germany, France, UK, Italy, Spain, Poland, Turkey, Rest of Europe), Asia Pacific (China, India, Japan, South Korea, Singapore, Australia, Taiwan, Rest of Asia Pacific), Middle East & Africa (UAE, Saudi Arabia, Qatar, South Africa, Rest of Middle East & Africa), Latin America (Brazil, Argentina, Rest of Latin America) |
Company Profiles | Koch Industries, Inc., Amphenol Corporation, Japan Aviation Electronics Industry, Ltd., Mouser Electronics, Inc., STMicroelectronics, NXP Semiconductors, Texas Instruments Incorporated, Cypress Semiconductor Corporation, TE Connectivity, ROHM CO. LTD., HIROSE ELECTRIC CO. LTD., Semiconductor Components Industries, LLC, Analog Devices Inc., Diodes Incorporated, Murata Manufacturing Co. Ltd., Vishay Intertechnology, Inc., Silicon Laboratories, Maxim Integrated, Orbital Energy Group and Yamaichi Electronics Co. Ltd. |
Table Of Contents
1. Introduction
1.1 Market Definition & Scope
1.2 Research Assumptions & Abbreviations
1.3 Research Methodology
2. Executive Summary
2.1 Market Snapshot
2.2 Market Absolute $ Opportunity Assessment & Y-o-Y Analysis, 2021–2032
2.3 Market Size & Forecast, By Segmentation, 2021–2032
2.3.1 Market Size By Type
2.3.2 Market Size By Device
2.3.3 Market Size By Application
2.3.4 Market Size By End-User
2.4 Market Share & Bps Analysis By Region, 2024
2.5 Industry Growth Scenarios – Conservative, Likely & Optimistic
2.6 Industry CxO’s Perspective
3. Market Overview
3.1 Market Dynamics
3.1.1 Drivers
3.1.2 Restraints
3.1.3 Opportunities
3.1.4 Key Market Trends
3.2 Industry PESTLE Analysis
3.3 Key Industry Forces (Porter’s) Impacting Market Growth
3.4 Industry Supply Chain Analysis
3.4.1 Raw Material Suppliers
3.4.2 Manufacturers
3.4.3 Distributors/Suppliers
3.4.4 Customers/End-Users
3.5 Industry Life Cycle Assessment
3.6 Parent Market Overview
3.7 Market Risk Assessment
4. Statistical Insights & Trends Reporting
4.1 Manufacturing & Yield Statistics
4.1.1 Average production yield rate (%) for wired connectors remains high due to stable, mature assembly practices.
4.1.2 Defect rate (%) differs by bonding technique—solder joints show higher issues compared to crimped or press-fit connectors.
4.1.3 A large % of manufacturing plants rely on automation for mass production, while a smaller % still use manual assembly for low-volume, specialized applications.
4.2 Application & Deployment Trends
4.2.1 Share of wired interfaces shows the highest % in consumer electronics, moderate % in automotive, and smaller but growing % in medical devices.
4.2.2 Device size reduction (%) enabled by wired miniaturized connectors supports thinner smartphones, tablets, and wearables.
4.2.3 Adoption growth rate (%) of wired connectivity in AR/VR headsets and flexible displays is accelerating as demand for low-latency performance increases.
4.3 Material & Technology Adoption Metrics
4.3.1 A dominant % of wired connectors use copper, while a smaller % adopt advanced alloys for higher durability and conductivity.
4.3.2 Lead-free solder materials now represent a large % of production, replacing traditional lead-based options due to environmental regulations.
4.3.3 Flex circuit layer thickness (%) varies by sector—consumer electronics use thinner % layers, while automotive and defense require higher % thickness for ruggedness.
4.4 Reliability & Performance Data
4.4.1 Mean time between failures (MTBF) reflects high reliability, with wired connectors trusted in a high % of mission-critical applications.
4.4.2 A broad % of wired interfaces can withstand extreme temperature ranges, making them suitable across industries.
4.4.3 Failure rate (%) after stress testing remains low in controlled environments but rises by a noticeable % under vibration, heat, and humidity exposure.
5. Wired Interface Market Segmental Analysis & Forecast, By Type, 2021 – 2032, Value (USD Billion)
5.1 Introduction
5.2 USB
5.2.1 Key Trends
5.2.2 Market Size & Forecast, 2021 – 2032
5.3 HDMI
5.3.1 Key Trends
5.3.2 Market Size & Forecast, 2021 – 2032
5.4 DisplayPort
5.4.1 Key Trends
5.4.2 Market Size & Forecast, 2021 – 2032
5.5 Ethernet
5.5.1 Key Trends
5.5.2 Market Size & Forecast, 2021 – 2032
5.6 Others
5.6.1 Key Trends
5.6.2 Market Size & Forecast, 2021 – 2032
6. Wired Interface Market Segmental Analysis & Forecast, By Device, 2021 – 2032, Value (USD Billion)
6.1 Introduction
6.2 Smartphone
6.2.1 Key Trends
6.2.2 Market Size & Forecast, 2021 – 2032
6.3 Tablet
6.3.1 Key Trends
6.3.2 Market Size & Forecast, 2021 – 2032
6.4 Laptop and Desktop PCs
6.4.1 Key Trends
6.4.2 Market Size & Forecast, 2021 – 2032
6.5 TV
6.5.1 Key Trends
6.5.2 Market Size & Forecast, 2021 – 2032
6.6 Virtual Reality
6.6.1 Key Trends
6.6.2 Market Size & Forecast, 2021 – 2032
6.7 Drones
6.7.1 Key Trends
6.7.2 Market Size & Forecast, 2021 – 2032
6.8 Gaming Consoles
6.8.1 Key Trends
6.8.2 Market Size & Forecast, 2021 – 2032
7. Wired Interface Market Segmental Analysis & Forecast, By Application, 2021 – 2032, Value (USD Billion)
7.1 Introduction
7.2 Consumer Electronics
7.2.1 Key Trends
7.2.2 Market Size & Forecast, 2021 – 2032
7.3 Automotive
7.3.1 Key Trends
7.3.2 Market Size & Forecast, 2021 – 2032
7.4 Industrial
7.4.1 Key Trends
7.4.2 Market Size & Forecast, 2021 – 2032
7.5 Healthcare
7.5.1 Key Trends
7.5.2 Market Size & Forecast, 2021 – 2032
7.6 Others
7.6.1 Key Trends
7.6.2 Market Size & Forecast, 2021 – 2032
8. Wired Interface Market Segmental Analysis & Forecast, By End-User, 2021 – 2032, Value (USD Billion)
8.1 Introduction
8.2 Residential
8.2.1 Key Trends
8.2.2 Market Size & Forecast, 2021 – 2032
8.3 Commercial
8.3.1 Key Trends
8.3.2 Market Size & Forecast, 2021 – 2032
8.4 Industrial
8.4.1 Key Trends
8.4.2 Market Size & Forecast, 2021 – 2032
9. Wired Interface Market Segmental Analysis & Forecast By Region, 2021 – 2025, Value (USD Billion)
9.1 Introduction
9.2 North America
9.2.1 Key Trends
9.2.2 Wired Interface Market Size & Forecast, By Type, 2021 – 2032
9.2.3 Wired Interface Market Size & Forecast, By Device, 2021 – 2032
9.2.4 Wired Interface Market Size & Forecast, By Application, 2021 – 2032
9.2.5 Wired Interface Market Size & Forecast, By End-User, 2021 – 2032
9.2.6 Wired Interface Market Size & Forecast, By Country, 2021 – 2032
9.2.6.1 USA
9.2.6.1.1 Wired Interface Market Size & Forecast, By Type, 2021 – 2032
9.2.6.1.2 Wired Interface Market Size & Forecast, By Device, 2021 – 2032
9.2.6.1.3 Wired Interface Market Size & Forecast, By Application, 2021 – 2032
9.2.6.1.4 Wired Interface Market Size & Forecast, By End-User, 2021 – 2032
9.2.6.2 Canada
9.2.6.2.1 Wired Interface Market Size & Forecast, By Type, 2021 – 2032
9.2.6.2.2 Wired Interface Market Size & Forecast, By Device, 2021 – 2032
9.2.6.2.3 Wired Interface Market Size & Forecast, By Application, 2021 – 2032
9.2.6.2.4 Wired Interface Market Size & Forecast, By End-User, 2021 – 2032
9.3 Europe
9.3.1 Key Trends
9.3.2 Wired Interface Market Size & Forecast, By Type, 2021 – 2032
9.3.3 Wired Interface Market Size & Forecast, By Device, 2021 – 2032
9.3.4 Wired Interface Market Size & Forecast, By Application, 2021 – 2032
9.3.5 Wired Interface Market Size & Forecast, By End-User, 2021 – 2032
9.3.6 Wired Interface Market Size & Forecast, By Country, 2021 – 2032
9.3.6.1 Germany
9.3.6.1.1 Wired Interface Market Size & Forecast, By Type, 2021 – 2032
9.3.6.1.2 Wired Interface Market Size & Forecast, By Device, 2021 – 2032
9.3.6.1.3 Wired Interface Market Size & Forecast, By Application, 2021 – 2032
9.3.6.1.4 Wired Interface Market Size & Forecast, By End-User, 2021 – 2032
9.3.6.2 UK
9.3.6.2.1 Wired Interface Market Size & Forecast, By Type, 2021 – 2032
9.3.6.2.2 Wired Interface Market Size & Forecast, By Device, 2021 – 2032
9.3.6.2.3 Wired Interface Market Size & Forecast, By Application, 2021 – 2032
9.3.6.2.4 Wired Interface Market Size & Forecast, By End-User, 2021 – 2032
9.3.6.3 France
9.3.6.3.1 Wired Interface Market Size & Forecast, By Type, 2021 – 2032
9.3.6.3.2 Wired Interface Market Size & Forecast, By Device, 2021 – 2032
9.3.6.3.3 Wired Interface Market Size & Forecast, By Application, 2021 – 2032
9.3.6.3.4 Wired Interface Market Size & Forecast, By End-User, 2021 – 2032
9.3.6.4 Italy
9.3.6.4.1 Wired Interface Market Size & Forecast, By Type, 2021 – 2032
9.3.6.4.2 Wired Interface Market Size & Forecast, By Device, 2021 – 2032
9.3.6.4.3 Wired Interface Market Size & Forecast, By Application, 2021 – 2032
9.3.6.4.4 Wired Interface Market Size & Forecast, By End-User, 2021 – 2032
9.3.6.5 Spain
9.3.6.5.1 Wired Interface Market Size & Forecast, By Type, 2021 – 2032
9.3.6.5.2 Wired Interface Market Size & Forecast, By Device, 2021 – 2032
9.3.6.5.3 Wired Interface Market Size & Forecast, By Application, 2021 – 2032
9.3.6.5.4 Wired Interface Market Size & Forecast, By End-User, 2021 – 2032
9.3.6.6 Russia
9.3.6.6.1 Wired Interface Market Size & Forecast, By Type, 2021 – 2032
9.3.6.6.2 Wired Interface Market Size & Forecast, By Device, 2021 – 2032
9.3.6.6.3 Wired Interface Market Size & Forecast, By Application, 2021 – 2032
9.3.6.6.4 Wired Interface Market Size & Forecast, By End-User, 2021 – 2032
9.3.6.7 Poland
9.3.6.7.1 Wired Interface Market Size & Forecast, By Type, 2021 – 2032
9.3.6.7.2 Wired Interface Market Size & Forecast, By Device, 2021 – 2032
9.3.6.7.3 Wired Interface Market Size & Forecast, By Application, 2021 – 2032
9.3.6.7.4 Wired Interface Market Size & Forecast, By End-User, 2021 – 2032
9.3.6.8 Rest of Europe
9.3.6.8.1 Wired Interface Market Size & Forecast, By Type, 2021 – 2032
9.3.6.8.2 Wired Interface Market Size & Forecast, By Device, 2021 – 2032
9.3.6.8.3 Wired Interface Market Size & Forecast, By Application, 2021 – 2032
9.3.6.8.4 Wired Interface Market Size & Forecast, By End-User, 2021 – 2032
9.4 Asia-Pacific
9.4.1 Key Trends
9.4.2 Wired Interface Market Size & Forecast, By Type, 2021 – 2032
9.4.3 Wired Interface Market Size & Forecast, By Device, 2021 – 2032
9.4.4 Wired Interface Market Size & Forecast, By Application, 2021 – 2032
9.4.5 Wired Interface Market Size & Forecast, By End-User, 2021 – 2032
9.4.6 Wired Interface Market Size & Forecast, By Country, 2021 – 2032
9.4.6.1 China
9.4.6.1.1 Wired Interface Market Size & Forecast, By Type, 2021 – 2032
9.4.6.1.2 Wired Interface Market Size & Forecast, By Device, 2021 – 2032
9.4.6.1.3 Wired Interface Market Size & Forecast, By Application, 2021 – 2032
9.4.6.1.4 Wired Interface Market Size & Forecast, By End-User, 2021 – 2032
9.4.6.2 India
9.4.6.2.1 Wired Interface Market Size & Forecast, By Type, 2021 – 2032
9.4.6.2.2 Wired Interface Market Size & Forecast, By Device, 2021 – 2032
9.4.6.2.3 Wired Interface Market Size & Forecast, By Application, 2021 – 2032
9.4.6.2.4 Wired Interface Market Size & Forecast, By End-User, 2021 – 2032
9.4.6.3 Japan
9.4.6.3.1 Wired Interface Market Size & Forecast, By Type, 2021 – 2032
9.4.6.3.2 Wired Interface Market Size & Forecast, By Device, 2021 – 2032
9.4.6.3.3 Wired Interface Market Size & Forecast, By Application, 2021 – 2032
9.4.6.3.4 Wired Interface Market Size & Forecast, By End-User, 2021 – 2032
9.4.6.4 South Korea
9.4.6.4.1 Wired Interface Market Size & Forecast, By Type, 2021 – 2032
9.4.6.4.2 Wired Interface Market Size & Forecast, By Device, 2021 – 2032
9.4.6.4.3 Wired Interface Market Size & Forecast, By Application, 2021 – 2032
9.4.6.4.4 Wired Interface Market Size & Forecast, By End-User, 2021 – 2032
9.4.6.5 Australia
9.4.6.5.1 Wired Interface Market Size & Forecast, By Type, 2021 – 2032
9.4.6.5.2 Wired Interface Market Size & Forecast, By Device, 2021 – 2032
9.4.6.5.3 Wired Interface Market Size & Forecast, By Application, 2021 – 2032
9.4.6.5.4 Wired Interface Market Size & Forecast, By End-User, 2021 – 2032
9.4.6.6 ASEAN Countries
9.4.6.6.1 Wired Interface Market Size & Forecast, By Type, 2021 – 2032
9.4.6.6.2 Wired Interface Market Size & Forecast, By Device, 2021 – 2032
9.4.6.6.3 Wired Interface Market Size & Forecast, By Application, 2021 – 2032
9.4.6.6.4 Wired Interface Market Size & Forecast, By End-User, 2021 – 2032
9.4.6.7 Rest of Asia-Pacific
9.4.6.7.1 Wired Interface Market Size & Forecast, By Type, 2021 – 2032
9.4.6.7.2 Wired Interface Market Size & Forecast, By Device, 2021 – 2032
9.4.6.7.3 Wired Interface Market Size & Forecast, By Application, 2021 – 2032
9.4.6.7.4 Wired Interface Market Size & Forecast, By End-User, 2021 – 2032
9.5 Latin America
9.5.1 Key Trends
9.5.2 Wired Interface Market Size & Forecast, By Type, 2021 – 2032
9.5.3 Wired Interface Market Size & Forecast, By Device, 2021 – 2032
9.5.4 Wired Interface Market Size & Forecast, By Application, 2021 – 2032
9.5.5 Wired Interface Market Size & Forecast, By End-User, 2021 – 2032
9.5.6 Wired Interface Market Size & Forecast, By Country, 2021 – 2032
9.5.6.1 Brazil
9.5.6.1.1 Wired Interface Market Size & Forecast, By Type, 2021 – 2032
9.5.6.1.2 Wired Interface Market Size & Forecast, By Device, 2021 – 2032
9.5.6.1.3 Wired Interface Market Size & Forecast, By Application, 2021 – 2032
9.5.6.1.4 Wired Interface Market Size & Forecast, By End-User, 2021 – 2032
9.5.6.2 Argentina
9.5.6.2.1 Wired Interface Market Size & Forecast, By Type, 2021 – 2032
9.5.6.2.2 Wired Interface Market Size & Forecast, By Device, 2021 – 2032
9.5.6.2.3 Wired Interface Market Size & Forecast, By Application, 2021 – 2032
9.5.6.2.4 Wired Interface Market Size & Forecast, By End-User, 2021 – 2032
9.5.6.3 Mexico
9.5.6.3.1 Wired Interface Market Size & Forecast, By Type, 2021 – 2032
9.5.6.3.2 Wired Interface Market Size & Forecast, By Device, 2021 – 2032
9.5.6.3.3 Wired Interface Market Size & Forecast, By Application, 2021 – 2032
9.5.6.3.4 Wired Interface Market Size & Forecast, By End-User, 2021 – 2032
9.5.6.4 Colombia
9.5.6.4.1 Wired Interface Market Size & Forecast, By Type, 2021 – 2032
9.5.6.4.2 Wired Interface Market Size & Forecast, By Device, 2021 – 2032
9.5.6.4.3 Wired Interface Market Size & Forecast, By Application, 2021 – 2032
9.5.6.4.4 Wired Interface Market Size & Forecast, By End-User, 2021 – 2032
9.5.6.5 Rest of Latin America
9.5.6.5.1 Wired Interface Market Size & Forecast, By Type, 2021 – 2032
9.5.6.5.2 Wired Interface Market Size & Forecast, By Device, 2021 – 2032
9.5.6.5.3 Wired Interface Market Size & Forecast, By Application, 2021 – 2032
9.5.6.5.4 Wired Interface Market Size & Forecast, By End-User, 2021 – 2032
9.6 Middle East & Africa
9.6.1 Key Trends
9.6.2 Wired Interface Market Size & Forecast, By Type, 2021 – 2032
9.6.3 Wired Interface Market Size & Forecast, By Device, 2021 – 2032
9.6.4 Wired Interface Market Size & Forecast, By Application, 2021 – 2032
9.6.5 Wired Interface Market Size & Forecast, By End-User, 2021 – 2032
9.6.6 Wired Interface Market Size & Forecast, By Country, 2021 – 2032
9.6.6.1 UAE
9.6.6.1.1 Wired Interface Market Size & Forecast, By Type, 2021 – 2032
9.6.6.1.2 Wired Interface Market Size & Forecast, By Device, 2021 – 2032
9.6.6.1.3 Wired Interface Market Size & Forecast, By Application, 2021 – 2032
9.6.6.1.4 Wired Interface Market Size & Forecast, By End-User, 2021 – 2032
9.6.6.2 Saudi Arabia
9.6.6.2.1 Wired Interface Market Size & Forecast, By Type, 2021 – 2032
9.6.6.2.2 Wired Interface Market Size & Forecast, By Device, 2021 – 2032
9.6.6.2.3 Wired Interface Market Size & Forecast, By Application, 2021 – 2032
9.6.6.2.4 Wired Interface Market Size & Forecast, By End-User, 2021 – 2032
9.6.6.3 Qatar
9.6.6.3.1 Wired Interface Market Size & Forecast, By Type, 2021 – 2032
9.6.6.3.2 Wired Interface Market Size & Forecast, By Device, 2021 – 2032
9.6.6.3.3 Wired Interface Market Size & Forecast, By Application, 2021 – 2032
9.6.6.3.4 Wired Interface Market Size & Forecast, By End-User, 2021 – 2032
9.6.6.4 Egypt
9.6.6.4.1 Wired Interface Market Size & Forecast, By Type, 2021 – 2032
9.6.6.4.2 Wired Interface Market Size & Forecast, By Device, 2021 – 2032
9.6.6.4.3 Wired Interface Market Size & Forecast, By Application, 2021 – 2032
9.6.6.4.4 Wired Interface Market Size & Forecast, By End-User, 2021 – 2032
9.6.6.5 South Africa
9.6.6.5.1 Wired Interface Market Size & Forecast, By Type, 2021 – 2032
9.6.6.5.2 Wired Interface Market Size & Forecast, By Device, 2021 – 2032
9.6.6.5.3 Wired Interface Market Size & Forecast, By Application, 2021 – 2032
9.6.6.5.4 Wired Interface Market Size & Forecast, By End-User, 2021 – 2032
9.6.6.6 Rest of Middle East & Africa
9.6.6.6.1 Wired Interface Market Size & Forecast, By Type, 2021 – 2032
9.6.6.6.2 Wired Interface Market Size & Forecast, By Device, 2021 – 2032
9.6.6.6.3 Wired Interface Market Size & Forecast, By Application, 2021 – 2032
9.6.6.6.4 Wired Interface Market Size & Forecast, By End-User, 2021 – 2032
10. Competitive Landscape
10.1 Key Players' Positioning
10.2 Competitive Developments
10.2.1 Key Strategies Adopted (%), By Key Players, 2024
10.2.2 Year-Wise Strategies & Development, 2021 – 2025
10.2.3 Number Of Strategies Adopted By Key Players, 2024
10.3 Market Share Analysis, 2024
10.4 Product/Service & Application Benchmarking
10.4.1 Product/Service Specifications & Features By Key Players
10.4.2 Product/Service Heatmap By Key Players
10.4.3 Application Heatmap By Key Players
10.5 Industry Start-Up & Innovation Landscape
10.6 Key Company Profiles
10.6.1 Koch Industries, Inc.
10.6.1.1 Company Overview & Snapshot
10.6.1.2 Product/Service Portfolio
10.6.1.3 Key Company Financials
10.6.1.4 SWOT Analysis
10.6.2 Amphenol Corporation
10.6.2.1 Company Overview & Snapshot
10.6.2.2 Product/Service Portfolio
10.6.2.3 Key Company Financials
10.6.2.4 SWOT Analysis
10.6.3 Japan Aviation Electronics Industry, Ltd.
10.6.3.1 Company Overview & Snapshot
10.6.3.2 Product/Service Portfolio
10.6.3.3 Key Company Financials
10.6.3.4 SWOT Analysis
10.6.4 Mouser Electronics, Inc.
10.6.4.1 Company Overview & Snapshot
10.6.4.2 Product/Service Portfolio
10.6.4.3 Key Company Financials
10.6.4.4 SWOT Analysis
10.6.5 STMicroelectronics
10.6.5.1 Company Overview & Snapshot
10.6.5.2 Product/Service Portfolio
10.6.5.3 Key Company Financials
10.6.5.4 SWOT Analysis
10.6.6 NXP Semiconductors
10.6.6.1 Company Overview & Snapshot
10.6.6.2 Product/Service Portfolio
10.6.6.3 Key Company Financials
10.6.6.4 SWOT Analysis
10.6.7 Texas Instruments Incorporated
10.6.7.1 Company Overview & Snapshot
10.6.7.2 Product/Service Portfolio
10.6.7.3 Key Company Financials
10.6.7.4 SWOT Analysis
10.6.8 Cypress Semiconductor Corporation
10.6.8.1 Company Overview & Snapshot
10.6.8.2 Product/Service Portfolio
10.6.8.3 Key Company Financials
10.6.8.4 SWOT Analysis
10.6.9 TE Connectivity
10.6.9.1 Company Overview & Snapshot
10.6.9.2 Product/Service Portfolio
10.6.9.3 Key Company Financials
10.6.9.4 SWOT Analysis
10.6.10 ROHM CO. LTD.
10.6.10.1 Company Overview & Snapshot
10.6.10.2 Product/Service Portfolio
10.6.10.3 Key Company Financials
10.6.10.4 SWOT Analysis
10.6.11 HIROSE ELECTRIC CO. LTD.
10.6.11.1 Company Overview & Snapshot
10.6.11.2 Product/Service Portfolio
10.6.11.3 Key Company Financials
10.6.11.4 SWOT Analysis
10.6.12 Semiconductor Components Industries, LLC
10.6.12.1 Company Overview & Snapshot
10.6.12.2 Product/Service Portfolio
10.6.12.3 Key Company Financials
10.6.12.4 SWOT Analysis
10.6.13 Analog Devices Inc.
10.6.13.1 Company Overview & Snapshot
10.6.13.2 Product/Service Portfolio
10.6.13.3 Key Company Financials
10.6.13.4 SWOT Analysis
10.6.14 Diodes Incorporated
10.6.14.1 Company Overview & Snapshot
10.6.14.2 Product/Service Portfolio
10.6.14.3 Key Company Financials
10.6.14.4 SWOT Analysis
10.6.15 Murata Manufacturing Co. Ltd.
10.6.15.1 Company Overview & Snapshot
10.6.15.2 Product/Service Portfolio
10.6.15.3 Key Company Financials
10.6.15.4 SWOT Analysis
10.6.16 Vishay Intertechnology, Inc.
10.6.16.1 Company Overview & Snapshot
10.6.16.2 Product/Service Portfolio
10.6.16.3 Key Company Financials
10.6.16.4 SWOT Analysis
10.6.17 Silicon Laboratories
10.6.17.1 Company Overview & Snapshot
10.6.17.2 Product/Service Portfolio
10.6.17.3 Key Company Financials
10.6.17.4 SWOT Analysis
10.6.18 Maxim Integrated
10.6.18.1 Company Overview & Snapshot
10.6.18.2 Product/Service Portfolio
10.6.18.3 Key Company Financials
10.6.18.4 SWOT Analysis
10.6.19 Orbital Energy Group
10.6.19.1 Company Overview & Snapshot
10.6.19.2 Product/Service Portfolio
10.6.19.3 Key Company Financials
10.6.19.4 SWOT Analysis
10.6.20 Yamaichi Electronics Co. Ltd.
10.6.20.1 Company Overview & Snapshot
10.6.20.2 Product/Service Portfolio
10.6.20.3 Key Company Financials
10.6.20.4 SWOT Analysis
11. Analyst Recommendations
11.1 SNS Insider Opportunity Map
11.2 Industry Low-Hanging Fruit Assessment
11.3 Market Entry & Growth Strategy
11.4 Analyst Viewpoint & Suggestions On Market Growth
12. Assumptions
13. Disclaimer
14. Appendix
14.1 List Of Tables
14.2 List Of Figures
Key Segmentation
By Type
-
USB
-
HDMI
-
DisplayPort
-
Ethernet
-
Others
By Device
-
Smartphone
-
Tablet
-
Laptop and Desktop PCs
-
TV
-
Virtual Reality
-
Drones
-
Gaming Consoles
By Application
-
Consumer Electronics
-
Automotive
-
Industrial
-
Healthcare
-
Others
By End-User
-
Residential
-
Commercial
-
Industrial
Request for Segment Customization as per your Business Requirement: Segment Customization Request
Regional Coverage:
North America
-
US
-
Canada
Europe
-
Germany
-
UK
-
France
-
Italy
-
Spain
-
Russia
-
Poland
-
Rest of Europe
Asia Pacific
-
China
-
India
-
Japan
-
South Korea
-
Australia
-
ASEAN Countries
-
Rest of Asia Pacific
Middle East & Africa
-
UAE
-
Saudi Arabia
-
Qatar
-
South Africa
-
Rest of Middle East & Africa
Latin America
-
Brazil
-
Argentina
-
Mexico
-
Colombia
-
Rest of Latin America
Request for Country Level Research Report: Country Level Customization Request
Available Customization
With the given market data, SNS Insider offers customization as per the company’s specific needs. The following customization options are available for the report:
-
Detailed Volume Analysis
-
Criss-Cross segment analysis (e.g. Product X Application)
-
Competitive Product Benchmarking
-
Geographic Analysis
-
Additional countries in any of the regions
-
Customized Data Representation
-
Detailed analysis and profiling of additional market player
An accurate research report requires proper strategizing as well as implementation. There are multiple factors involved in the completion of good and accurate research report and selecting the best methodology to compete the research is the toughest part. Since the research reports we provide play a crucial role in any company’s decision-making process, therefore we at SNS Insider always believe that we should choose the best method which gives us results closer to reality. This allows us to reach at a stage wherein we can provide our clients best and accurate investment to output ratio.
Each report that we prepare takes a timeframe of 350-400 business hours for production. Starting from the selection of titles through a couple of in-depth brain storming session to the final QC process before uploading our titles on our website we dedicate around 350 working hours. The titles are selected based on their current market cap and the foreseen CAGR and growth.
The 5 steps process:
Step 1: Secondary Research:
Secondary Research or Desk Research is as the name suggests is a research process wherein, we collect data through the readily available information. In this process we use various paid and unpaid databases which our team has access to and gather data through the same. This includes examining of listed companies’ annual reports, Journals, SEC filling etc. Apart from this our team has access to various associations across the globe across different industries. Lastly, we have exchange relationships with various university as well as individual libraries.

Step 2: Primary Research
When we talk about primary research, it is a type of study in which the researchers collect relevant data samples directly, rather than relying on previously collected data. This type of research is focused on gaining content specific facts that can be sued to solve specific problems. Since the collected data is fresh and first hand therefore it makes the study more accurate and genuine.
We at SNS Insider have divided Primary Research into 2 parts.
Part 1 wherein we interview the KOLs of major players as well as the upcoming ones across various geographic regions. This allows us to have their view over the market scenario and acts as an important tool to come closer to the accurate market numbers. As many as 45 paid and unpaid primary interviews are taken from both the demand and supply side of the industry to make sure we land at an accurate judgement and analysis of the market.
This step involves the triangulation of data wherein our team analyses the interview transcripts, online survey responses and observation of on filed participants. The below mentioned chart should give a better understanding of the part 1 of the primary interview.

Part 2: In this part of primary research the data collected via secondary research and the part 1 of the primary research is validated with the interviews from individual consultants and subject matter experts.
Consultants are those set of people who have at least 12 years of experience and expertise within the industry whereas Subject Matter Experts are those with at least 15 years of experience behind their back within the same space. The data with the help of two main processes i.e., FGDs (Focused Group Discussions) and IDs (Individual Discussions). This gives us a 3rd party nonbiased primary view of the market scenario making it a more dependable one while collation of the data pointers.
Step 3: Data Bank Validation
Once all the information is collected via primary and secondary sources, we run that information for data validation. At our intelligence centre our research heads track a lot of information related to the market which includes the quarterly reports, the daily stock prices, and other relevant information. Our data bank server gets updated every fortnight and that is how the information which we collected using our primary and secondary information is revalidated in real time.

Step 4: QA/QC Process
After all the data collection and validation our team does a final level of quality check and quality assurance to get rid of any unwanted or undesired mistakes. This might include but not limited to getting rid of the any typos, duplication of numbers or missing of any important information. The people involved in this process include technical content writers, research heads and graphics people. Once this process is completed the title gets uploader on our platform for our clients to read it.
Step 5: Final QC/QA Process:
This is the last process and comes when the client has ordered the study. In this process a final QA/QC is done before the study is emailed to the client. Since we believe in giving our clients a good experience of our research studies, therefore, to make sure that we do not lack at our end in any way humanly possible we do a final round of quality check and then dispatch the study to the client.