Wireless Gas Detection Market Size:
To Get More Information on Wireless Gas Detection Market - Request Sample Report
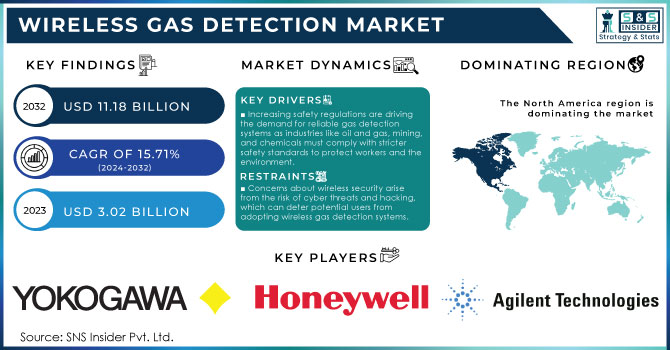
The Wireless Gas Detection Market size was valued at USD 3.02 Billion in 2023. It is estimated to hit USD 11.18 Billion by 2032 and grow at a CAGR of 15.71% over the forecast period of 2024-2032.
The wireless gas detection market has experienced remarkable growth driven by several key factors. Heightened workplace safety awareness and stringent regulatory requirements have pushed industries like oil and gas, manufacturing, and mining to adopt advanced gas detection technologies. Wireless systems offer reliable monitoring of hazardous gases, ensuring organizations adhere to safety regulations. For instance, studies indicate that implementing these systems can reduce workplace incidents related to gas leaks by up to 30%. Technological advancements in sensor technologies and wireless communication have significantly enhanced the efficiency and reliability of gas detection systems. The integration of IoT and smart technologies facilitates better data analysis, predictive maintenance, and remote monitoring, enabling timely intervention during gas leaks.
Additionally, wireless solutions reduce installation and maintenance costs by eliminating the need for extensive wiring, making them particularly appealing to small and medium-sized enterprises (SMEs). A recent survey found that over 50% of organizations in the oil and gas sector plan to upgrade to wireless gas detection technologies in the next three years. Emerging economies are increasingly adopting these systems to enhance workplace safety and operational efficiency, driven by rapid industrial growth and a rising awareness of safety measures. Key trends shaping this market include the integration of IoT technologies for real-time data analysis, a growing demand for portable gas detection devices, and the adoption of advanced wireless networking technologies like LoRaWAN and Zigbee. Moreover, the use of data analytics and machine learning algorithms is becoming more prevalent, aiding in pattern identification and decision-making for improved safety management. The shift toward utilizing wireless systems for environmental monitoring is also notable, addressing air quality and pollution control due to increased regulatory scrutiny. Approximately 40% of market survey respondents expressed a preference for portable gas detection devices, citing flexibility and improved personal safety as significant factors.
MARKET DYNAMICS
DRIVERS
-
Increasing safety regulations are driving the demand for reliable gas detection systems as industries like oil and gas, mining, and chemicals must comply with stricter safety standards to protect workers and the environment.
Increasing safety regulations are significantly influencing the demand for reliable gas detection systems across various industries, notably in sectors like oil and gas, mining, and chemicals. As companies face mounting pressure to ensure the safety of their operations and protect their workforce from hazardous conditions, regulatory bodies are enforcing stringent compliance standards. These regulations are designed to minimize the risk of accidents related to gas leaks and toxic exposures, which can have devastating consequences for both personnel and the environment.
In the oil and gas sector, the Occupational Safety and Health Administration (OSHA) mandates that employers provide appropriate gas detection equipment to identify harmful gases like hydrogen sulfide and methane, which pose serious health risks. Research indicates that approximately 3,000 injuries and 130 fatalities occur annually in the U.S. oil and gas extraction industry due to hazardous gases, emphasizing the critical need for effective detection systems. Similarly, the mining industry is subject to regulations from organizations like the Mine Safety and Health Administration (MSHA), which require regular monitoring of air quality to safeguard miners against exposure to toxic gases and dust. Statistically, mining operations report an average of 200 respiratory illnesses each year, further highlighting the importance of gas detection technologies. In the chemical industry, the Chemical Safety Board (CSB) emphasizes the need for robust gas detection systems to prevent catastrophic incidents, such as explosions and chemical spills, with about 40% of all chemical accidents attributed to gas leaks.
These heightened regulatory demands are fostering innovation in gas detection technologies, leading to the development of more advanced systems capable of real-time monitoring and rapid response. Companies that invest in reliable gas detection solutions not only comply with legal requirements but also enhance their overall safety culture, reducing the likelihood of accidents and ensuring the well-being of their employees. Consequently, the growing emphasis on safety regulations is driving the adoption of sophisticated gas detection systems across these critical industries.
-
Technological advancements in wireless technology and IoT integration have enhanced the effectiveness and reliability of gas detection systems, increasing their attractiveness to end-users.
Technological advancements, especially in wireless technology and the integration of the Internet of Things (IoT), have dramatically improved the performance and reliability of gas detection systems. These innovations facilitate real-time monitoring and data transmission, allowing users to receive immediate alerts regarding potential gas leaks or hazardous conditions. IoT-enabled gas detectors can transmit data to central monitoring systems or mobile devices, ensuring safety personnel can respond promptly to emergencies. This capability significantly reduces the risk of accidents and enhances workplace safety.
Furthermore, advancements in sensor technology have resulted in the creation of more sensitive and accurate gas detectors, which can identify a broader range of gases, including those that are otherwise challenging to detect. Enhanced sensitivity allows for earlier detection of gas leaks, a critical factor in preventing accidents and ensuring compliance with safety regulations. According to a report by the National Institute for Occupational Safety and Health (NIOSH), effective gas detection has the potential to avert numerous workplace accidents linked to gas leaks. Additionally, the implementation of advanced algorithms and machine learning in gas detection systems improves data analysis, enabling predictive maintenance and minimizing false alarms. These advancements make gas detection systems increasingly appealing to end-users across various sectors, including manufacturing, oil and gas, and healthcare. They not only enhance safety but also improve operational efficiency and reduce costs. This technological evolution in gas detection represents a significant stride toward creating safer work environments and underscores the importance of ongoing innovation in this critical field.
RESTRAIN
-
Concerns about wireless security arise from the risk of cyber threats and hacking, which can deter potential users from adopting wireless gas detection systems.
Concerns about wireless security are a significant barrier to the adoption of wireless gas detection systems. As these systems increasingly rely on wireless communication and IoT integration, the risks associated with cyber threats and hacking become more pronounced. According to study in 2022, the average cost of a data breach reached approximately USD 4.35 million, emphasizing the financial implications of inadequate cybersecurity measures. This potential for data breaches and unauthorized access raises alarms among potential users, particularly in industries such as oil and gas, healthcare, and manufacturing, where the consequences of a cyberattack can be catastrophic.
Moreover, incidents of cyberattacks on critical infrastructure have become more frequent, with the Cybersecurity and Infrastructure Security Agency (CISA) reporting a 400% increase in cyberattacks on critical infrastructure in recent years. This alarming trend creates an environment of skepticism regarding the reliability and security of wireless technologies in gas detection applications. Users may worry about the possibility of hackers manipulating gas detection systems to disable alarms or alter readings, putting lives at risk. To address these concerns, manufacturers must prioritize the implementation of robust cybersecurity measures, such as encryption, regular software updates, and secure authentication protocols. Educating users about these security features and promoting transparency regarding cybersecurity practices can help build trust and encourage the adoption of wireless gas detection systems. Without addressing these security concerns, the full potential of wireless technology in enhancing safety and efficiency in gas detection will remain underutilized.
KEY SEGMENTATION ANALYSIS
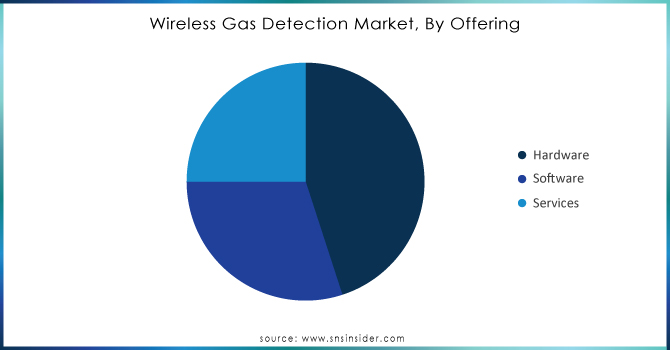
By Offering: The hardware segment dominated the market share over 48.06% in 2023, which includes essential physical devices like sensors, transmitters, and detectors. These components are critical for real-time gas level monitoring and safety across industries such as oil and gas, chemicals, and mining. With increasing regulatory requirements and heightened awareness of workplace safety, the demand for reliable and efficient gas detection systems is on the rise. Notably, the hardware segment is driven by advancements in sensor technology, offering enhanced sensitivity, reliability, and integration capabilities. According to research, approximately 60% of market investments are directed toward hardware solutions, reflecting their fundamental importance in ensuring environmental and worker safety.
Do You Need any Customization Research on Wireless Gas Detection Market - Enquire Now
By Application: The Industrial Safety segment dominated the market share over 38.06%in 2023. Industries such as oil and gas, chemical manufacturing, and mining face significant risks from hazardous gases, necessitating reliable detection systems to protect workers and ensure compliance. According to reports, approximately 90% of industrial accidents are preventable with effective gas detection solutions. Additionally, 40% of organizations are increasing their investments in safety infrastructure to mitigate risks. The rise in occupational health and safety (OHS) awareness further fuels the demand for advanced gas detection technologies. As businesses strive to adhere to safety regulations and improve workplace environments, the Industrial Safety segment is poised for sustained growth, reflecting the ongoing commitment to protecting employees and enhancing operational safety standards across various industries.
KEY REGIONAL ANALYSIS
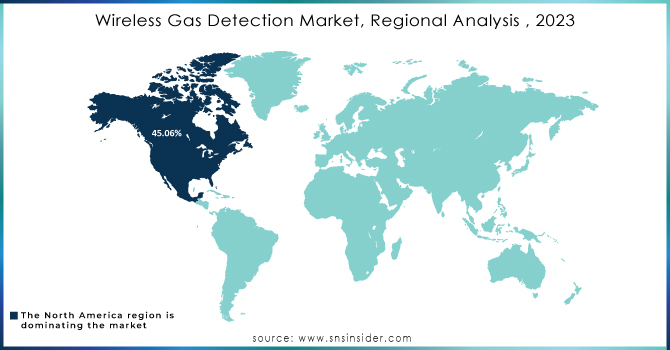
North America region dominated the market share over 45.06% in 2023. The presence of major industry players, such as Honeywell, Siemens, and Dräger, contributes significantly to market growth through innovative product offerings and advanced technologies. The region benefits from rigorous safety regulations imposed by organizations like OSHA (Occupational Safety and Health Administration) and EPA (Environmental Protection Agency), ensuring that industries comply with high safety standards.
Additionally, the chemical and mining industries increasingly adopt wireless gas detection systems to enhance operational safety and improve response times in emergency situations. According to recent research, around 80% of industrial facilities in North America are investing in smart gas detection technologies, indicating a strong shift towards wireless solutions. The region's proactive approach to safety and technology integration positions it as a frontrunner in this evolving market.
The Asia-Pacific region is poised for rapid growth in the Wireless Gas Detection Market, driven by several key factors. Rapid industrialization and urbanization are leading to an increased number of industrial facilities, which require robust safety measures to protect workers and the environment. Countries like China and India are witnessing significant investments in infrastructure development, including factories and refineries, necessitating advanced gas detection systems. Furthermore, there is a heightened awareness of worker safety and stringent environmental regulations, pushing industries to adopt innovative technologies for monitoring hazardous gases. For instance, China aims to improve its workplace safety standards, with a significant focus on the oil and gas sector, where gas detection is critical. Additionally, Japan’s efforts to enhance safety protocols following past industrial accidents have further fueled demand.
KEY PLAYERS
Some of the major key players of Wireless Gas Detection Market
-
Yokogawa India Ltd. (Gas Leak Detection Systems)
-
MSA Safety Incorporated (Wireless Gas Detectors)
-
Honeywell International Inc. (GasAlertMicro 5 Series)
-
Drägerwerk AG & Co. KGaA (X-am® 8000 Multi-Gas Detector)
-
Teledyne Technologies Incorporated (GasPoint™ Wireless Gas Detection)
-
Agilent Technologies, Inc. (Micro GC Gas Analyzers)
-
Emerson Electric Co. (Rosemount™ Gas Detectors)
-
Siemens (SITRANS GD2 Wireless Gas Detector)
-
Sensidyne (PIRANHA® Wireless Gas Detectors)
-
Tek Troniks Limited (Wireless Toxic Gas Detectors)
-
Pem-Tech Inc. (Wireless Gas Detection Systems)
-
Ambetronics Engineers Pvt. Ltd. (Gas Detection Systems)
-
3M (Multi-Gas Detectors)
-
Global Detection Systems Corp. (Wireless Gas Monitors)
-
Bacharach, Inc. (GasTrac™ Wireless Leak Detection)
-
Gastronics (Wireless Gas Detection Sensors)
-
RAE Systems Inc. (A Honeywell Company) (MultiRAE Wireless Multi-Gas Detector)
-
MSA ALTAIR® (ALTAIR 5X Gas Detector)
-
Crowcon Detection Instruments Ltd. (Gasman Wireless Detectors)
-
Ventis® Pro5 (Wireless Multi-Gas Detector)
Suppliers for Specializes in a wide range of gas detection solutions, including wireless systems for various applications of Wireless Gas Detection Market:
-
Honeywell Analytics
-
Dräger
-
MSA Safety
-
Crowcon Detection Instruments
-
RKI Instruments
-
Industrial Scientific Corporation
-
GfG Instrumentation
-
Sensors & Software Inc.
-
Air Monitors Ltd.
-
Teledyne Gas and Flame Detection
RECENT DEVELOPMENT
In 2024: Comelit-PAC has launched a new range of wireless fire alarm products that simplify installation and enable cloud monitoring, catering to both residential and commercial applications. This development enhances fire safety solutions by reducing installation time and costs while adhering to rising fire safety legislation.
In April 2023: Teledyne FLIR, a division of Teledyne Technologies Incorporated, introduced new G-Series. This innovative family of advanced, cooled-core optical gas imaging (OGI) cameras is designed to assist leak detection and repair (LDAR) experts in effortlessly pinpointing and documenting hazardous gas emissions.
In Jan 2023: Siemens introduced the FDA261 and FDA262 digitalized aspirating smoke detectors, specifically tailored for the effective safeguarding of large areas requiring enhanced protection.
In March 2023: Emerson Electric Co. partnered with Chevron to deploy wireless gas detection systems across its offshore oil platforms. This partnership focuses on enhancing worker safety in hazardous environments while reducing maintenance costs associated with wired systems.
| Report Attributes | Details |
|---|---|
| Market Size in 2023 | USD 3.02 Billion |
| Market Size by 2032 | USD 11.18 Billion |
| CAGR | CAGR of 15.71% From 2024 to 2032 |
| Base Year | 2023 |
| Forecast Period | 2024-2032 |
| Historical Data | 2020-2022 |
| Report Scope & Coverage | Market Size, Segments Analysis, Competitive Landscape, Regional Analysis, DROC & SWOT Analysis, Forecast Outlook |
| Key Segments | • By Offering (Hardware, Software, Services) • By Application (Industrial Safety, National Safety and Military Security, Environmental Safety) • By Technology (Wi-fi, Bluetooth, License-free ISM band, Cellular technology, Others) • By End-user (Oil & Gas, Chemicals and Petrochemicals, Utilities and Power Generation, Mining and Metals, Water and Wastewater Treatment Plants, Commercial Buildings and Public Facilities, Government and Military, Discrete Manufacturing Industries, Others) • By Detection Technology (Electrochemical Sensors, Catalytic Bead Sensors, Infrared Sensors, Photoionization Detectors, Ultrasonic Sensors) • By Gas Type(Toxic Gases, Combustible Gases, Oxygen, Refrigerants, Specialty Gases) |
| Regional Analysis/Coverage | North America (US, Canada, Mexico), Europe (Eastern Europe [Poland, Romania, Hungary, Turkey, Rest of Eastern Europe] Western Europe] Germany, France, UK, Italy, Spain, Netherlands, Switzerland, Austria, Rest of Western Europe]), Asia Pacific (China, India, Japan, South Korea, Vietnam, Singapore, Australia, Rest of Asia Pacific), Middle East & Africa (Middle East [UAE, Egypt, Saudi Arabia, Qatar, Rest of Middle East], Africa [Nigeria, South Africa, Rest of Africa], Latin America (Brazil, Argentina, Colombia, Rest of Latin America) |
| Company Profiles | Yokogawa India Ltd., MSA Safety Incorporated, Honeywell International Inc., Drägerwerk AG & Co. KGaA, Teledyne Technologies Incorporated, Agilent Technologies, Inc., Emerson Electric Co., Siemens, Sensidyne, Tek Troniks Limited, Pem-Tech Inc., Ambetronics Engineers Pvt. Ltd., 3M, Global Detection Systems Corp., Bacharach, Inc., Gastronics, RAE Systems Inc. (A Honeywell Company), MSA ALTAIR®, Crowcon Detection Instruments Ltd., Ventis® Pro5. |
| Key Drivers | • Increasing safety regulations are driving the demand for reliable gas detection systems as industries like oil and gas, mining, and chemicals must comply with stricter safety standards to protect workers and the environment. •Technological advancements in wireless technology and IoT integration have enhanced the effectiveness and reliability of gas detection systems, increasing their attractiveness to end-users. |
| RESTRAINTS | • Concerns about wireless security arise from the risk of cyber threats and hacking, which can deter potential users from adopting wireless gas detection systems. |
Get in Touch
