3D Memory Market Report Scope & Overview:
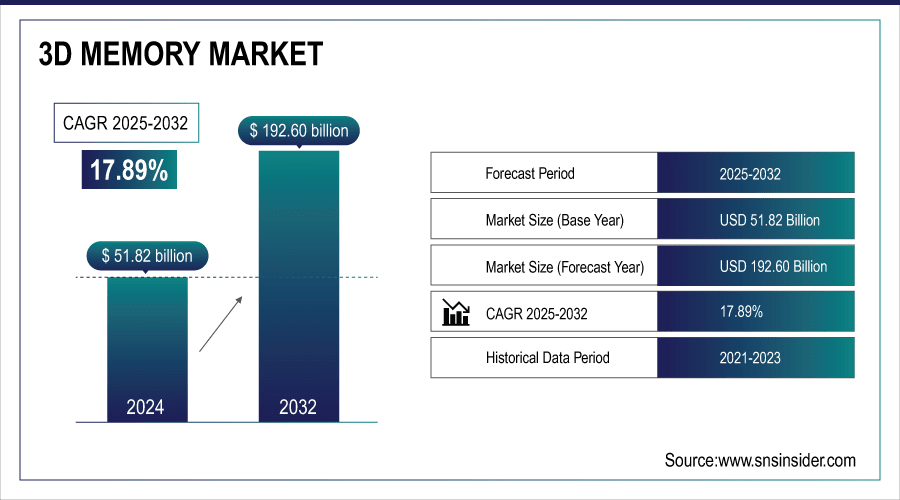
The 3D Memory Market size was valued at USD 51.82 Billion in 2024 and is projected to reach USD 192.60 Billion by 2032, growing at a CAGR of 17.89% during 2025-2032.
The 3D Memory market report provides a comprehensive analysis of the evolving semiconductor memory landscape, focusing on advanced architectures such as 3D NAND and 3D DRAM. high demand in cloud storage and increasing market for smart phones and tablets are the key factors contributing in the growth of the market. It underscores how the increasing need for high capacity storage, faster data processing and a small form factor is driving adoption in consumer electronics, data centers and automotive. The report includes various factors such as manufacturing trends, and the latest technological developments that currently impact the growth of the market.
3D NAND Accounts for ~75% share of the overall 3D memory market in 2024, driven by smartphones, SSDs, and data centers.

To Get More Information On 3D Memory Market - Request Free Sample Report
Key 3D Memory Market Trends
-
Increasing need for ultra-fast, high-capacity 3D NAND and DRAM to power AI, ML and high performance computing workloads.
-
Fast deployment of IoT in smart homes, industrial automation and connected devices accelerating demand for small energy-efficient memory.
-
Increasing adoption of 3D memory in driverless and connected cars that can handle large real-time data dependably.
-
5G network rollouts and demand for greater memory capacity in smartphones, enterprise products and cloud services.
-
Hyper-growth of hyperscale data centers and edge compute infrastructure fueling the need for scalable high-performance memory solutions.
The U.S. 3D Memory Market size was valued at USD 11.70 Billion in 2024 and is projected to reach USD 42.75 Billion by 2032, growing at a CAGR of 17.64% during 2025-2032. 3D Memory Market growth has been propelled by growing demand for large storage capacity, fast data processing, and slim devices in consumer electronics. The fast-growing numbers of cloud / datacenter, AI, and high-performance computing (HPC) applications are the other growth drivers, since there is a need for high-capacity and eco-friendly technologies.

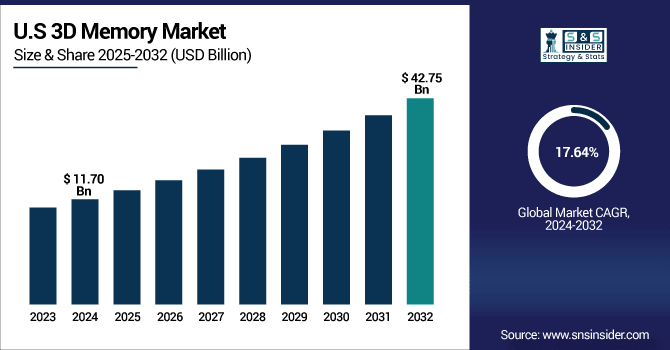
Progress in 5G, IoT and autonomous driving are driving demand for more robust and higher-quality memory. Strong fabrication bases in Asia Pacific, supported by R&D efforts in North America and Europe, are driving 3D NAND and 3D DRAM forward resolutely, thus both 3D NAND and 3D DRAM can hence be reckoned as the vital foundations of the semiconductor industry in the coming years.
3D Memory Market Growth Drivers:
-
Rising Demand for High-Capacity, Fast, and Efficient Memory Solutions Across Industries.
Rise in Demand for High-Performance, Miniaturized and Low-Power-Required Memory Solutions Driving 3D Memory Market The need for high-performance, energy-efficient, and small form factor memory solutions in various industries is expected to drive the market for 3D memory. Demand for 3D NAND and DRAM has been soaring on the growing usage of smartphones, tablets and laptops, which require increased processing speed and storage. Large data centers and cloud computing companies are spending big on 3D memory to help make sense of the tidal wave of data being generated. Moreover, AI, IoT, machine learning among other emerging techs need sophisticated memory architecture to function holistically.
Smartphones account for ~30% of global 3D NAND demand in 2024, with average storage capacity per device rising by ~20% YoY.
3D Memory Market Restraints:
-
High Production Costs, Yield Challenges, and Reliability Issues Restricting 3D Memory Market Expansion
However, there are several constraints in the 3D Memory market. High production and processing costs hinder adoption, in particular by small and medium device manufacturers. Low yield in complex stacking leads to higher defect rates and a decrease in profitability. Reliability issues endurance limits, thermal issues, and data retention also impede practical deployment. Beyond that, supply chain disruptions and reliance on a handful of key players continue to limit availability and price stability. Moreover, the fast dynamic of technological improvement puts manufactures under pressure to balance R&D cost and commercialization.
3D Memory Market Opportunities:
-
Expanding Applications in AI, IoT, and Autonomous Systems Creating New Growth Opportunities
Market opportunities in the 3D Memory market are huge with increased penetration of next generation technologies. AI and ML applications require ultra-fast, high density memory solutions as a result providing new revenue streams for 3D-NAND and DRAM. Growth of the IoT ecosystem, including smart homes to industrial automation, is increasing the need for space-efficient and low-power memory. Growing investment in edge computing and data centers to widen the scope For Key market. All of these trends together will make 3D memory a foundation technology for digital transformation in the future.
Data storage demand is expected to reach ~180 zettabytes by 2025, positioning 3D NAND as the preferred memory architecture for hyperscale facilities.
Key 3D Memory Market Segment Analysis
-
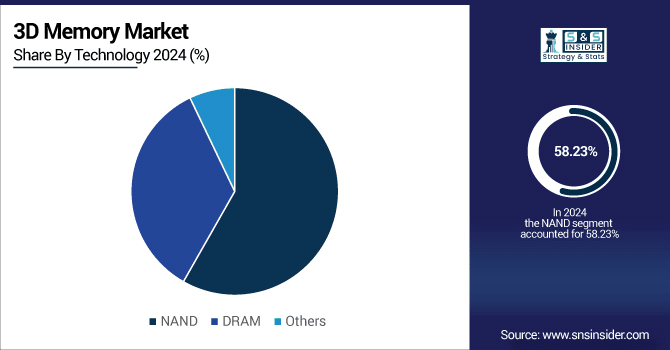
By Technology, NAND led with ~ 58.23% share in 2024; DRAM fastest growing (CAGR 18.11%).
-
By Type, TLC (Triple-Level Cell) dominated ~ 57.34% in 2024; QLC (Quad-Level Cell) fastest growing (CAGR 18.47%).
-
By Application, Consumer Electronics led ~ 41.29% in 2024; Automotive fastest growing (CAGR 18.48%).
-
By End-User, IT and Telecommunications held ~ 43.79% in 2024 and also fastest growing (CAGR 18.23%).
By Technology, NAND Leads Market While DRAM Registers Fastest Growth
In 2024, NAND dominates the 3D memory market owing to its widespread use in smartphones, SSDs, and data centers, accounting for the largest revenue share in 2024. It is the prevalent choice for consumer effective and superior in penetration in consumer and enterprise. At the same time, DRAM is set to see the strongest growth as demand shoots up in AI, machine learning and high-performance computing jobs. DRAM is also benefiting from the automotive market and edge devices which require high-speed and stable products. Indeed, NAND and DRAM are driving the 3D memory market in the near and long term.

By Type, TLC (Triple-Level Cell) Dominate While QLC (Quad-Level Cell) Shows Rapid Growth
In 2024, TLC (Triple-Level Cell) dominates the 3D memory market higher density storage able to provide more performance than 2D solutions, with relatively low cost, and it is currently the most commonly used solution in consumer electronics and enterprise SSDs. In smartphones, notebooks and data centers, TLC is favored for its lower cost and reliability. Its application is growing in high density storage solutions, enterprise SSD, cloud data centers, and more. This transition emphasizes TLC's leadership as QLC becomes the next growth catalyst in the market.
By Application, Consumer Electronics Lead While Automotive Registers Fastest Growth
In 2024, Consumer electronics dominate the 3D memory market due to the widespread use of smartphones, tablets, laptops, and gaming devices in need for high-density memory solution at high performance. This category owns the maximum market share in 2024 on account of ongoing requirement for enhanced processing & storage requirement. At the same time, the automotive market is experiencing the most rapid expansion, driven by the emergence of self-driving, advanced in-vehicle infotainment (IVI), and connected car systems. The demand for real-time data processing and robust memory technologies is increasing drive in this market.
By End-User, IT and Telecommunications Lead and Grow Fastest
In 2024, IT and telecommunications sector both leads and grows fastest in the 3D memory market, on account of the growth in data centers, cloud services, and high-speed network infrastructure. The demand for 3D NAND and DRAM is growing as the footprint of such memories increases within enterprise infrastructure and cloud data centers and as chip designs move from planar to three-dimensional architectures. The rise of AI, big data analytics and 5G roll leaves the bandwidth demand fire on this sector’s tail. Ongoing digitalization at all companies will ensure widespread use of more advanced memory solutions. As such, IT and telecom continue to be the two major sectors for market lead and swift expansion.
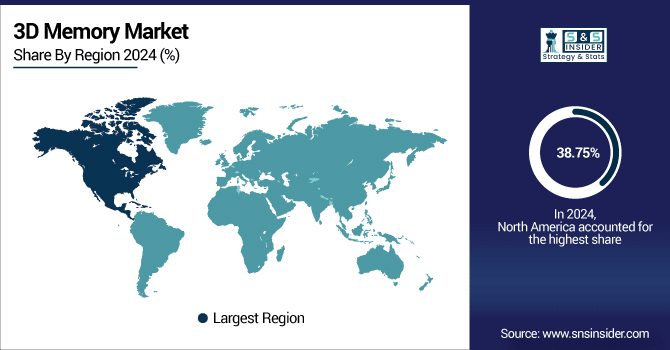
North America 3D Memory Market Insights
In 2024 North America dominated the 3D Memory Market and accounted for 38.75% of revenue share, this leadership is due to the largest semiconductor companies, being the best advanced R&D laboratories, and being the first to embrace all shiny new things. Robust adoption by cloud service providers, data centers and enterprise IT infrastructure also shored up its position in the market. Furthermore, on-going investment in AI, edge processes and 5G networks are fuelling continual expansion in the region.

Get Customized Report as Per Your Business Requirement - Enquiry Now
U.S. 3D Memory Market Insights
North American 3D Memory market is dominated by U.S. on account of advanced semiconductor industry and robust R&D facilities. Cloud service providers, data centers, and artificial intelligence applications demand is also robust. What is more, supportive investments and an early uptake of new technologies, such as 5G and autonomous vehicles, keep the market growth momentum.
Asia-Pacific 3D Memory Market Insights
Asia-Pacific is anticipated to grow at a highest CAGR growth in the 3D Memory Market Insights across 2025-2032 with a CAGR of 18.33% owing to the strong presence of a manufacturing base and the growing semiconductor production in the region. With the rapid proliferation of smartphones, consumer electronics, and industrial IoT applications, there is a need for high density memory solutions. And investment in data centers, AI and 5G infrastructure help to stoke market growth ahead.
China 3D Memory Market Insights
China leads the 3D Memory market, given its large semiconductor manufacturing ability and government support for electronics industry. Strong local demand in devices such as smartphones, data centers and consumer electronics, also supports its lead. Significant investment in advanced memory technologies drives continued growth and market leadership.
Europe 3D Memory Market Insights
Europe was a lucrative region in the 3D memory market, in 2024, as the region placed strong emphasis on semiconductor technology R&D. The existence of leading-edge manufacturing plants and innovation-centric firms facilitates the adoption of high-performance memory. Data center, automotive, and industrial applications are driving increased use of the technology. Furthermore, government programmes to drive digitization and technological development are boosting regional expansion.
Germany 3D Memory Market Insights
Germany is the leading country in Europe due to its higher quality of semiconductor manufactures and superior engineering presence. Rising demand from automotive and industrial automation industries also supplements the market growth. What's more, it's well positioned as the global leader with all the R&D it's pouring into its business, and with favorable government policies.
Latin America (LATAM) and Middle East & Africa (MEA) 3D Memory Market Insights
The 3D Memory Market is experiencing moderate growth in the Latin America (LATAM) and Middle East & Africa (MEA) regions, due to the limited semiconductor manufacturing infrastructure and slower technology adoption. Growing demand from consumer electronics, telecommunications, and small-scale data centers contributes to market expansion. Investments in digitalization and emerging technologies are gradually boosting memory requirements. Additionally, government initiatives and partnerships with global players are supporting steady regional growth.
Competitive Landscape for 3D Memory Market:
Samsung, is a leader in 3D memory, is advancing the 3D charge trap flash with its breakthrough V-NAND tech in NAND and DRAM. World’s First 3D V-NAND technology was developed and launched by the company in 2013, and now all Super charge V-NAND current products are ones made by the company. The company has also played a critical role in the development of AI, data center, mobile and other emerging applications by providing high-performance memory solutions that deliver optimum performance for high-sphere memory applications that can help enable memory-required AI and HPC applications.
-
In November 2024, Samsung launched the NRD-K R&D facility in Korea, spanning 109,000 square meters, to advance research in next-generation semiconductors.
Intel Corporation, a global technology leader, has been instrumental in advancing memory technologies, including 3D memory solutions. It enabled the creation of 3D NAND together with Micron Technology and was a revolutionary way to increase the storage capacity and speed of data. 3D XPoint technology (branded as Optane) (Intel) Allowed a new type of memory, blurring the line between DRAM and storage. Intel Intel left the 3D XPoint market in 2022, but it continues to shape the future storage t echnology landscape through R&D efforts in next generation memory technologies.
-
In December 2024, Intel introduced advancements in memory integration at the International Electron Devices Meeting (IEDM), focusing on eliminating capacity, bandwidth, and latency bottlenecks through hybrid bonding and modular system expansion.
Micron Technology has been known to lead them all with innovative achievements in NAND flash memory. The company has made great strides in capacity-dense storage innovations, such as its 9th generation (G9) TLC NAND with transfer rates up to a whopping 3.6 GB/s, and its 276-layer 3D NAND technology is the driving force behind its 2650 client SSD with improved efficiency and performance. The commitment of the company to R&D is reflected in the advancements of memory technologies.
-
In June 2025, the company introduced the Micron 2600 SSD, utilizing the industry's first 9th-generation QLC NAND and featuring Adaptive Write Technology, delivering up to 63% faster sequential write and 49% faster random write speeds compared to competing value QLC and TLC SSDs. Furthermore, Micron announced the upcoming release of the 6600 ION SSD, with samples shipping later in the third quarter of 2025, offering a capacity of 122TB, and the 9650 SSD, which is already shipping to customers, both utilizing the latest 276-layer 3D NAND technology.
SK hynix Inc. is a world top tier semiconductor supplier offering Dynamic Random-Access Memory chips (“DRAM”), Flash memory chips (“NAND Flash”) and CMOS Image Sensors (“CIS”) for a wide range of distinguished customers globally. Building on key 3D memory technology breakthroughs in recent years, the company has developed HBM and 3D NAND technologies to help data centers and other high-performance applications to meet growing demand for memory capacity and bandwidth.
-
In September 2024, the company commenced mass production of the world's first 12-layer HBM3E memory module, offering a 36GB capacity with speeds up to 9.6 Gbps, tailored for AI applications. Additionally, in November 2024, SK hynix began mass production of its 321-layer 4D NAND flash, marking a breakthrough in NAND technology. These advancements underscore SK hynix's leadership in developing high-performance memory solutions for AI-driven markets.
Toshiba Corp., a leader in the development of innovative memory solutions, has played a pivotal role throughout all aspects of 3D NAND flash memory, which in turn has enabled the current product configurations. Its subsidiary, Kioxia, developed BiCS FLASH™ which allows memory cells to be stacked on top of each other to increase storage density and performance. This breakthrough has played a significant role in the popularization of flash storage all over the world, from smartphones to data centers to consumer electronics.
-
In October 2024, Kioxia was honored with the FMS Lifetime Achievement Award for its contributions to 3D NAND technology. The company's ongoing research and development efforts continue to drive advancements in 3D memory solutions.
3D Memory Market Key Players:
Some of the 3D Memory Market Companies
-
Samsung Electronics Co., Ltd.
-
Intel Corporation
-
Micron Technology, Inc.
-
SK Hynix Inc.
-
Toshiba Corporation
-
Western Digital Corporation
-
SanDisk Corporation
-
IBM Corporation
-
NXP Semiconductors N.V.
-
Advanced Micro Devices, Inc. (AMD)
-
Qualcomm Incorporated
-
Broadcom Inc.
-
Texas Instruments Incorporated
-
STMicroelectronics N.V.
-
Infineon Technologies AG
-
Cypress Semiconductor Corporation
-
Renesas Electronics Corporation
-
ON Semiconductor Corporation
-
Winbond Electronics Corporation
-
Microchip Technology Inc.
Report Attributes | Details |
---|---|
Market Size in 2024 | USD 51.82 Billion |
Market Size by 2032 | USD 192.60 Billion |
CAGR | CAGR of 17.89% From 2025 to 2032 |
Base Year | 2024 |
Forecast Period | 2025-2032 |
Historical Data | 2021-2023 |
Report Scope & Coverage | Market Size, Segments Analysis, Competitive Landscape, Regional Analysis, DROC & SWOT Analysis, Forecast Outlook |
Key Segments | • By Technology (NAND, DRAM and Others), • By Type (SLC (Single-Level Cell), MLC (Multi-Level Cell), TLC (Triple-Level Cell) and QLC (Quad-Level Cell)) • By Application (Consumer Electronics, Automotive, Industrial, Enterprise Storage, and Others) • By End-User (BFSI, IT and Telecommunications, Healthcare, Retail, and Others) |
Regional Analysis/Coverage | North America (US, Canada, Mexico), Europe (Germany, France, UK, Italy, Spain, Poland, Turkey, Rest of Europe), Asia Pacific (China, India, Japan, South Korea, Singapore, Australia, Taiwan, Rest of Asia Pacific), Middle East & Africa (UAE, Saudi Arabia, Qatar, South Africa, Rest of Middle East & Africa), Latin America (Brazil, Argentina, Rest of Latin America) |
Company Profiles | Samsung Electronics Co., Ltd., Intel Corporation, Micron Technology, Inc., SK Hynix Inc., Toshiba Corporation, Western Digital Corporation, SanDisk Corporation, IBM Corporation, NXP Semiconductors N.V., Advanced Micro Devices, Inc. (AMD), Qualcomm, Incorporated, Broadcom Inc., Texas Instruments, Incorporated, STMicroelectronics N.V., Infineon Technologies AG, Cypress Semiconductor Corporation, Renesas Electronics Corporation, ON Semiconductor Corporation, Winbond Electronics Corporation and Microchip Technology Inc.. |
Table Of Contents
1. Introduction
1.1 Market Definition & Scope
1.2 Research Assumptions & Abbreviations
1.3 Research Methodology
2. Executive Summary
2.1 Market Snapshot
2.2 Market Absolute $ Opportunity Assessment & Y-o-Y Analysis, 2021–2032
2.3 Market Size & Forecast, By Segmentation, 2021–2032
2.3.1 Market Size By Technology
2.3.2 Market Size By Type
2.3.3 Market Size By Application
2.3.4 Market Size By End-User
2.4 Market Share & Bps Analysis By Region, 2024
2.5 Industry Growth Scenarios – Conservative, Likely & Optimistic
2.6 Industry CxO’s Perspective
3. Market Overview
3.1 Market Dynamics
3.1.1 Drivers
3.1.2 Restraints
3.1.3 Opportunities
3.1.4 Key Market Trends
3.2 Industry PESTLE Analysis
3.3 Key Industry Forces (Porter’s) Impacting Market Growth
3.4 Industry Supply Chain Analysis
3.4.1 Raw Material Suppliers
3.4.2 Manufacturers
3.4.3 Distributors/Suppliers
3.4.4 Customers/End-Users
3.5 Industry Life Cycle Assessment
3.6 Parent Market Overview
3.7 Market Risk Assessment
4. Statistical Insights & Trends Reporting
4.1 Manufacturing & Yield Statistics
4.1.1 Average production yield rate (%) for 3D NAND and 3D DRAM stacks
4.1.2 Defect rate (%) by stacking technique (e.g., TSV – Through Silicon Via, wafer-to-wafer bonding, die-to-wafer bonding)
4.1.3 Percentage of manufacturing plants using automated vs. semi-automated assembly lines
4.2 Application & Deployment Trends
4.2.1 Share of 3D memory used by end-use sector: Consumer electronics %, Data centers %, Automotive %, Medical & Industrial %
4.2.2 Average performance improvement (%) in devices enabled by 3D memory integration
4.2.3 Growth rate of adoption in AI/ML accelerators, HPC, and edge computing devices
4.3 Material & Technology Adoption Metrics
4.3.1 Percentage usage of NAND vs. DRAM vs. emerging memory types: NAND %, DRAM %, Emerging (ReRAM, MRAM, PCM) %
4.3.2 Penetration rate of advanced interconnects (e.g., copper TSV, hybrid bonding)
4.3.3 Average layer thickness (nm) of memory stacks
4.4 Reliability & Performance Data
4.4.1 Mean time between failures (MTBF) for 3D memory in critical applications
4.4.2 Average operating temperature tolerance range (°C)
4.4.3 Failure rate (%) after environmental stress testing (e.g., thermal cycling, voltage stress, humidity)
5. 3D Memory Market Segmental Analysis & Forecast, By Technology, 2021 – 2032, Value (USD Billion)
5.1 Introduction
5.2 NAND
5.2.1 Key Trends
5.2.2 Market Size & Forecast, 2021 – 2032
5.3 DRAM
5.3.1 Key Trends
5.3.2 Market Size & Forecast, 2021 – 2032
5.4 Others
5.4.1 Key Trends
5.4.2 Market Size & Forecast, 2021 – 2032
6. 3D Memory Market Segmental Analysis & Forecast, By Type, 2021 – 2032, Value (USD Billion)
6.1 Introduction
6.2 SLC (Single-Level Cell)
6.2.1 Key Trends
6.2.2 Market Size & Forecast, 2021 – 2032
6.3 MLC (Multi-Level Cell)
6.3.1 Key Trends
6.3.2 Market Size & Forecast, 2021 – 2032
6.4 TLC (Triple-Level Cell)
6.4.1 Key Trends
6.4.2 Market Size & Forecast, 2021 – 2032
6.5 QLC (Quad-Level Cell)
6.5.1 Key Trends
6.5.2 Market Size & Forecast, 2021 – 2032
7. 3D Memory Market Segmental Analysis & Forecast, By Application, 2021 – 2032, Value (USD Billion)
7.1 Introduction
7.2 Consumer Electronics
7.2.1 Key Trends
7.2.2 Market Size & Forecast, 2021 – 2032
7.3 Automotive
7.3.1 Key Trends
7.3.2 Market Size & Forecast, 2021 – 2032
7.4 Industrial
7.4.1 Key Trends
7.4.2 Market Size & Forecast, 2021 – 2032
7.5 Enterprise Storage
7.5.1 Key Trends
7.5.2 Market Size & Forecast, 2021 – 2032
7.6 Others
7.6.1 Key Trends
7.6.2 Market Size & Forecast, 2021 – 2032
8. 3D Memory Market Segmental Analysis & Forecast, By End-User, 2021 – 2032, Value (USD Billion)
8.1 Introduction
8.2 BFSI
8.2.1 Key Trends
8.2.2 Market Size & Forecast, 2021 – 2032
8.3 IT and Telecommunications
8.3.1 Key Trends
8.3.2 Market Size & Forecast, 2021 – 2032
8.4 Healthcare
8.4.1 Key Trends
8.4.2 Market Size & Forecast, 2021 – 2032
8.5 Retail
8.5.1 Key Trends
8.5.2 Market Size & Forecast, 2021 – 2032
8.6 Others
8.6.1 Key Trends
8.6.2 Market Size & Forecast, 2021 – 2032
9. 3D Memory Market Segmental Analysis & Forecast By Region, 2021 – 2025, Value (USD Billion)
9.1 Introduction
9.2 North America
9.2.1 Key Trends
9.2.2 3D Memory Market Size & Forecast, By Technology, 2021 – 2032
9.2.3 3D Memory Market Size & Forecast, By Type, 2021 – 2032
9.2.4 3D Memory Market Size & Forecast, By Application, 2021 – 2032
9.2.5 3D Memory Market Size & Forecast, By End-User, 2021 – 2032
9.2.6 3D Memory Market Size & Forecast, By Country, 2021 – 2032
9.2.6.1 USA
9.2.6.1.1 3D Memory Market Size & Forecast, By Technology, 2021 – 2032
9.2.6.1.2 3D Memory Market Size & Forecast, By Type, 2021 – 2032
9.2.6.1.3 3D Memory Market Size & Forecast, By Application, 2021 – 2032
9.2.6.1.4 3D Memory Market Size & Forecast, By End-User, 2021 – 2032
9.2.6.2 Canada
9.2.6.2.1 3D Memory Market Size & Forecast, By Technology, 2021 – 2032
9.2.6.2.2 3D Memory Market Size & Forecast, By Type, 2021 – 2032
9.2.6.2.3 3D Memory Market Size & Forecast, By Application, 2021 – 2032
9.2.6.2.4 3D Memory Market Size & Forecast, By End-User, 2021 – 2032
9.3 Europe
9.3.1 Key Trends
9.3.2 3D Memory Market Size & Forecast, By Technology, 2021 – 2032
9.3.3 3D Memory Market Size & Forecast, By Type, 2021 – 2032
9.3.4 3D Memory Market Size & Forecast, By Application, 2021 – 2032
9.3.5 3D Memory Market Size & Forecast, By End-User, 2021 – 2032
9.3.6 3D Memory Market Size & Forecast, By Country, 2021 – 2032
9.3.6.1 Germany
9.3.6.1.1 3D Memory Market Size & Forecast, By Technology, 2021 – 2032
9.3.6.1.2 3D Memory Market Size & Forecast, By Type, 2021 – 2032
9.3.6.1.3 3D Memory Market Size & Forecast, By Application, 2021 – 2032
9.3.6.1.4 3D Memory Market Size & Forecast, By End-User, 2021 – 2032
9.3.6.2 UK
9.3.6.2.1 3D Memory Market Size & Forecast, By Technology, 2021 – 2032
9.3.6.2.2 3D Memory Market Size & Forecast, By Type, 2021 – 2032
9.3.6.2.3 3D Memory Market Size & Forecast, By Application, 2021 – 2032
9.3.6.2.4 3D Memory Market Size & Forecast, By End-User, 2021 – 2032
9.3.6.3 France
9.3.6.3.1 3D Memory Market Size & Forecast, By Technology, 2021 – 2032
9.3.6.3.2 3D Memory Market Size & Forecast, By Type, 2021 – 2032
9.3.6.3.3 3D Memory Market Size & Forecast, By Application, 2021 – 2032
9.3.6.3.4 3D Memory Market Size & Forecast, By End-User, 2021 – 2032
9.3.6.4 Italy
9.3.6.4.1 3D Memory Market Size & Forecast, By Technology, 2021 – 2032
9.3.6.4.2 3D Memory Market Size & Forecast, By Type, 2021 – 2032
9.3.6.4.3 3D Memory Market Size & Forecast, By Application, 2021 – 2032
9.3.6.4.4 3D Memory Market Size & Forecast, By End-User, 2021 – 2032
9.3.6.5 Spain
9.3.6.5.1 3D Memory Market Size & Forecast, By Technology, 2021 – 2032
9.3.6.5.2 3D Memory Market Size & Forecast, By Type, 2021 – 2032
9.3.6.5.3 3D Memory Market Size & Forecast, By Application, 2021 – 2032
9.3.6.5.4 3D Memory Market Size & Forecast, By End-User, 2021 – 2032
9.3.6.6 Russia
9.3.6.6.1 3D Memory Market Size & Forecast, By Technology, 2021 – 2032
9.3.6.6.2 3D Memory Market Size & Forecast, By Type, 2021 – 2032
9.3.6.6.3 3D Memory Market Size & Forecast, By Application, 2021 – 2032
9.3.6.6.4 3D Memory Market Size & Forecast, By End-User, 2021 – 2032
9.3.6.7 Poland
9.3.6.7.1 3D Memory Market Size & Forecast, By Technology, 2021 – 2032
9.3.6.7.2 3D Memory Market Size & Forecast, By Type, 2021 – 2032
9.3.6.7.3 3D Memory Market Size & Forecast, By Application, 2021 – 2032
9.3.6.7.4 3D Memory Market Size & Forecast, By End-User, 2021 – 2032
9.3.6.8 Rest of Europe
9.3.6.8.1 3D Memory Market Size & Forecast, By Technology, 2021 – 2032
9.3.6.8.2 3D Memory Market Size & Forecast, By Type, 2021 – 2032
9.3.6.8.3 3D Memory Market Size & Forecast, By Application, 2021 – 2032
9.3.6.8.4 3D Memory Market Size & Forecast, By End-User, 2021 – 2032
9.4 Asia-Pacific
9.4.1 Key Trends
9.4.2 3D Memory Market Size & Forecast, By Technology, 2021 – 2032
9.4.3 3D Memory Market Size & Forecast, By Type, 2021 – 2032
9.4.4 3D Memory Market Size & Forecast, By Application, 2021 – 2032
9.4.5 3D Memory Market Size & Forecast, By End-User, 2021 – 2032
9.4.6 3D Memory Market Size & Forecast, By Country, 2021 – 2032
9.4.6.1 China
9.4.6.1.1 3D Memory Market Size & Forecast, By Technology, 2021 – 2032
9.4.6.1.2 3D Memory Market Size & Forecast, By Type, 2021 – 2032
9.4.6.1.3 3D Memory Market Size & Forecast, By Application, 2021 – 2032
9.4.6.1.4 3D Memory Market Size & Forecast, By End-User, 2021 – 2032
9.4.6.2 India
9.4.6.2.1 3D Memory Market Size & Forecast, By Technology, 2021 – 2032
9.4.6.2.2 3D Memory Market Size & Forecast, By Type, 2021 – 2032
9.4.6.2.3 3D Memory Market Size & Forecast, By Application, 2021 – 2032
9.4.6.2.4 3D Memory Market Size & Forecast, By End-User, 2021 – 2032
9.4.6.3 Japan
9.4.6.3.1 3D Memory Market Size & Forecast, By Technology, 2021 – 2032
9.4.6.3.2 3D Memory Market Size & Forecast, By Type, 2021 – 2032
9.4.6.3.3 3D Memory Market Size & Forecast, By Application, 2021 – 2032
9.4.6.3.4 3D Memory Market Size & Forecast, By End-User, 2021 – 2032
9.4.6.4 South Korea
9.4.6.4.1 3D Memory Market Size & Forecast, By Technology, 2021 – 2032
9.4.6.4.2 3D Memory Market Size & Forecast, By Type, 2021 – 2032
9.4.6.4.3 3D Memory Market Size & Forecast, By Application, 2021 – 2032
9.4.6.4.4 3D Memory Market Size & Forecast, By End-User, 2021 – 2032
9.4.6.5 Australia
9.4.6.5.1 3D Memory Market Size & Forecast, By Technology, 2021 – 2032
9.4.6.5.2 3D Memory Market Size & Forecast, By Type, 2021 – 2032
9.4.6.5.3 3D Memory Market Size & Forecast, By Application, 2021 – 2032
9.4.6.5.4 3D Memory Market Size & Forecast, By End-User, 2021 – 2032
9.4.6.6 ASEAN Countries
9.4.6.6.1 3D Memory Market Size & Forecast, By Technology, 2021 – 2032
9.4.6.6.2 3D Memory Market Size & Forecast, By Type, 2021 – 2032
9.4.6.6.3 3D Memory Market Size & Forecast, By Application, 2021 – 2032
9.4.6.6.4 3D Memory Market Size & Forecast, By End-User, 2021 – 2032
9.4.6.7 Rest of Asia-Pacific
9.4.6.7.1 3D Memory Market Size & Forecast, By Technology, 2021 – 2032
9.4.6.7.2 3D Memory Market Size & Forecast, By Type, 2021 – 2032
9.4.6.7.3 3D Memory Market Size & Forecast, By Application, 2021 – 2032
9.4.6.7.4 3D Memory Market Size & Forecast, By End-User, 2021 – 2032
9.5 Latin America
9.5.1 Key Trends
9.5.2 3D Memory Market Size & Forecast, By Technology, 2021 – 2032
9.5.3 3D Memory Market Size & Forecast, By Type, 2021 – 2032
9.5.4 3D Memory Market Size & Forecast, By Application, 2021 – 2032
9.5.5 3D Memory Market Size & Forecast, By End-User, 2021 – 2032
9.5.6 3D Memory Market Size & Forecast, By Country, 2021 – 2032
9.5.6.1 Brazil
9.5.6.1.1 3D Memory Market Size & Forecast, By Technology, 2021 – 2032
9.5.6.1.2 3D Memory Market Size & Forecast, By Type, 2021 – 2032
9.5.6.1.3 3D Memory Market Size & Forecast, By Application, 2021 – 2032
9.5.6.1.4 3D Memory Market Size & Forecast, By End-User, 2021 – 2032
9.5.6.2 Argentina
9.5.6.2.1 3D Memory Market Size & Forecast, By Technology, 2021 – 2032
9.5.6.2.2 3D Memory Market Size & Forecast, By Type, 2021 – 2032
9.5.6.2.3 3D Memory Market Size & Forecast, By Application, 2021 – 2032
9.5.6.2.4 3D Memory Market Size & Forecast, By End-User, 2021 – 2032
9.5.6.3 Mexico
9.5.6.3.1 3D Memory Market Size & Forecast, By Technology, 2021 – 2032
9.5.6.3.2 3D Memory Market Size & Forecast, By Type, 2021 – 2032
9.5.6.3.3 3D Memory Market Size & Forecast, By Application, 2021 – 2032
9.5.6.3.4 3D Memory Market Size & Forecast, By End-User, 2021 – 2032
9.5.6.4 Colombia
9.5.6.4.1 3D Memory Market Size & Forecast, By Technology, 2021 – 2032
9.5.6.4.2 3D Memory Market Size & Forecast, By Type, 2021 – 2032
9.5.6.4.3 3D Memory Market Size & Forecast, By Application, 2021 – 2032
9.5.6.4.4 3D Memory Market Size & Forecast, By End-User, 2021 – 2032
9.5.6.5 Rest of Latin America
9.5.6.5.1 3D Memory Market Size & Forecast, By Technology, 2021 – 2032
9.5.6.5.2 3D Memory Market Size & Forecast, By Type, 2021 – 2032
9.5.6.5.3 3D Memory Market Size & Forecast, By Application, 2021 – 2032
9.5.6.5.4 3D Memory Market Size & Forecast, By End-User, 2021 – 2032
9.6 Middle East & Africa
9.6.1 Key Trends
9.6.2 3D Memory Market Size & Forecast, By Technology, 2021 – 2032
9.6.3 3D Memory Market Size & Forecast, By Type, 2021 – 2032
9.6.4 3D Memory Market Size & Forecast, By Application, 2021 – 2032
9.6.5 3D Memory Market Size & Forecast, By End-User, 2021 – 2032
9.6.6 3D Memory Market Size & Forecast, By Country, 2021 – 2032
9.6.6.1 UAE
9.6.6.1.1 3D Memory Market Size & Forecast, By Technology, 2021 – 2032
9.6.6.1.2 3D Memory Market Size & Forecast, By Type, 2021 – 2032
9.6.6.1.3 3D Memory Market Size & Forecast, By Application, 2021 – 2032
9.6.6.1.4 3D Memory Market Size & Forecast, By End-User, 2021 – 2032
9.6.6.2 Saudi Arabia
9.6.6.2.1 3D Memory Market Size & Forecast, By Technology, 2021 – 2032
9.6.6.2.2 3D Memory Market Size & Forecast, By Type, 2021 – 2032
9.6.6.2.3 3D Memory Market Size & Forecast, By Application, 2021 – 2032
9.6.6.2.4 3D Memory Market Size & Forecast, By End-User, 2021 – 2032
9.6.6.3 Qatar
9.6.6.3.1 3D Memory Market Size & Forecast, By Technology, 2021 – 2032
9.6.6.3.2 3D Memory Market Size & Forecast, By Type, 2021 – 2032
9.6.6.3.3 3D Memory Market Size & Forecast, By Application, 2021 – 2032
9.6.6.3.4 3D Memory Market Size & Forecast, By End-User, 2021 – 2032
9.6.6.4 Egypt
9.6.6.4.1 3D Memory Market Size & Forecast, By Technology, 2021 – 2032
9.6.6.4.2 3D Memory Market Size & Forecast, By Type, 2021 – 2032
9.6.6.4.3 3D Memory Market Size & Forecast, By Application, 2021 – 2032
9.6.6.4.4 3D Memory Market Size & Forecast, By End-User, 2021 – 2032
9.6.6.5 South Africa
9.6.6.5.1 3D Memory Market Size & Forecast, By Technology, 2021 – 2032
9.6.6.5.2 3D Memory Market Size & Forecast, By Type, 2021 – 2032
9.6.6.5.3 3D Memory Market Size & Forecast, By Application, 2021 – 2032
9.6.6.5.4 3D Memory Market Size & Forecast, By End-User, 2021 – 2032
9.6.6.6 Rest of Middle East & Africa
9.6.6.6.1 3D Memory Market Size & Forecast, By Technology, 2021 – 2032
9.6.6.6.2 3D Memory Market Size & Forecast, By Type, 2021 – 2032
9.6.6.6.3 3D Memory Market Size & Forecast, By Application, 2021 – 2032
9.6.6.6.4 3D Memory Market Size & Forecast, By End-User, 2021 – 2032
10. Competitive Landscape
10.1 Key Players' Positioning
10.2 Competitive Developments
10.2.1 Key Strategies Adopted (%), By Key Players, 2024
10.2.2 Year-Wise Strategies & Development, 2021 – 2025
10.2.3 Number Of Strategies Adopted By Key Players, 2024
10.3 Market Share Analysis, 2024
10.4 Product/Service & Application Benchmarking
10.4.1 Product/Service Specifications & Features By Key Players
10.4.2 Product/Service Heatmap By Key Players
10.4.3 Application Heatmap By Key Players
10.5 Industry Start-Up & Innovation Landscape
10.6 Key Company Profiles
10.6.1 Samsung Electronics Co., Ltd.
10.6.1.1 Company Overview & Snapshot
10.6.1.2 Product/Service Portfolio
10.6.1.3 Key Company Financials
10.6.1.4 SWOT Analysis
10.6.2 Intel Corporation
10.6.2.1 Company Overview & Snapshot
10.6.2.2 Product/Service Portfolio
10.6.2.3 Key Company Financials
10.6.2.4 SWOT Analysis
10.6.3 Micron Technology, Inc.
10.6.3.1 Company Overview & Snapshot
10.6.3.2 Product/Service Portfolio
10.6.3.3 Key Company Financials
10.6.3.4 SWOT Analysis
10.6.4 SK Hynix Inc.
10.6.4.1 Company Overview & Snapshot
10.6.4.2 Product/Service Portfolio
10.6.4.3 Key Company Financials
10.6.4.4 SWOT Analysis
10.6.5 Toshiba Corporation
10.6.5.1 Company Overview & Snapshot
10.6.5.2 Product/Service Portfolio
10.6.5.3 Key Company Financials
10.6.5.4 SWOT Analysis
10.6.6 Western Digital Corporation
10.6.6.1 Company Overview & Snapshot
10.6.6.2 Product/Service Portfolio
10.6.6.3 Key Company Financials
10.6.6.4 SWOT Analysis
10.6.7 SanDisk Corporation
10.6.7.1 Company Overview & Snapshot
10.6.7.2 Product/Service Portfolio
10.6.7.3 Key Company Financials
10.6.7.4 SWOT Analysis
10.6.8 IBM Corporation
10.6.8.1 Company Overview & Snapshot
10.6.8.2 Product/Service Portfolio
10.6.8.3 Key Company Financials
10.6.8.4 SWOT Analysis
10.6.9 NXP Semiconductors N.V.
10.6.9.1 Company Overview & Snapshot
10.6.9.2 Product/Service Portfolio
10.6.9.3 Key Company Financials
10.6.9.4 SWOT Analysis
10.6.10 Advanced Micro Devices, Inc. (AMD)
10.6.10.1 Company Overview & Snapshot
10.6.10.2 Product/Service Portfolio
10.6.10.3 Key Company Financials
10.6.10.4 SWOT Analysis
10.6.11 Qualcomm Incorporated
10.6.11.1 Company Overview & Snapshot
10.6.11.2 Product/Service Portfolio
10.6.11.3 Key Company Financials
10.6.11.4 SWOT Analysis
10.6.12 Broadcom Inc.
10.6.12.1 Company Overview & Snapshot
10.6.12.2 Product/Service Portfolio
10.6.12.3 Key Company Financials
10.6.12.4 SWOT Analysis
10.6.13 Texas Instruments Incorporated
10.6.13.1 Company Overview & Snapshot
10.6.13.2 Product/Service Portfolio
10.6.13.3 Key Company Financials
10.6.13.4 SWOT Analysis
10.6.14 STMicroelectronics N.V.
10.6.14.1 Company Overview & Snapshot
10.6.14.2 Product/Service Portfolio
10.6.14.3 Key Company Financials
10.6.14.4 SWOT Analysis
10.6.15 Infineon Technologies AG
10.6.15.1 Company Overview & Snapshot
10.6.15.2 Product/Service Portfolio
10.6.15.3 Key Company Financials
10.6.15.4 SWOT Analysis
10.6.16 Cypress Semiconductor Corporation
10.6.16.1 Company Overview & Snapshot
10.6.16.2 Product/Service Portfolio
10.6.16.3 Key Company Financials
10.6.16.4 SWOT Analysis
10.6.17 Renesas Electronics Corporation
10.6.17.1 Company Overview & Snapshot
10.6.17.2 Product/Service Portfolio
10.6.17.3 Key Company Financials
10.6.17.4 SWOT Analysis
10.6.18 ON Semiconductor Corporation
10.6.18.1 Company Overview & Snapshot
10.6.18.2 Product/Service Portfolio
10.6.18.3 Key Company Financials
10.6.18.4 SWOT Analysis
10.6.19 Winbond Electronics Corporation
10.6.19.1 Company Overview & Snapshot
10.6.19.2 Product/Service Portfolio
10.6.19.3 Key Company Financials
10.6.19.4 SWOT Analysis
10.6.20 Fine Circuit Co., Ltd.
10.6.20.1 Company Overview & Snapshot
10.6.20.2 Product/Service Portfolio
10.6.20.3 Key Company Financials
10.6.20.4 SWOT Analysis
11. Microchip Technology Inc.
11.1 SNS Insider Opportunity Map
11.2 Industry Low-Hanging Fruit Assessment
11.3 Market Entry & Growth Strategy
11.4 Analyst Viewpoint & Suggestions On Market Growth
12. Assumptions
13. Disclaimer
14. Appendix
14.1 List Of Tables
14.2 List Of Figures
Key Segmentation
By Technology
-
NAND
-
DRAM
-
Others
By Type
-
SLC (Single-Level Cell)
-
MLC (Multi-Level Cell)
-
TLC (Triple-Level Cell)
-
QLC (Quad-Level Cell)
By Application
-
Consumer Electronics
-
Automotive
-
Industrial
-
Enterprise Storage
-
Others
By End-User
-
BFSI
-
IT and Telecommunications
-
Healthcare
-
Retail
-
Others
Request for Segment Customization as per your Business Requirement: Segment Customization Request
Regional Coverage:
North America
-
US
-
Canada
Europe
-
Germany
-
UK
-
France
-
Italy
-
Spain
-
Russia
-
Poland
-
Rest of Europe
Asia Pacific
-
China
-
India
-
Japan
-
South Korea
-
Australia
-
ASEAN Countries
-
Rest of Asia Pacific
Middle East & Africa
-
UAE
-
Saudi Arabia
-
Qatar
-
South Africa
-
Rest of Middle East & Africa
Latin America
-
Brazil
-
Argentina
-
Mexico
-
Colombia
-
Rest of Latin America
Request for Country Level Research Report: Country Level Customization Request
Available Customization
With the given market data, SNS Insider offers customization as per the company’s specific needs. The following customization options are available for the report:
-
Detailed Volume Analysis
-
Criss-Cross segment analysis (e.g. Product X Application)
-
Competitive Product Benchmarking
-
Geographic Analysis
-
Additional countries in any of the regions
-
Customized Data Representation
-
Detailed analysis and profiling of additional market player
An accurate research report requires proper strategizing as well as implementation. There are multiple factors involved in the completion of good and accurate research report and selecting the best methodology to compete the research is the toughest part. Since the research reports we provide play a crucial role in any company’s decision-making process, therefore we at SNS Insider always believe that we should choose the best method which gives us results closer to reality. This allows us to reach at a stage wherein we can provide our clients best and accurate investment to output ratio.
Each report that we prepare takes a timeframe of 350-400 business hours for production. Starting from the selection of titles through a couple of in-depth brain storming session to the final QC process before uploading our titles on our website we dedicate around 350 working hours. The titles are selected based on their current market cap and the foreseen CAGR and growth.
The 5 steps process:
Step 1: Secondary Research:
Secondary Research or Desk Research is as the name suggests is a research process wherein, we collect data through the readily available information. In this process we use various paid and unpaid databases which our team has access to and gather data through the same. This includes examining of listed companies’ annual reports, Journals, SEC filling etc. Apart from this our team has access to various associations across the globe across different industries. Lastly, we have exchange relationships with various university as well as individual libraries.

Step 2: Primary Research
When we talk about primary research, it is a type of study in which the researchers collect relevant data samples directly, rather than relying on previously collected data. This type of research is focused on gaining content specific facts that can be sued to solve specific problems. Since the collected data is fresh and first hand therefore it makes the study more accurate and genuine.
We at SNS Insider have divided Primary Research into 2 parts.
Part 1 wherein we interview the KOLs of major players as well as the upcoming ones across various geographic regions. This allows us to have their view over the market scenario and acts as an important tool to come closer to the accurate market numbers. As many as 45 paid and unpaid primary interviews are taken from both the demand and supply side of the industry to make sure we land at an accurate judgement and analysis of the market.
This step involves the triangulation of data wherein our team analyses the interview transcripts, online survey responses and observation of on filed participants. The below mentioned chart should give a better understanding of the part 1 of the primary interview.

Part 2: In this part of primary research the data collected via secondary research and the part 1 of the primary research is validated with the interviews from individual consultants and subject matter experts.
Consultants are those set of people who have at least 12 years of experience and expertise within the industry whereas Subject Matter Experts are those with at least 15 years of experience behind their back within the same space. The data with the help of two main processes i.e., FGDs (Focused Group Discussions) and IDs (Individual Discussions). This gives us a 3rd party nonbiased primary view of the market scenario making it a more dependable one while collation of the data pointers.
Step 3: Data Bank Validation
Once all the information is collected via primary and secondary sources, we run that information for data validation. At our intelligence centre our research heads track a lot of information related to the market which includes the quarterly reports, the daily stock prices, and other relevant information. Our data bank server gets updated every fortnight and that is how the information which we collected using our primary and secondary information is revalidated in real time.

Step 4: QA/QC Process
After all the data collection and validation our team does a final level of quality check and quality assurance to get rid of any unwanted or undesired mistakes. This might include but not limited to getting rid of the any typos, duplication of numbers or missing of any important information. The people involved in this process include technical content writers, research heads and graphics people. Once this process is completed the title gets uploader on our platform for our clients to read it.
Step 5: Final QC/QA Process:
This is the last process and comes when the client has ordered the study. In this process a final QA/QC is done before the study is emailed to the client. Since we believe in giving our clients a good experience of our research studies, therefore, to make sure that we do not lack at our end in any way humanly possible we do a final round of quality check and then dispatch the study to the client.