3D Radar Market Report Scope & Overview:
To get more information on 3D Radar Market - Request Free Sample Report
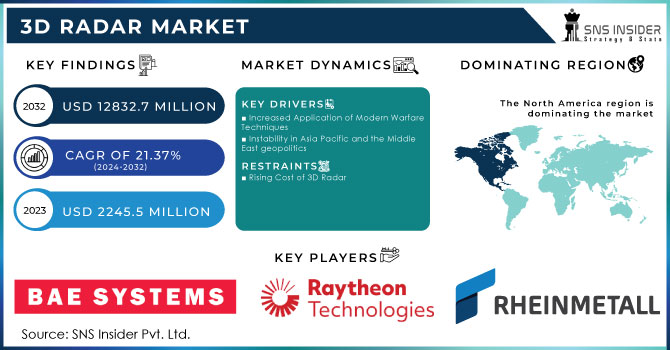
The 3D Radar Market Size was valued at USD 2245.5 million in 2023 expected to reach USD 12832.7 million by 2032 with a growing CAGR of 21.37% over the forecast period 2024-2032.
The term radar refers to a radio detection and ranging system. 2D radars have been updated to 3D radars. A three-dimensional image of an object is provided by a 3D radar in terms of elevation, range, and velocity. 3D radars can detect airborne targets automatically and effectively in all weather situations. The 3D radar system is wirelessly connected and may extract data to aid in 3D mapping of an area from numerous angles. 3D radars are utilised for weather monitoring, surveillance, and defence applications. Furthermore, 3D radars are extremely useful in predicting natural disasters such as floods, earthquakes, cyclones, and hurricanes. Furthermore, 3D radar can be utilised as a long-range warning system to detect hostile missiles and aircraft on the basis of their size and speed.
MARKET DYNAMICS
KEY DRIVERS
-
Increased Application of Modern Warfare Techniques
-
Instability in Asia Pacific and the Middle East geopolitics
RESTRAINTS
-
Rising Cost of 3D Radar
OPPORTUNITIES
-
Air and missile defence systems are increasingly being deployed.
-
3D Radar Miniaturization for UAVs and Unmanned Combat Vehicles
CHALLENGES
-
Fully Automated 3D Radar Vulnerability
THE IMPACT OF COVID-19
Due to the nature of COVID-19, research and development in 3D radar companies Globally has been disrupted due to announced closures and government restrictions on public gatherings.
As governments spend money switching to economic recovery due to the COVID-19 epidemic, industries are expected to reduce the number of 3D radar systems.
The production rate of companies that make 3D radar has been severely affected by the COVID-19 epidemic, as industries face a shortage of workers.
Several international nationwide military cancellations and declining military operations due to COVID-19 have had a negative impact on the market for military radars as demand for the remaining remaining components is low.
After COVID-19, the 3D radar market is expected to see significant growth as several countries have already ordered or planned to purchase their own radars.
The C/S/X band segment is predicted to lead the 3D radar market during the forecast period based on frequency band. The C-band radar is mostly used to track satellites across large distances. It is also employed in a variety of military applications, including battlefield surveillance. When compared to other forms of radar, C-band radar gives more accuracy and resolution. High frequencies, such as C-band frequencies, are typically affected by poor weather conditions, which in turn affect radar performance.
According to range, the medium range sector of the 3D radar market is expected to increase the most over the forecast period. The rising use of medium range 3D radar in defence applications is driving the expansion of this market segment. The medium range 3D radar provides real-time surveillance information without relying on high pulse devices. This radar can also exchange information in real time, allowing defence forces to conduct missile guidance, object mapping, and ground surveillance.
According to the platform, the ground segment of the 3D radar industry is expected to grow the fastest between 2017 and 2022. The rising usage of ground-based 3D radar in warfare to offer real-time information has contributed to the rise of this market sector. Some of the most important uses of ground-based 3D radar include situational awareness, threat appraisal, and tactical ballistic missile monitoring.
Some of the factors driving the Globally 3D radar market include an increase in the usage of contemporary combat strategies, the deployment of 3D radar in airports, and a growth in the number of unmanned aerial vehicles. However, the high installation and development costs of 3D radar, as well as the high expertise required for running and maintaining 3D radar systems, are impeding the growth of the 3D radar market. Although increased missile defence system deployment and technological breakthroughs such as 3D radar downsizing will provide new growth prospects in the global 3D radar market.
KEY MARKET SEGMENTATION
By Range
-
Long Range
-
Medium Range
-
Short Range
By Platform
-
Airborne
-
Ground
-
Naval
By Frequency Band
-
C/S/X Band
-
E/F Band
-
L Band
-
Others
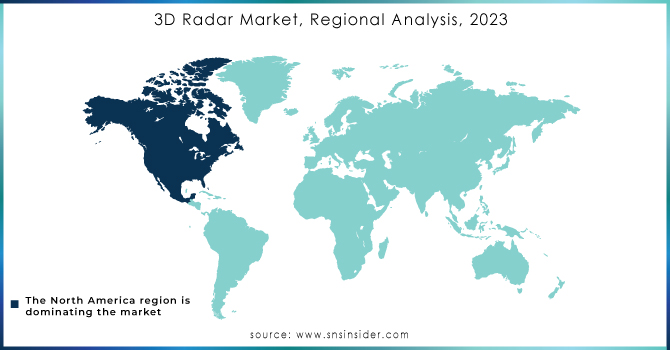
REGIONAL ANALYSIS
During the projected period, the North American region is expected to lead the 3D radar market. The rising demand for radar systems in surveillance activities might be linked to the rise of the North American 3D radar market. Furthermore, the US military forces are actively replacing their outdated radar systems with highly modern 3D radar systems, which is fueling the region's 3D radar market expansion.
Need any customization research on 3D Radar Market - Enquiry Now
REGIONAL COVERAGE:
-
North America
-
USA
-
Canada
-
Mexico
-
-
Europe
-
Germany
-
UK
-
France
-
Italy
-
Spain
-
The Netherlands
-
Rest of Europe
-
-
Asia-Pacific
-
Japan
-
south Korea
-
China
-
India
-
Australia
-
Rest of Asia-Pacific
-
-
The Middle East & Africa
-
Israel
-
UAE
-
South Africa
-
Rest of Middle East & Africa
-
-
Latin America
-
Brazil
-
Argentina
-
Rest of Latin America
-
KEY PLAYERS
The Major Players are BAE Systems, Raytheon Technologies Corporation, L3Harris Technologies Inc., Rheinmetall AG, Honeywell International Inc, Airbus S.A.S., Northrop Grumman Corporation, Thales Group, Saab AB, Leonardo S.p.A., and other players.
| Report Attributes | Details |
|---|---|
| Market Size in 2023 | US$ 2245.5 million |
| Market Size by 2032 | US$ 12832.7 million |
| CAGR | CAGR of 19.31% From 2024 to 2032 |
| Base Year | 2023 |
| Forecast Period | 2024-2032 |
| Historical Data | 2020-2022 |
| Report Scope & Coverage | Market Size, Segments Analysis, Competitive Landscape, Regional Analysis, DROC & SWOT Analysis, Forecast Outlook |
| Key Segments | • By Frequency Band (L Band, C/S/X Band, E/F Band, and Others) • By Range (Short Range (up to 75 Km), Medium Range (75-150 Km, Long Range (more than 150 Km)) • By Platform (Airborne, Ground, and Naval) |
| Regional Analysis/Coverage | North America (USA, Canada, Mexico), Europe (Germany, UK, France, Italy, Spain, Netherlands, Rest of Europe), Asia-Pacific (Japan, South Korea, China, India, Australia, Rest of Asia-Pacific), The Middle East & Africa (Israel, UAE, South Africa, Rest of Middle East & Africa), Latin America (Brazil, Argentina, Rest of Latin America) |
| Company Profiles | BAE Systems, Raytheon Technologies Corporation, L3Harris Technologies Inc., Rheinmetall AG, Honeywell International Inc, Airbus S.A.S., Northrop Grumman Corporation, Thales Group, Saab AB, Leonardo S.p.A., and other players. |
| DRIVERS | • Increased Application of Modern Warfare Techniques • Instability in Asia Pacific and the Middle East geopolitics |
| RESTRAINTS | • Rising Cost of 3D Radar |
Frequently Asked Questions
Increased Application of Modern Warfare Techniques and Instability in Asia Pacific and the Middle East geopolitics
The North American region is expected to lead the 3D radar market. The rising demand for radar systems in surveillance activities might be linked to the rise of the North American 3D radar market.
Due to the nature of COVID-19, research and development in 3D radar companies Globally has been disrupted due to announced closures and government restrictions on public gatherings.
Air and missile defence systems are increasingly being deployed and 3D Radar Miniaturization for UAVs and Unmanned Combat Vehicles
Yes, this report cover top down , bottom up Quantitative Research. Qualitative Research, Fundamental Research, data triangulation, ID’s & FGD’s Analytical research, And other as per report requirement.
Get in Touch
