Smart Personal Safety and Security Device Market Report Scope & Overview:
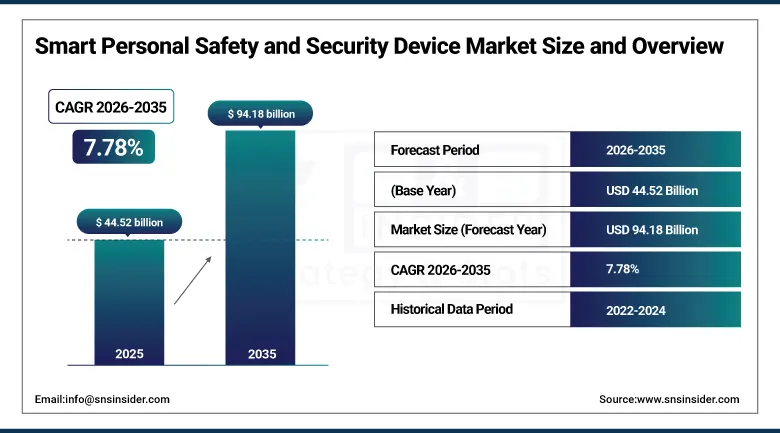
The Smart Personal Safety and Security Device Market was valued at USD 44.52 billion in 2025 and is expected to reach USD 94.18 billion by 2035, growing at a CAGR of 7.78% from 2026–2035.
The global Smart Personal Safety and Security Device Market is experiencing robust and consistent growth as a result of escalating personal safety concerns, growing crime rates, increasing awareness of vulnerable demographic groups and the proliferation of smartphone and wearable technology, all of which are generating a growing commercial opportunity for connected safety devices that provide real-time monitoring, emergency alerts, GPS tracking and health surveillance capabilities. Smart personal safety devices come in many different forms, including GPS-enabled personal alarms, smart jewellery with discreet SOS capabilities, intelligent clothing with embedded sensors, emergency panic buttons, fall detection wearables for elderly users, lone worker safety devices and smartphone-integrated safety applications, all of which enable individuals to call for help, share location and monitor wellbeing in the face of threatening or medically vulnerable situations. The demographic and sociological trends are coming together to power the market Urbanisation is increasing the population in cities where the risk of crime is higher, single-person households are growing and need solutions for individual safety, ageing populations need fall detection and emergency response remotely and there is an increasing societal awareness of personal safety, especially for women, children and the elderly.
The Smart Personal Safety and Security Device Market's 7.78% CAGR from 2026 to 2035 reflects the structural convergence of three irreversible societal trends: the growing global awareness that personal safety is an active individual responsibility requiring technology enablement rather than passive reliance on emergency services; the exponential improvement in miniaturised sensor, GPS, and cellular technology that makes comprehensive safety monitoring practical in everyday wearable form factors; and the expansion of 5G connectivity that enables the always-on, low-latency communication that real-time personal safety monitoring systems require to function reliably in emergency scenarios where seconds can determine outcomes.
Market Size and Forecast
-
Market Size in 2025: USD 44.52 Billion
-
Market Size by 2035: USD 94.18 Billion
-
CAGR: 7.78% from 2026 to 2035
-
Base Year: 2025
-
Forecast Period: 2026–2035
-
Historical Data: 2022–2024
To Get more information on Smart Personal Safety and Security Device Market - Request Free Sample Report
Smart Personal Safety and Security Device Market Trends
-
Integration of AI-powered fall detection and anomaly recognition into consumer wearable safety platforms, with Apple Watch's satellite Emergency SOS function enabling rescuers to locate injured backcountry skiers near Steven's Pass, WA in 2025 demonstrating the life-saving commercial value of AI-enhanced safety features in mainstream smartwatches.
-
Growing adoption of satellite-based emergency communication in personal safety devices, extending SOS capability beyond cellular network coverage to wilderness, maritime, and remote environments where traditional cellular connectivity is unavailable through products including Garmin inReach and Apple Emergency SOS via satellite.
-
Rising enterprise deployment of lone worker safety devices for employees working in isolated, hazardous, or remote conditions across oil and gas, construction, mining, utilities, and healthcare sectors where workplace safety regulations require continuous worker location monitoring and emergency response capability.
-
Expanding smart jewellery market segment targeting women's personal safety with devices including smart rings, bracelets, and pendants that conceal emergency alert, GPS tracking, and discreet SOS capabilities within fashionable aesthetic designs that users will consistently wear rather than leave at home.
-
Growing adoption of multi-network personal safety devices combining Bluetooth for short-range smartphone connectivity, cellular for wide-area communication, and Wi-Fi for indoor location accuracy within a single platform, providing seamless connectivity transition that ensures safety coverage across all environments.
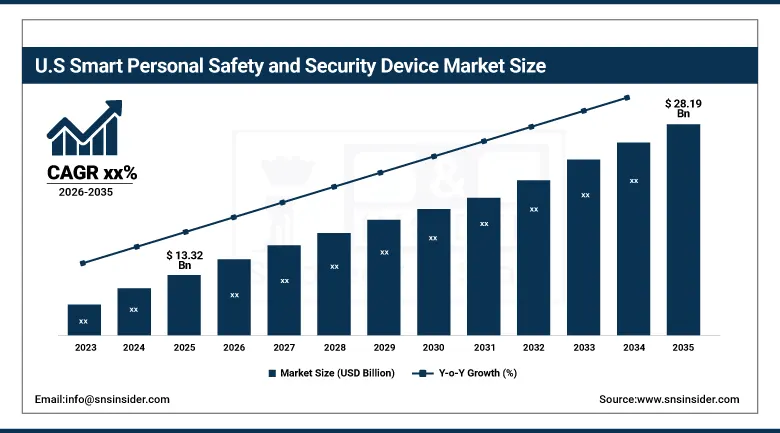
U.S. Smart Personal Safety and Security Device Market was valued at approximately USD 13.32 billion in 2025 and is expected to reach approximately USD 28.19 billion by 2035, driven by high wearable adoption, advanced infrastructure, and growing personal safety awareness across all demographic groups.
The United States is the biggest market for smart personal safety and security devices globally, with the North American market expected to have a 36.5% global share in 2025, driven by the highest penetration of wearable devices worldwide, high consumer awareness of connected personal safety solutions, a strong emergency response infrastructure that supports device-assisted activation of emergency services, and the commercial headquarters of the world’s leading personal safety technology companies, such as Apple, Google, Garmin, and ADT. Market Dynamics Several strong demand drivers drive U.S. market dynamics: The Solo Lifestyle Trend ~28% of U.S. households are single persons seeking personal safety devices that serve as a safety net when not in close proximity to others.
Samsung asked Galaxy users in India and the UK to turn on the new One UI 7 theft protection suite including Identity Check, Security Delay, Offline Device Lock and Remote Lock in 2025, while Apple’s Watch SOS alert enabled rescuers to locate injured backcountry skiers near Steven’s Pass, WA. These product innovations indicate that mainstream consumer electronics platforms are emerging as the primary personal safety device for hundreds of millions of users worldwide, creating a commercial dynamic where the most commercially significant personal safety hardware is built into devices consumers already carry every day, rather than requiring the adoption of dedicated safety devices.
Smart Personal Safety and Security Device Market Segment Insights
-
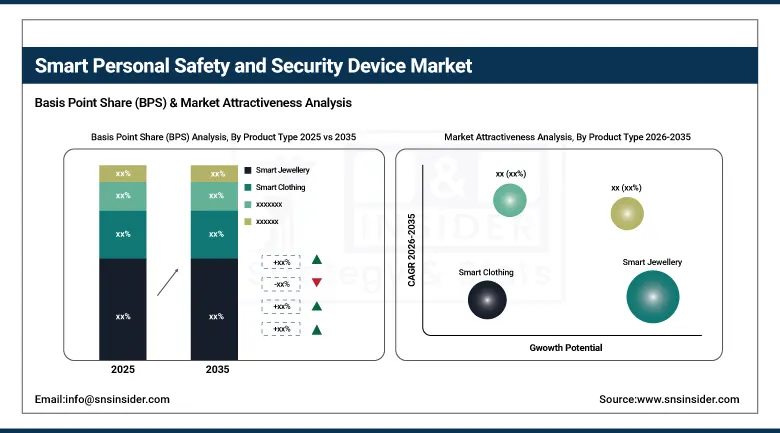
According to Product Type, Smart Jewellery dominated with approximately 28.4% market share in 2025 due to its fashionable, discreet design integrating SOS alerts, GPS tracking, and Bluetooth connectivity that appeals to urban women; Smart Clothing is expected to achieve the highest CAGR during 2026 to 2035 driven by rising adoption of multifunctional wearables in elderly care, health monitoring, and emergency alert applications.
-
By Connectivity Technology, Bluetooth dominated with approximately 39.3% volume share in 2025 due to universal compatibility with mobile phones, low-power consumption, and suitability for compact wearable devices; Cellular Network is expected to register the highest CAGR during 2026 to 2035 fueled by 4G/5G expansion enabling long-range communication for elderly care, lone worker safety, and emergency response.
-
By End-User, Consumer Electronics led with approximately 35.7% market share in 2025 and is also projected to grow at the fastest CAGR driven by mainstream wearable integration of safety features; Healthcare is growing rapidly as elderly monitoring and remote patient safety devices expand.
-
By Distribution Channel, Online Retail accounted for approximately 39.8% of revenues in 2025 and is expected to witness the fastest CAGR driven by expanding e-commerce platforms, wide product access, user reviews, price comparisons, and growing smartphone use in developing economies.
Smart Personal Safety and Security Device Market Segment Analysis
By Product Type: Smart Jewellery dominates, Smart Clothing grows fastest
Smart Jewellery retained the dominant product type position in the Smart Personal Safety and Security Device Market in 2025 with approximately 28.4% of revenues, driven by its unique combination of protective functionality and aesthetic desirability that makes it the only personal safety form factor that users will consistently wear in all social contexts without the device attracting unwanted attention or social stigma. Smart jewellery products including safety rings, bracelets, pendants, and earrings embed GPS location tracking, Bluetooth SOS alert triggering, and emergency contact notification within designs that are indistinguishable from conventional fashion accessories, enabling users to maintain personal safety protection without signalling vulnerability or abandoning their personal style.
Smart Clothing is projected to achieve the highest product type CAGR during the 2026 to 2035 forecast period, driven by the convergence of miniaturised sensor technology, advanced textile manufacturing, and growing consumer demand for safety and health monitoring capabilities integrated invisibly into everyday garments. Smart clothing applications in personal safety include garments with embedded fall sensors that automatically alert emergency contacts or medical services when the wearer falls, temperature and vital sign monitoring fabrics for elderly care that detect medical emergencies without wrist-worn devices that users may remove, and protective work clothing for industrial and construction workers incorporating impact sensors, gas detection, and lone worker tracking capabilities that provide occupational safety monitoring without requiring separate device management.
By Connectivity Technology: Bluetooth dominates, Cellular Network grows fastest
Bluetooth retained the dominant connectivity technology position with approximately 39.3% of the Smart Personal Safety and Security Device Market in 2025, reflecting its established role as the primary short-range communication standard for personal wearable devices that pair with smartphones to enable SOS alert transmission, GPS location sharing through the connected phone, and real-time health data synchronisation. Bluetooth's dominance is sustained by its near-universal presence in smartphones providing the communication relay infrastructure for Bluetooth safety devices, its negligible power consumption impact on small wearable battery life, and the established Bluetooth device ecosystem that enables compatibility with both iOS and Android mobile platforms without carrier subscription requirements.
Cellular Network connectivity is projected to register the highest CAGR during the forecast period, driven by the deployment of 4G LTE and 5G networks that dramatically expand cellular coverage into rural, suburban, and previously under-served areas where personal safety need is often greatest. Cellular-connected safety devices operate independently of smartphone proximity, enabling direct emergency communication, GPS location reporting, and two-way voice contact with monitoring centers and emergency services without reliance on a paired phone that the user may have lost, had stolen, or left at home. This independence from smartphone proximity is particularly critical for elderly users in fall detection applications, lone workers in remote locations, and children's safety tracking where continuous cellular connectivity provides the always-on protection that Bluetooth-dependent devices cannot deliver beyond Bluetooth range.
By End-User: Consumer Electronics dominates and grows fastest; Healthcare expands rapidly
Consumer Electronics retained the dominant end-user position in the Smart Personal Safety and Security Device Market in 2025 with approximately 35.7% of revenues, and is simultaneously projected to grow at the fastest CAGR through 2035, reflecting the extraordinary commercial scale advantage of personal safety feature integration into mainstream consumer wearables including smartwatches, fitness trackers, and smartphones that are purchased by hundreds of millions of consumers annually for primary functions beyond safety. Apple Watch's Emergency SOS via satellite, Samsung Galaxy's One UI 7 theft protection suite, and Google Pixel's crash detection and emergency sharing capabilities are embedding personal safety functionality as standard features of mass-market consumer electronics at price points and distribution scale that dedicated safety device manufacturers cannot match, making consumer electronics the primary safety device platform for the majority of the world's urban population.
Healthcare represents a major and rapidly growing end-user segment, driven by the ageing global population creating escalating demand for remote patient monitoring and fall detection safety devices that enable elderly individuals to maintain independent living without round-the-clock caregiver presence. Medical alert systems that automatically detect falls, irregular heart rhythms, sudden movement cessation, or abnormal vital signs and trigger emergency response without the elderly user having to actively press an alert button represent the highest-value personal safety devices in the healthcare segment, commanding premium pricing relative to consumer safety wearables because the stakes of device reliability failure are life-threatening.
Market Regional Analysis
|
Region |
Major Country |
Share within Region (%) |
|---|---|---|
|
North America |
United States |
~82% |
|
Europe |
United Kingdom |
~30% |
|
Asia Pacific |
China |
~44% |
|
Middle East & Africa |
UAE |
~28% |
|
Latin America |
Brazil |
~43% |
North America Smart Personal Safety and Security Device Market Insights
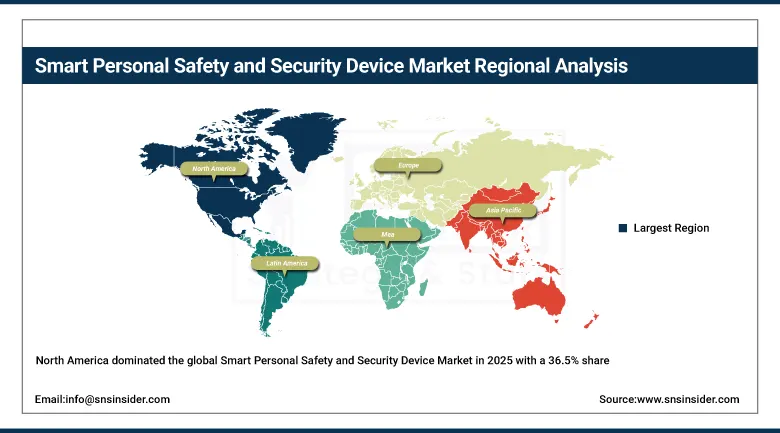
North America dominated the global Smart Personal Safety and Security Device Market in 2025 with a 36.5% share, anchored by the United States which accounted for approximately 82% of North American revenues. U.S. market leadership is driven by the highest wearable device penetration globally, advanced technological infrastructure supporting connected safety systems, strong consumer awareness of personal safety solutions, and the commercial headquarters of Apple, Google, Garmin, and ADT whose platform integration of personal safety features defines global product standards. Solo lifestyle trends, heightened women's safety awareness, and the world's largest elderly population requiring fall detection and medical alert systems collectively sustain exceptional U.S. market growth.
Get Customized Report as per Your Business Requirement - Enquiry Now
Europe Smart Personal Safety and Security Device Market Insights
Europe represents a sophisticated smart personal safety device market, shaped by high consumer technology adoption, GDPR-compliant data privacy requirements that influence device data architecture, and strong occupational safety regulations driving enterprise lone worker device investment. The UK leads European market revenues through its advanced wearable consumer market, while Germany's industrial sector drives significant enterprise safety wearable adoption. Nordic countries' advanced social welfare systems create institutional demand for elderly fall detection and monitoring devices integrated with national healthcare infrastructure.
Asia Pacific Smart Personal Safety and Security Device Market Insights
Asia Pacific is projected to register the highest CAGR of approximately 8.54% through 2035, driven by rapid urbanisation creating new personal safety demand as populations shift from close-knit rural communities to anonymous urban environments, growing smartphone and wearable penetration enabling connected safety device adoption across mass-market price points, and government initiatives promoting women's safety through wearable technology programmes across India, China, and Southeast Asia. India's government-supported women's safety wearable programmes and China's large domestic wearables manufacturing ecosystem create a dual production and consumption environment that sustains particularly strong Asia Pacific market growth through the forecast period.
Latin America and MEA Smart Personal Safety and Security Device Market Insights
Latin America and MEA are growing smart personal safety device markets, driven by rising urbanisation, increasing personal safety awareness, and growing smartphone and wearable adoption among middle-class consumers. Brazil leads Latin American revenues at approximately 43% through its large urban population and growing consumer electronics market. The UAE leads MEA adoption through its tech-savvy affluent population and strong government investment in smart city safety infrastructure, while South Africa's acute personal safety challenges create compelling demand for GPS personal alarm and safety tracker adoption.
Smart Personal Safety and Security Device Market Growth Drivers:
Rising personal safety concerns, increasing crime awareness, and mainstream consumer electronics platform integration of safety features driving broad market adoption: The key structural growth drivers for Smart Personal Safety and Security Device Market are the continuing societal trend toward increased personal safety awareness that is driving people of all demographic groups to invest in technologies that provide protection, emergency communication and location sharing capability, coupled with the unprecedented commercial leverage of personal safety feature integration into mainstream consumer electronics. Apple Watch’s Emergency SOS via satellite reaching hundreds of millions of Apple Watch users globally, and Samsung’s One UI 7 theft protection suite deployed across hundreds of millions of Galaxy devices, represent safety capability distribution at scales that dedicated safety device manufacturers could never achieve, creating the world’s largest personal safety device installed base through existing consumer electronics platforms.
Smart Personal Safety and Security Device Market Restraints
Battery life limitations, privacy concerns over continuous location tracking, and device reliability anxiety limiting adoption among safety-critical user groups: A significant restraint on the Smart Personal Safety and Security Device Market is the battery life limitation of continuous GPS, cellular, and Bluetooth monitoring that reduces daily device runtime to levels that may not cover full waking hours in compact form factors, creating charging habit dependencies that can leave users unprotected during charging periods. Consumer privacy concerns regarding continuous GPS location tracking and biometric data transmission to cloud platforms represent a significant adoption barrier, particularly among consumers who are aware of data security risks and reluctant to share continuous location data with commercial entities whose data protection commitments are not fully understood.
Smart Personal Safety and Security Device Market Opportunities
Elderly care remote monitoring expansion, enterprise lone worker safety programme growth, and satellite connectivity extending safety device coverage to remote environments: The global ageing population trend, with WHO projecting 2.1 billion people aged 60 or older by 2050, creates an expanding elderly care personal safety device market where fall detection, vital sign monitoring, and emergency response wearables enable independent living while providing families and healthcare providers with continuous safety assurance. Enterprise lone worker safety programmes, driven by workplace safety regulations in oil and gas, construction, utilities, and healthcare requiring employer demonstration of continuous worker location monitoring and emergency response capability, represent a high-value B2B market growing alongside the consumer segment.
Recent Developments:
-
2026: Life360 completed its USD 120 million acquisition of Nativo, surpassing 50 million monthly active users in the United States and validating the family safety tracking segment as a scalable advertising-supported business model.
-
2025: Samsung urged Galaxy users in India and the UK to activate its new One UI 7 theft protection suite, which includes Identity Check, Security Delay, Offline Device Lock, and Remote Lock, expanding its consumer safety feature set across its installed base.
Smart Personal Safety and Security Device Market Key Players
-
Apple Inc.
-
Samsung Electronics Co. Ltd.
-
Garmin Ltd.
-
Honeywell International Inc.
-
ADT Inc.
-
ASSA ABLOY AB
-
Fitbit (Google LLC)
-
Arlo Technologies Inc.
-
Buddi Ltd.
-
Revolar Technology Inc.
-
UnaliWear Inc.
-
Safelet B.V.
-
Force Impact Technologies LLC
-
KORE Wireless Group Inc.
-
Amber Alert GPS
-
Rescue1 LLC
-
SafeUApp
-
Wearsafe Labs Inc.
-
Noonlight Inc.
-
Quovio Inc.
| Report Attributes | Details |
|---|---|
| Market Size in 2025 | USD 44.52 Billion |
| Market Size by 2035 | USD 94.18 Billion |
| CAGR | CAGR of 7.78% From 2026 to 2035 |
| Base Year | 2025 |
| Forecast Period | 2026-2035 |
| Historical Data | 2022-2024 |
| Report Scope & Coverage | Market Size, Segments Analysis, Competitive Landscape, Regional Analysis, DROC & SWOT Analysis, Forecast Outlook |
| Key Segments | •By Product Type (Smart Jewellery, Smart Clothing, Smart Watches, Panic Buttons, GPS Trackers, Safety Cameras, Others) •By Connectivity Technology (Bluetooth, Cellular Network, Wi-Fi, Satellite, Others) •By End-User (Consumer Electronics, Healthcare, Industrial and Commercial, Defense, Others) •By Distribution Channel (Online Retail, Offline Retail) |
| Regional Analysis/Coverage | North America (US, Canada), Europe (Germany, UK, France, Italy, Spain, Russia, Poland, Rest of Europe), Asia Pacific (China, India, Japan, South Korea, Australia, ASEAN Countries, Rest of Asia Pacific), Middle East & Africa (UAE, Saudi Arabia, Qatar, South Africa, Rest of Middle East & Africa), Latin America (Brazil, Argentina, Mexico, Colombia, Rest of Latin America). |
| Company Profiles | Apple Inc., Samsung Electronics Co. Ltd., Garmin Ltd., Honeywell International Inc., ADT Inc., ASSA ABLOY AB, Fitbit (Google LLC), Arlo Technologies Inc., Buddi Ltd., Revolar Technology Inc., UnaliWear Inc., Safelet B.V., Force Impact Technologies LLC, KORE Wireless Group Inc., Amber Alert GPS, Rescue1 LLC, SafeUApp, Wearsafe Labs Inc., Noonlight Inc., Quovio Inc. |
Get in Touch
