Accounts Receivable Automation Market Report Scope & Overview:
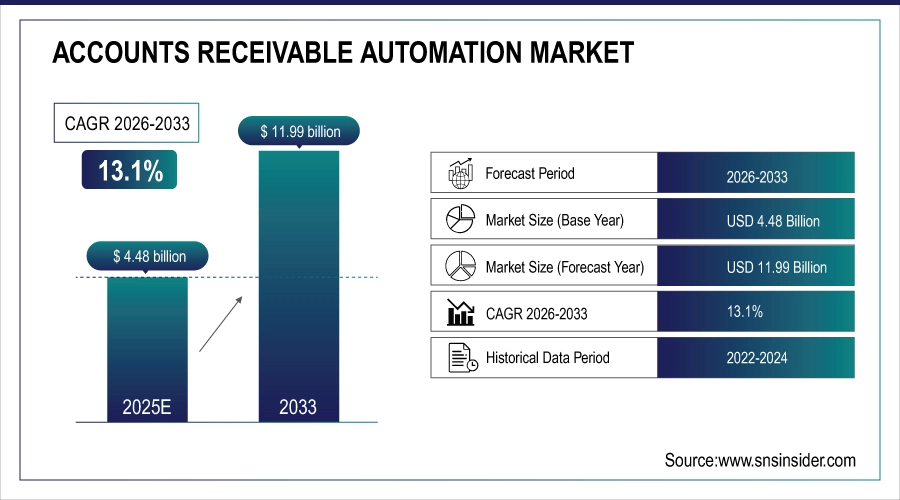
The Accounts Receivable Automation Market is valued at USD 4.48 Billion in 2025E and is expected to reach USD 11.99 Billion by 2033, growing at a CAGR of 13.1% during the forecast period (2026-2033).
The Accounts Receivable Automation Market size is expected to grow owing to the surging need for enhanced cash flow visibility, reduced Days Sales Outstanding (DSO), and improved operational efficiency across industries. Organizations are adopting AI-powered automation to streamline invoice processing, payment reconciliation, and collections management. The shift toward digital B2B payments, integration with ERP and accounting systems, and the demand for real-time financial insights further accelerate global adoption, particularly among SMEs seeking scalable, error-free receivables management.
76% of businesses implementing AR automation reduced invoice processing costs by 35% and improved collection efficiency by 45%, leveraging AI for predictive cash flow analytics and automated payment reminders.
Accounts Receivable Automation Market Size and Forecast
-
Market Size in 2025E: USD 4.48 Billion
-
Market Size by 2033: USD 11.99 Billion
-
CAGR: 13.1% from 2026 to 2033
-
Base Year: 2025E
-
Forecast Period: 2026–2033
-
Historical Data: 2022–2024
To Get more information on Accounts Receivable Automation Market - Request Free Sample Report
Accounts Receivable Automation Market Trends:
-
Accelerated adoption of AI and machine learning for predictive collections, invoice data capture, and payment anomaly detection.
-
Growing preference for cloud-native AR platforms enabling remote access, real-time reporting, and seamless ERP integration.
-
Rise of touchless invoice processing and automated payment reconciliation to reduce manual errors and processing time.
-
Increasing integration of AR automation with e-invoicing networks, digital payment gateways, and blockchain for secure transactions.
-
Expansion of mobile-enabled AR solutions allowing approvals, queries, and cash application on-the-go.
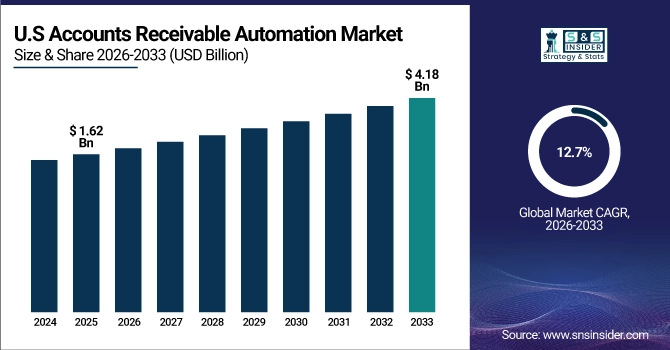
U.S. Accounts Receivable Automation Market is valued at USD 1.62 billion in 2025E and is expected to reach USD 4.18 billion by 2033, growing at a CAGR of 12.7% from 2026-2033.
The U.S. market is the biggest since it was one of the first to use fintech solutions, has a lot of digital payments, and has a lot of small and large businesses that want to automate their receivables management to save money on working capital and administrative costs.
Accounts Receivable Automation Market Growth Drivers:
-
Increasing Need to Improve Cash Flow Predictability and Reduce Days Sales Outstanding (DSO) Drives Market Expansion Globally
Manual accounts receivable processes are prone to delays, errors, and inefficiencies, directly impacting cash flow and working capital. AR automation software accelerates invoice delivery, automates payment reminders, and applies cash electronically, significantly reducing DSO. AI algorithms prioritize collections activities based on customer payment behavior, improving recovery rates. With businesses focusing on liquidity optimization post-pandemic, automated AR solutions have become essential for maintaining financial health and operational resilience.
74% of companies using AR automation reduced DSO by an average of 15 days and improved cash flow forecasting accuracy by 50% through real-time dashboards and predictive analytics.
Accounts Receivable Automation Market Restraints:
-
High Implementation Costs, Complexity of Migrating from Legacy Systems, and Resistance to Process Change Hinder Adoption Globally
Transitioning from manual or semi-automated AR processes to fully automated platforms require significant upfront investment in software, training, and change management. Many SMEs lack the capital and technical expertise to execute such transitions smoothly. Additionally, reluctance from accounting staff to adopt new technologies and fear of workflow disruption create internal resistance. Without clear demonstration of quick ROI, decision-makers often delay or scale back automation initiatives.
Approximately 55% of small businesses cited upfront costs and staff retraining as major barriers, with 40% postponing automation projects despite recognizing long-term efficiency gains.
Accounts Receivable Automation Market Opportunities:
-
Emerging AI Capabilities in Predictive Cash Application, Intelligent Dispute Resolution, and Conversational AI for Customer Interactions Present New Avenues for Advanced AR Automation Solutions
Next-generation AR features, such as automated cash matching with machine learning, AI-driven deduction management, and chatbots for billing questions are now possible thanks to improvements in AI and natural language processing. Predictive analytics can accurately predict when payments will be due and how likely it is that a customer would default on their credit. These new tools let finance teams move from doing transactional work to doing strategic work, which helps them make better financial decisions and build better relationships with customers. Vendors that put money on AI-enhanced modules are likely to get a bigger share of the market.
In 2025, AI-powered cash application tools achieved 90% straight-through processing rates, reducing manual intervention by 75% and accelerating dispute resolution by 65% through automated workflows.
Accounts Receivable Automation Market Segment Highlights
-
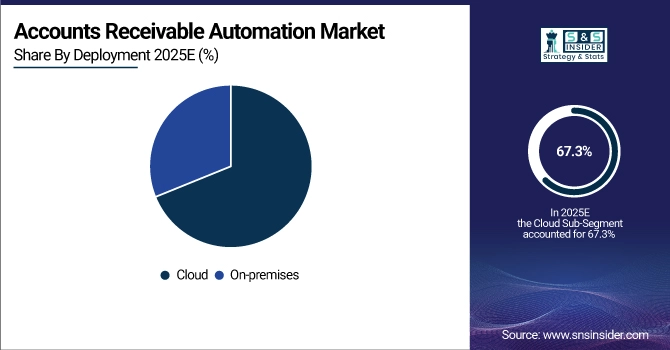
By Deployment: Cloud led with 67.3% share, while On-premises is expected to grow at a moderate CAGR of 8.2%.
-
By Vertical: BFSI led with 24.8% share, while Healthcare is the fastest-growing segment with a CAGR of 16.5%.
-
By Component: Solution led with 61.5% share, while Services is the fastest-growing segment with a CAGR of 15.8%.
-
By Organization Size: Large Enterprises led with 58.7% share, while Small & Medium Sized Enterprises is the fastest-growing segment with a CAGR of 17.2%.
Accounts Receivable Automation Market Segment Analysis
By Deployment: Cloud Dominated the Market, while On-premises Shows Niche Demand in the Market
Cloud deployment dominates the AR automation market, driven by advantages such as lower upfront costs, automatic updates, remote accessibility, and easier scalability. Cloud solutions enable real-time collaboration between finance teams, sales, and customers, supporting hybrid work environments. Integration with other cloud-based financial systems and open APIs further accelerates adoption, especially among SMEs and geographically dispersed enterprises seeking agile, subscription-based models.
On-premises deployment maintains a presence primarily in highly regulated industries like banking and government, where data sovereignty and security policies mandate local infrastructure. While growth is slower, some large organizations with legacy IT investments and customized workflows continue to prefer on-premises solutions for full control over data and system performance, despite higher maintenance costs and longer upgrade cycles.
By Vertical: BFSI Segment Led the Market, while Healthcare Segment is Expected to Witness Fastest Growth Globally
BFSI leads in AR automation adoption due to high transaction volumes, complex billing structures, and stringent compliance requirements. Banks, insurance firms, and financial services providers use automation to manage premium collections, loan repayments, and fee-based invoicing with accuracy and audit trails. Integration with core banking systems and fraud detection tools further reinforces demand in this vertical.
Healthcare is the fastest-growing vertical, fueled by the need to streamline patient billing, manage insurance claims, and reduce administrative costs. AR automation helps healthcare providers accelerate reimbursements, handle denials proactively, and improve patient payment experiences through digital statements and flexible payment plans—critical amid rising operational pressures and regulatory changes.
By Component: Solution Segment Led the Market, while Services Segment to Grow Steadily in the Market
Solution segment holds the largest share, as core software platforms for invoice automation, payment processing, collections, and reporting form the foundation of AR automation. Vendors continuously enhance solutions with AI, analytics, and mobile capabilities to meet evolving customer expectations for speed, self-service, and integration.
Services segment is growing rapidly, driven by demand for implementation, integration, training, and managed services. As solutions become more advanced, organizations seek expert assistance for deployment, customization, and ongoing support, especially to ensure smooth ERP integration and user adoption across departments.
By Organization Size: Large Enterprises Dominated the Market, while SMEs Show Highest Growth in the Market
Large Enterprises were early adopters, leveraging AR automation to manage complex, high-volume global receivables, improve process standardization, and gain enterprise-wide cash flow visibility. Scalable platforms help them consolidate AR operations across subsidiaries and automate intercompany reconciliations.
Small & Medium Sized Enterprises (SMEs) represent the fastest-growing segment, as affordable cloud-based solutions become accessible. SMEs use automation to reduce manual efforts, accelerate collections, and improve professionalism in billing, key to sustaining cash flow and supporting growth without expanding back-office staff.
Accounts Receivable Automation Market Regional Analysis:
North America Accounts Receivable Automation Market Insights:
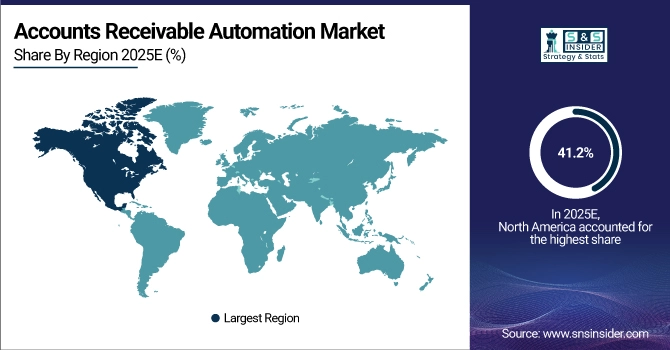
North America held a dominant share of 41.2% in 2025, driven by high technology adoption, presence of leading vendors, early shift to electronic invoicing and payments, and strong demand from sectors like technology, healthcare, and professional services optimizing financial operations.
Get Customized Report as per Your Business Requirement - Enquiry Now
Asia Pacific Accounts Receivable Automation Market Insights:
Asia Pacific is projected to grow at the highest CAGR of 16.8% from 2026–2033, fueled by rapid digitalization of SMEs, increasing adoption of cloud accounting, government promotion of e-invoicing, and expansion of cross-border trade requiring efficient receivables management across supply chains.
Europe Accounts Receivable Automation Market Insights:
Europe accounted for a significant share in 2025, supported by regulatory mandates for e-invoicing in public procurement, strong emphasis on VAT compliance, and widespread ERP usage across manufacturing and logistics sectors seeking automated order-to-cash cycles.
Middle East & Africa and Latin America Accounts Receivable Automation Market Insights:
These regions collectively showed steady growth, encouraged by economic diversification, digital transformation in banking and retail, and increasing awareness of working capital optimization tools among growing enterprises and multinational subsidiaries.
Accounts Receivable Automation Market Competitive Landscape:
HighRadius Corporation
Founded in 2006, HighRadius Corporation is a U.S.-based fintech enterprise specializing in AI-powered autonomous software for order-to-cash, treasury, and record-to-report processes. Its Integrated Receivables platform leverages AI and machine learning to automate credit, collections, cash application, and e-invoicing, serving large global enterprises across multiple industries.
-
January 2025, HighRadius launched its AI Cash Application Cloud, achieving 95% straight-through processing rates using deep learning models for complex payment remittance matching.
Sage Group plc
Established in 1981 in the U.K., Sage Group plc is a leading provider of cloud business management solutions. Its Sage Intacct and Sage Cloud AR offerings deliver automated invoicing, payment processing, and collections tools tailored for SMEs and mid-market businesses, with deep integration into broader accounting and ERP ecosystems.
-
March 2025, Sage enhanced its AR automation with predictive analytics and payment plan automation, specifically targeting subscription-based and project-centric business models.
BlackLine, Inc.
Founded in 2001, BlackLine, Inc. is a U.S. company providing cloud-based solutions for financial close and accounting automation. Its AR automation capabilities focus on reconciliation, dispute management, and cash application, integrating seamlessly with major ERPs to streamline the entire accounts receivable lifecycle for large organizations.
-
November 2024, BlackLine introduced its Cash Application Automation module using AI to match open invoices with bank transactions, significantly reducing manual effort in high-volume environments.
Accounts Receivable Automation Market Key Players:
-
Sage Group plc
-
BlackLine, Inc.
-
Oracle Corporation
-
SAP SE
-
Quadient (formerly Neopost)
-
Kofax Inc. (a Tungsten Automation company)
-
Billtrust (an EQT portfolio company)
-
Versapay (a Corpay company)
-
Chrome River Technologies (an Emburse company)
-
Paigo GmbH
-
Cedar Bay
-
YayPay (a Quadient company)
-
Funding Gates
| Report Attributes | Details |
| Market Size in 2025E | USD 4.48 Billion |
| Market Size by 2033 | USD 11.99 Billion |
| CAGR | CAGR of 13.1% From 2026 to 2033 |
| Base Year | 2025 |
| Forecast Period | 2026-2033 |
| Historical Data | 2022-2024 |
| Report Scope & Coverage | Market Size, Segments Analysis, Competitive Landscape, Regional Analysis, DROC & SWOT Analysis, Forecast Outlook |
| Key Segments | • By Deployment (Cloud and On-premises) • By Vertical (Consumer Goods and Retail,BFSI,Manufacturing,Healthcare,IT and Telecom and Others) • By Component (Services and Solution) • By Organization Size (Large Enterprises,Small & Medium Sized Enterprises) |
| Regional Analysis/Coverage | North America (US, Canada, Mexico), Europe (Eastern Europe [Poland, Romania, Hungary, Turkey, Rest of Eastern Europe] Western Europe] Germany, France, UK, Italy, Spain, Netherlands, Switzerland, Austria, Rest of Western Europe]), Asia Pacific (China, India, Japan, South Korea, Vietnam, Singapore, Australia, Rest of Asia Pacific), Middle East & Africa (Middle East [UAE, Egypt, Saudi Arabia, Qatar, Rest of Middle East], Africa [Nigeria, South Africa, Rest of Africa], Latin America (Brazil, Argentina, Colombia Rest of Latin America) |
| Company Profiles | HighRadius Corporation, Sage Group plc, BlackLine, Inc., Oracle Corporation, SAP SE, Quadient (formerly Neopost), Kofax Inc. (a Tungsten Automation company), Billtrust (an EQT portfolio company), Versapay (a Corpay company), Chrome River Technologies (an Emburse company), Paigo GmbH, Analytix Solutions, Cedar Bay, YayPay (a Quadient company), Funding Gates |
Get in Touch
