Specialty Fertilizers Market Report Scope & Overview:
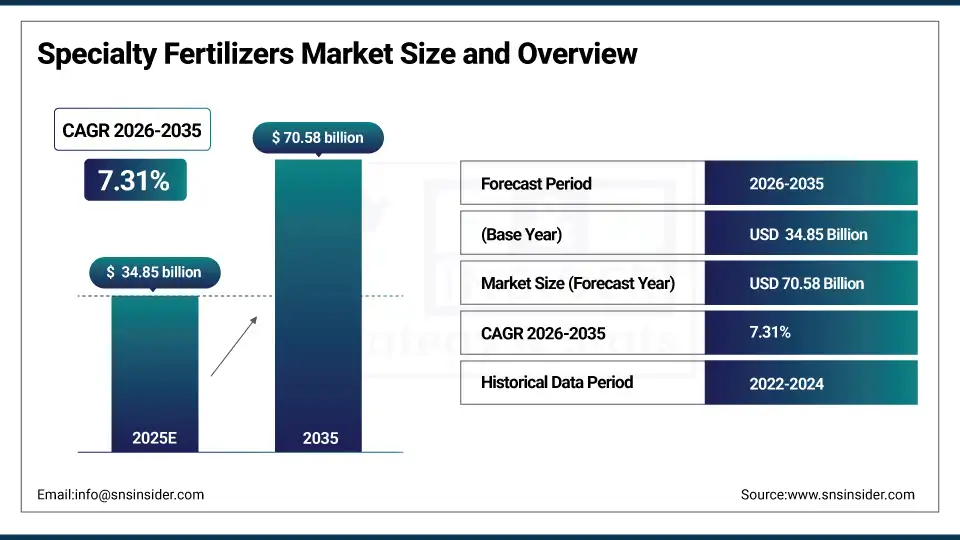
The Specialty Fertilizers Market size was valued at USD 34.85 billion in 2025 and is expected to reach USD 70.58 billion by 2035, growing at a CAGR of 7.31% over the forecast period of 2026-2035.
The global specialty fertilizers market trend is a rising shift towards precision agriculture and high-efficiency crop nutrition solutions as the growth of the market is driven by increasing global food demand, shrinking arable land, and stringent environmental regulations regarding nutrient runoff. This trend is also driven by a growing adoption of protected cultivation and hydroponic farming systems as growers become more focused on maximizing crop yield and quality, they are increasingly investing in controlled-release fertilizers and water-soluble formulations, resulting in growth in the domestic and international market for advanced fertilizer technologies.
For instance, in March 2024, growing awareness and adoption of protected cultivation drove a 15% increase in water-soluble fertilizer consumption across greenhouse vegetable production in Europe, boosting yields and resource efficiency.
Specialty Fertilizers Market Size and Forecast:
-
Market Size in 2025E: USD 34.85 billion
-
Market Size by 2035: USD 70.58 billion
-
CAGR: 7.31% from 2026 to 2035
-
Base Year: 2025
-
Forecast Period: 2026–2035
-
Historical Data: 2022–2024
To Get more information On Specialty Fertilizers Market - Request Free Sample Report
Specialty Fertilizers Market Trends
-
Controlled-release and stabilized fertilizer technologies are being adopted because farmers demand extended nutrient availability and reduced application frequency.
-
Customized specialty fertilizer blends based on soil health analysis, specific crop requirements, and regional climate conditions to optimize nutrient use efficiency.
-
The development of nano-fertilizers, bio-based coating technologies, and smart release mechanisms to improve nutrient uptake and minimize environmental impact.
-
Enhanced efficiency fertilizers with nitrification inhibitors and urease inhibitors are all available to ensure nitrogen retention and reduced greenhouse gas emissions.
-
Increased demand for liquid fertilizers and fertigation-compatible formulations to enable precision application and uniform nutrient distribution.
-
Collaboration between fertilizer manufacturers, agricultural research institutions, and precision farming technology providers to develop integrated crop nutrition systems.
-
EPA, European Fertilizer Regulation, and FAI promoting standards for product safety, environmental sustainability, and quality certification.
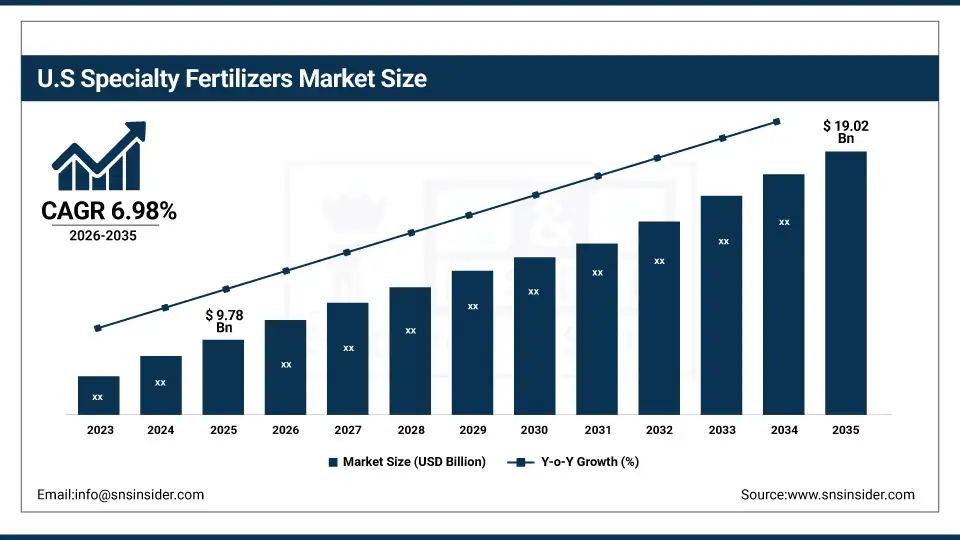
The U.S. Specialty Fertilizers Market is estimated at USD 9.78 billion in 2025 and is expected to reach USD 19.02 billion by 2035, growing at a CAGR of 6.98% from 2026-2035.
The United States represents the largest market for specialty fertilizers in North America, primarily driven by the adoption of precision agriculture technologies, large-scale commercial farming operations, and well-established distribution networks. Government incentives for sustainable farming practices, moderately high levels of row crop production and increased grower spending on high-efficiency inputs help to drive growth in the market. Also, the U.S. is the largest regional market in the world for controlled-release fertilizers, due to the regulatory support and swift adoption of fertigation and soil-specific nutrient management solutions.
Specialty Fertilizers Market Growth Drivers:
-
Global Food Security and Population Growth is Driving the Specialty Fertilizers Market Growth
Global food security and population growth take the center stage as growth drivers for the specialty fertilizers market share, driven by the need to increase agricultural productivity on existing farmland to feed a projected 9.7 billion people by 2050. These solutions for enhancing crop yields per hectare and improving nutrient use efficiency are driving the base of the market, the penetration of micronutrients and water-soluble fertilizers, and adding to the overall market share globally.
For instance, in June 2024, controlled-release and water-soluble fertilizer formulations accounted for ~58% of total specialty fertilizer sales in Asia-Pacific, reflecting growing grower preference for efficiency and expanding market share.
Specialty Fertilizers Market Restraints:
-
High Product Costs and Price Sensitivity are Hampering the Specialty Fertilizers Market Growth
High product costs & price sensitivity of specialty fertilizers also restrict the specialty fertilizers market growth, as a large number of smallholder farmers who constitute the majority of growers in developing regions find premium-priced formulations economically inaccessible. This might lead to underutilization in price-sensitive markets, limited adoption, and reduced return on investment for growers. As a result, crop yield potential remains under-realized, and market growth is stunted in regions where subsistence farming is prevalent and access to credit is limited.
Specialty Fertilizers Market Opportunities:
-
Precision Farming Integration and Digital Agriculture Drive Future Growth Opportunities for the Specialty Fertilizers Market
The opportunity in the precision farming integration and digital agriculture in specialty fertilizers market is in the form of variable rate technology application, zone-specific nutrient management, and real-time crop health monitoring. These solutions provide for site-specific fertilizer application, reduced input waste, and enhanced environmental stewardship. Through improved crop yield consistency, optimized input costs, and operational efficiency, particularly in areas with large-scale commercial agriculture, these technologies may improve farm profitability, reduce nutrient leaching, and expand the market.
For instance, in April 2024, the FAO reported that adoption of precision agriculture technologies could increase fertilizer use efficiency by up to 30% in row crop production, highlighting rising grower interest and increasing demand for specialty fertilizer formulations compatible with variable rate application.
Specialty Fertilizers Market Segmentation Analysis
-
By chemical type, urea ammonium nitrate held the largest share of around 22.5% in 2025E, and the potassium nitrate segment is expected to register the highest growth with a CAGR of 8.12%.
-
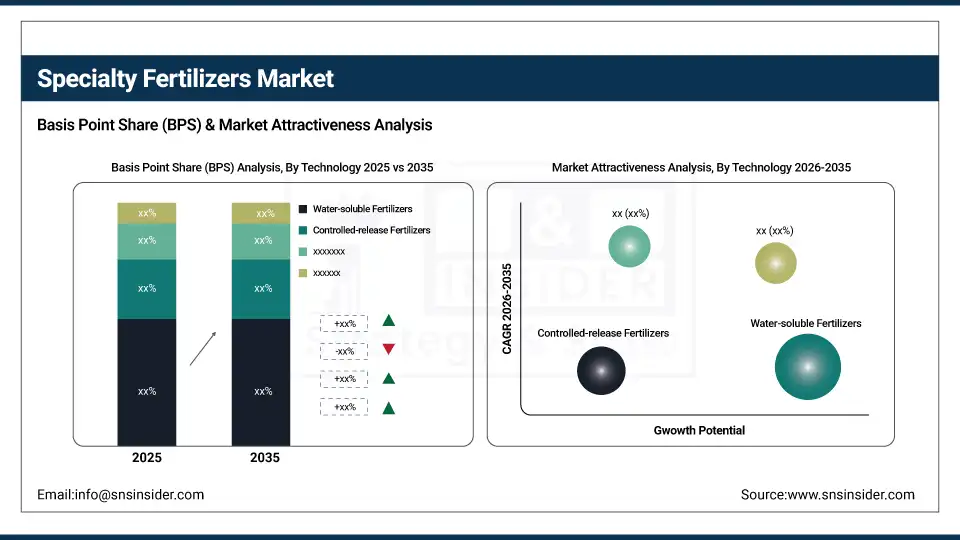
By technology, water-soluble fertilizers dominated the market with approximately 34.2% share in 2025E, while the controlled-release fertilizers is expected to register the highest growth with a CAGR of 8.45%.
-
By crop-type, cereals & grains accounted for the leading share of nearly 42.8% in 2025E, and is expected to register the highest growth with a CAGR of 7.58%.
-
By application, soil application held the largest share of around 51.3% in 2025E, and the fertigation segment is expected to register the highest growth with a CAGR of 8.21%.
By Technology, Water-soluble Fertilizers Leads the Market, While Controlled-release Registers Fastest Growth
The water-soluble fertilizers segment accounted for the highest revenue share of approximately 34.2% in 2025, owing to their compatibility with modern irrigation systems, rapid nutrient availability for crop uptake, and strong grower preference for fertigation in high-value crops. Emerging trends include increasing requirements for precise nutrient management in protected cultivation and greenhouse production. In comparison, the controlled-release fertilizers segment is anticipated to achieve the highest CAGR of nearly 8.45% during the 2026–2035 period, driven by the increasing demand for labor-saving inputs, reduced nutrient losses, and extended feeding duration. Drivers include rising adoption among row crop producers, the preference for single-application solutions, and environmental concerns regarding nitrogen volatilization.
By Application, the Soil Application Segment dominates, while the Fertigation Segment Shows Rapid Growth
By 2025, the soil application segment contributed the largest revenue share of 51.3% due to its traditional grower familiarity, compatibility with existing application equipment, and effectiveness for base nutrient incorporation. Growing adoption of band placement and starter fertilizer programs, growers are increasingly aware of soil-specific nutrient management. The fertigation segment is projected to grow at the highest CAGR of about 8.21% between 2026 and 2035 due to the growing need for water-use efficiency and precision nutrient delivery in irrigated production systems. Some of the reasons include better crop yield response in fruits and vegetables, better resource conservation, and growers' preference for integrated water-nutrient management solutions.
By Crop-Type, Cereals & Grains Lead, and Registers Fastest Growth
The cereals & grains accounted for the largest share of the specialty fertilizers market with about 42.8%, owing to their vast planted acreage globally, staple food importance, and investment capacity for productivity-enhancing inputs. Reasons driving the cereals & grains segment include increasing global demand for food security and biofuel feedstocks. In addition, it is slated to grow at the fastest rate with a CAGR of around 7.58% throughout the forecast period of 2026–2035, as corn, wheat, and rice producers seek high-efficiency nitrogen formulations, enhanced efficiency fertilizers, and micronutrient packages. Increased focus on yield gap closure and sustainable intensification contribute to their adoption, while improved grain quality and protein content drive continued investment.
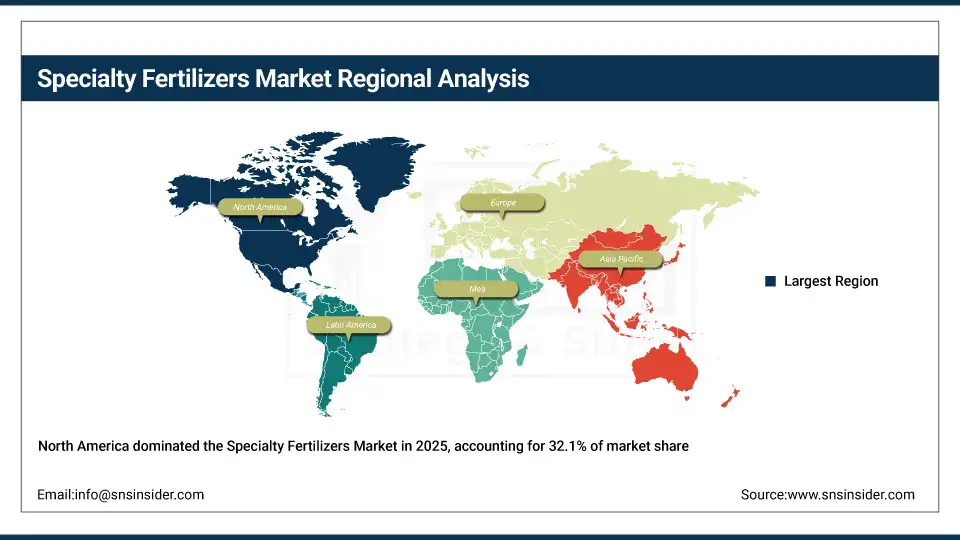
Specialty Fertilizers Market Regional Highlights:
North America Specialty Fertilizers Market Insights:
North America held the largest revenue share of over 32.1% in 2025 of the specialty fertilizers market due to an established precision agriculture infrastructure, stringent environmental regulations regarding nutrient management, and increased grower awareness regarding the advantages of enhanced efficiency fertilizers. Drivers include ubiquitous use of variable rate technology, an improved distribution network for specialty products, growing adoption of cover crops and conservation tillage, and greater acceptance of 4R nutrient stewardship principles stemming from industry sustainability initiatives. At the same time, various government cost-share programs for nutrient management, USDA conservation initiatives, and enormous investments in fertilizer research from industry players are anchoring specialty fertilizer formulations in the market, and ensuring multi-billion dollar revenues across the region.
Get Customized Report as per Your Business Requirement - Enquiry Now
Asia Pacific Specialty Fertilizers Market Insights:
Asia Pacific is the fastest-growing segment in the specialty fertilizers market with a CAGR of 8.42%, as the awareness about high-efficiency crop nutrition, government food security initiatives, and modern irrigation infrastructure expansion in developing nations is growing. Factors including rapid population growth, rising middle-class food consumption patterns, and growing uptake of high-value horticulture production are stimulating the market growth. Controlled-release and water-soluble fertilizers have been instrumental in improving crop productivity, especially in intensive rice-wheat systems and tropical fruit plantations. Public-private partnerships and fertilizer subsidy reforms also help in advancing agricultural productivity and technology adoption. Increase in demand in Asia Pacific region owing to rising fertilizer consumption against historical usage levels and growing affordability of micronutrient and specialty blends.
Europe Specialty Fertilizers Market Insights:
The specialty fertilizers market in Europe is the second-dominating region after North America on account of an increase in the adoption of controlled-release fertilizers, robust environmental protection regulations including the Nitrates Directive and European Green Deal, and increasing organic and sustainable farming initiatives across agricultural systems. Rising implementation of national nutrient management plans, advanced fertilizer coating technologies, favorable CAP subsidies for precision farming, and cross-border harmonization of fertilizer standards are also contributing to the sustained growth of the market in leading European countries.
Latin America (LATAM) and Middle East & Africa (MEA) Specialty Fertilizers Market Insights:
In Latin America, and Middle East & Africa, the growing agricultural export demand and increase in irrigated area with precision application systems support the specialty fertilizers market growth. The rising popularity of soluble fertilizer formulations and micronutrient packages, along with public extension campaigns, will aid crop productivity and resource efficiency. The increasing commercial farming operations and improving supply chain infrastructure in these regions are continuing to encourage market growth.
Specialty Fertilizers Market Competitive Landscape:
Nutrien Ltd. (est. 2018) is a leading global provider of crop inputs and services, focusing on integrated agronomic solutions for sustainable agriculture. It uses its comprehensive retail network and potash production capabilities to produce cutting-edge specialty fertilizer technology with seamless crop nutrition advisory integration.
-
In February 2025, it expanded its controlled-release fertilizer product line with enhanced polymer coating technologies and precision application tools, aiming to improve nitrogen use efficiency and reduce environmental footprint across its North American retail network.
Yara International ASA (est. 1905) is a well-known global crop nutrition company focused on nitrogen-based fertilizers, industrial products, and environmental solutions. It invests in water-soluble fertilizer formulations and digital agronomy platforms with the hopes of revolutionizing crop production with precise, sustainable, and high-yield nutrient programs.
-
In May 2024, launched an enhanced controlled-release fertilizer portfolio featuring nitrification inhibitors and micronutrient fortification across European and North American markets, enhancing crop yield stability, nitrogen retention, and environmental compliance.
The Mosaic Company (est. 2004) is a leading global producer and marketer of concentrated phosphate and potash crop nutrients. The company's specialty fertilizer product portfolio focuses on high-analysis formulations and low-impurity sources, and features a strong commitment to sustainable mining and continuous innovation to complement the strong market presence in both direct application and blended fertilizers.
-
In September 2024, introduced advanced MicroEssentials sulfur-enhanced fertilizer formulations and performance data analytics for its distributor network, strengthening site-specific nutrient management capabilities and expanding adoption among row crop and specialty crop producers.
Specialty Fertilizers Market Key Players:
-
Nutrien Ltd.
-
The Mosaic Company
-
CF Industries Holdings, Inc.
-
ICL Group Ltd.
-
Koch Industries, Inc. (Koch Fertilizer)
-
EuroChem Group AG
-
SQM S.A.
-
Uralchem JSC
-
Coromandel International Limited
-
Deepak Fertilizers and Petrochemicals Corporation Ltd.
-
Gujarat State Fertilizers & Chemicals Ltd.
-
K+S Aktiengesellschaft
-
Compo Expert GmbH
-
Helena Agri-Enterprises, LLC
-
Wilbur-Ellis Company Inc.
-
Agrium Inc. (now part of Nutrien)
-
Israel Chemicals Ltd. (ICL)
-
Arab Potash Company
-
PhosAgro PJSC
| Report Attributes | Details |
|---|---|
| Market Size in 2025 | USD 34.85 Billion |
| Market Size by 2035 | USD 70.58 Billion |
| CAGR | CAGR of 7.31% From 2026 to 2035 |
| Base Year | 2025 |
| Forecast Period | 2026-2035 |
| Historical Data | 2022-2024 |
| Report Scope & Coverage | Market Size, Segments Analysis, Competitive Landscape, Regional Analysis, DROC & SWOT Analysis, Forecast Outlook |
| Key Segments | •By Chemical Type (Urea Ammonium Nitrate, Calcium Ammonium Nitrate, Monoammonium Phosphate, Sulfate of Potash, Potassium Nitrate, Urea Derivatives, Blends of NPK, and Others) •By Technology (Controlled-release Fertilizers, Water-soluble Fertilizers, Liquid Fertilizers, Micronutrients, and Others) •By Crop-Type (Cereals & Grains, Frutis & Vegetables, Oilseeds & Pulses, and Others) •By Application (Fertigation, Foliar, and Soil) |
| Regional Analysis/Coverage | North America (US, Canada, Mexico), Europe (Germany, France, UK, Italy, Spain, Poland, Turkey, Rest of Europe), Asia Pacific (China, India, Japan, South Korea, Singapore, Australia, Rest of Asia Pacific), Middle East & Africa (UAE, Saudi Arabia, Qatar, South Africa, Rest of Middle East & Africa), Latin America (Brazil, Argentina, Rest of Latin America) |
| Company Profiles | Nutrien Ltd., Yara International ASA, ICL Group (Israel Chemicals Ltd.), The Mosaic Company, CF Industries Holdings, Inc., OCP Group, SQM S.A. (Sociedad Química y Minera de Chile), EuroChem Group, K+S Aktiengesellschaft, and Coromandel International Limited |
Frequently Asked Questions
Nutrien, Yara International, ICL Group, The Mosaic Company, and CF Industries are top specialty fertilizers companies worldwide.
North America is witnessing the fastest specialty fertilizers market growth, driven by digital farming technologies and climate-smart nutrient management.
Controlled-release fertilizers and water-soluble fertilizers remain the most in-demand types, supporting precision agriculture and sustainable nutrient management.
Precision agriculture adoption, sustainability goals, and demand for controlled-release and water-soluble fertilizers drive specialty fertilizers market growth.
The specialty fertilizers market size was valued at around USD 34.85 billion in 2025 and continues growing strongly.
Get in Touch
