AI-based Electrical Switchgear Market Report Scope & Overview:
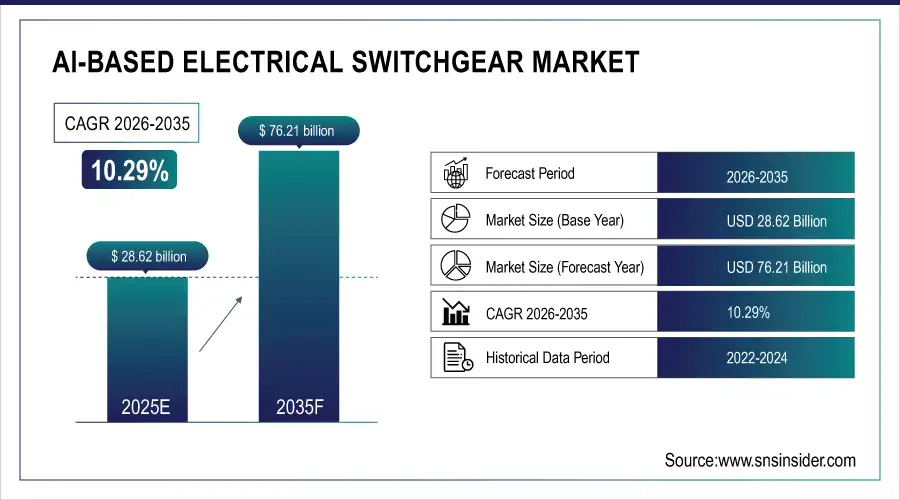
The AI-based Electrical Switchgear Market was valued at USD 28.62 billion in 2025 and is expected to reach USD 76.21 billion by 2035, growing at a CAGR of 10.29% from 2026-2035.
AI-based Electrical Switchgear Market growth is driven by the increasing Advent of intelligent power distribution units, predictive maintenance, and real-time fault detection, mainly in industrial and utility sectors will result in enhancing the AI-based electrical switchgear market growth. These systems combine their AI algorithms with more traditional switchgear when it comes to detecting any form of failures to enhance operational reliability, increase uptime, and optimize energy consumption.
AI-based Electrical Switchgear Market Size and Forecast
-
Market Size in 2025: USD 28.62 Billion
-
Market Size by 2035: USD 76.21 Billion
-
CAGR: 10.29% from 2026 to 2035
-
Base Year: 2025
-
Forecast Period: 2026–2035
-
Historical Data: 2022–2024
To Get more information On AI-based Electrical Switchgear Market - Request Free Sample Report
AI-based Electrical Switchgear Market Trends
-
Rising demand for smart, energy-efficient, and automated electrical distribution systems is driving the AI-based electrical switchgear market.
-
Growing adoption across industrial, commercial, and residential sectors is boosting market growth.
-
Expansion of IoT-enabled and predictive maintenance solutions is fueling deployment.
-
Increasing focus on grid reliability, fault detection, and real-time monitoring is shaping adoption trends.
-
Advancements in AI, machine learning, and sensor integration are enhancing operational efficiency and safety.
-
Rising investments in smart grids, renewable energy, and sustainable infrastructure are supporting market expansion.
-
Collaborations between switchgear manufacturers, AI solution providers, and utility companies are accelerating innovation and global adoption.
The AI-based Electrical Switchgear Market trend in the U.S. is driven by the Rising adoption of renewables and digital infrastructure is creating a need for grid modernization, predictive maintenance, and smart energy management. U.S. AI-based Electrical Switchgear Market was valued at USD 8.95 billion in 2025 and is expected to reach USD 23.03 billion by 2035, growing at a CAGR of 9.91% from 2026-2035.

AI-based Electrical Switchgear Market Growth Drivers:
-
Rising Smart Grid Deployment Is Driving Demand for AI-Based Switchgear That Supports Real-Time Diagnostics and Predictive Maintenance
Smart grids and digital substations are being launched rapidly, which has become one of the major growth drivers for the AI-based electrical switchgear market. For example, utilities and industrial customers are also moving to intelligent switchgear, with built-in artificial intelligence for real-time fault detection and load optimization, predictive maintenance, etc. The driving forces behind this transition are to reduce outages, increase the lifespan of equipment, and enhance the reliability of the grid. By analyzing data from sensors and usage, AI allows for quicker decision-making, minimizes human intervention, and improves safety. With governments driving the pursuit of energy efficiency and the digital transformation of power infrastructure, AI-based switchgear enables the remote monitoring and dynamic response to grid anomalies.
AI-based Electrical Switchgear Market Restraints:
-
The Expensive Setup and Complexity of Integrating AI With Legacy Systems Hinder Adoption, Especially Among Small Utilities
However, high upfront cost and complications in integrating AI with legacy electrical systems are major restraints. Introduction of AI-based switchgear systems involves the utilization of advanced sensors, communication protocols, and software platforms that may be costly for small- to mid-scale utilities or industries with budget constraints. At the same time, retrofitting existing infrastructure with smart elements requires a high level of customization and skilled personnel. This integration challenge is not only exacerbated by cybersecurity challenges, but also by the interoperability problems between vendors. Such factors can contribute to longer adoption timelines and higher total cost of ownership, particularly in developing regions with old electrical infrastructure and low levels of digital capacity.
AI-based Electrical Switchgear Market Opportunities:
-
Increasing Investments in Electrification and Renewable Integration Are Creating Strong Demand for AI-Powered Grid Automation Solutions
The rapidly evolving landscape of grid modernization and electrification is a major opportunity for AI-enabled switchgear. With millions of EVs and other energy-intensive devices being connected to the grid, governments and private utilities are pouring hundreds of billions into building new infrastructure. And AI-based switchgear will contribute with automation, fault tolerance and load balancing functions for these fluid energy ecosystems. Additionally, rising regulatory pressure to reduce carbon emissions and ensure energy efficiency is creating a high demand for digital, intelligent solutions. This trend will provide an opportunity for vendors to deliver modular, scalable AI-integrated switchgear systems for urban and rural grid applications.
AI-based Electrical Switchgear Market Challenges:
-
Growing Connectivity of AI-Based Switchgear Increases Vulnerability to Cyberattacks, Posing Risks to Critical Power Infrastructure
The connectivity of AI-based switchgear through the IoT and cloud platforms naturally makes it vulnerable to cyberattacks and data breaches, creating an even bigger challenge. Power system is a part of Critical infrastructure, and any unauthorized access or manipulation in AI-based switchgear might lead to power interruption or system outage. While the use of real-time data from sensors and communication networks is a key benefit of Industry 4.0, if not properly secured, it can be exposed to compromise. Moreover, conforming to data privacy requirements like GDPR or local data protection regulations further complicates the design and functioning of such systems. Mitigating these risks necessitates strong cybersecurity frameworks, ongoing threat assessments, and regular updates — sometimes at an additional expense.
AI-based Electrical Switchgear Market Segmentation Analysis:
By Component:
In 2025, the hardware segment dominated the AI-based electrical switchgear market and accounted for a significant revenue share. Its growth is driven by the increasing adoption of AI-based intelligent sensors, circuit breakers, and smart relays. Such features provide several benefits, including real-time tracking and detection of faults, and are critical components for grid automation, industrial safety, as well as predictive maintenance solutions for utility and manufacturing applications.
The software segment is expected to register the fastest CAGR during the forecast period. As AI analytics platforms and Digital Twin software gain traction. Deployment of smart grid systems and cloud-based monitoring tools that help to optimize the operations of switchgears, minimize energy loss, and increase the efficiency of remote diagnostics in utility-scale and industrial applications is driving this growth.

By Business Model:
In 2025, the B2B (Business-to-Business) segment dominated the AI-based electrical switchgear market and accounted for a significant revenue share. This leadership is because of the mass need from utilities, modern energy foundation ventures for smart power dissemination systems. B2B is what enterprises want for custom systems and long-term service contracts, and for connections to the old grid apparatus.
The D2C (Direct-to-Consumer) segment is expected to register the fastest CAGR during the forecast period, due to increasing adoption of smart homes as well as the demand for energy-efficient and AI-enabled electrical solutions from consumers. As residential electrification and IoT diffusion increase, manufacturers are pursuing end users directly via e-commerce and digital platforms, enhancing accessibility and driving consumer-facing product adoption.
By Enterprise Size:
In 2025, the large enterprises segment dominated the AI-based electrical switchgear market and accounted for a significant revenue share. These organizations lead adoption due to their large budgets, large-scale infrastructure, and the scale and complexity of energy management inherently make them pathfinders in adoption. Grid modernization, predictive maintenance, and AI integration are receiving a large influx of investment to support operational efficiency, system stability, and compliance with evolving energy regulatory requirements.
The Small & Medium Enterprises (SMEs) segment is expected to register the fastest CAGR during the forecast period, supported by the growing availability of cost-effective modular AI-based switchgear systems. Government incentives, growing awareness towards developing energy-efficient systems, and scalability in AI platforms are enticing SMEs to develop smart electrical systems to enhance operational performance, improve uptime, and lower maintenance costs.
By Application:
In 2025, automotive segment dominated the AI-based electrical switchgear market and accounted for a significant revenue share. The growth is fueled by increased vehicle electrification, manufacturing plant automation, and an increase in demand for energy-efficient power distribution. To ensure a dependable system, predictive fault analysis, and seamless energy utilization, automotive OEMs and component manufacturers are integrating an AI-based switchgear.
The healthcare segment is expected to register the fastest CAGR during the forecast period due to a growing number of investments in smart hospitals and nonstop power supply systems. Importance of AI-Based Switchgear in Critical Healthcare Infrastructure. Based switchgear ensures that high ultra-reliable facilities operations continuity, predictive maintenance of electrical assets while enhancing energy efficiencies, making it critical for healthcare infrastructure supporting sensitive equipment and patient safety in developed as well as developing regions.
AI-based Electrical Switchgear Market Regional Outlook:
North America AI-based Electrical Switchgear Market Insights
In 2025, the North America region dominated the AI-based electrical switchgear market and accounted for a significant revenue share. The region leads due to advanced power infrastructure, high adoption of smart grid technologies, and strong investments from utilities in AI-enabled predictive maintenance systems. Supportive government policies and early adoption across industries drive sustained market dominance in the region.

Get Customized Report as per Your Business Requirement - Enquiry Now
Asia Pacific AI-based Electrical Switchgear Market Insights
According to the AI-based electrical switchgear market analysis, The Asia-Pacific region is expected to register the fastest CAGR during the forecast period, driven by expanding industrialization, large-scale electrification, and growing demand for grid automation in emerging economies like India and Southeast Asia. Government smart grid initiatives, rapid infrastructure upgrades, and increasing deployment of renewable energy sources are accelerating the demand for AI-based switchgear across the region.
Europe AI-based Electrical Switchgear Market Insights
The Europe market is witnessing strong growth due to stringent energy efficiency regulations, modernization of electrical infrastructure, and increased adoption of AI in utilities. Ongoing smart grid deployments and demand for predictive maintenance solutions will continue driving AI-based switchgear adoption across industrial and residential sectors.
Germany dominated the Europe AI-based electrical switchgear market, supported by its advanced industrial base, strong renewable energy initiatives, and government-led grid automation programs. Investments in smart substations and AI-integrated power systems are expected to accelerate, positioning Germany as a key hub for intelligent energy infrastructure innovation.
Middle East & Africa and Latin America AI-based Electrical Switchgear Market Insights
The AI-based Electrical Switchgear Market in Middle East & Africa and Latin America is expanding due to rising industrial automation, smart grid adoption, and infrastructure modernization. Growing demand for energy-efficient solutions, predictive maintenance, and reliable power distribution is driving market growth, with utilities and industrial sectors leading adoption.
AI-based Electrical Switchgear Market Competitive Landscape:
Schneider Electric
Schneider Electric continues to expand its EcoStruxure portfolio with AI-enabled, SF₆-free switchgear and digital monitoring solutions. By embedding sensors and predictive analytics, the company enables condition-based monitoring, operational reliability, and smarter electrical distribution. Its innovations target resilient, energy-efficient infrastructure and seamless integration into AI-ready industrial and utility systems, enhancing predictive maintenance and grid performance.
-
2025: Launched GM AirSeT SF₆‑free primary switchgear with embedded sensor data, condition-based monitoring, and digital diagnostics.
-
2024: Introduced EasySet MV air-insulated switchgear with simplified installation, digital monitoring, and operational reliability enhancements.
Eaton
Eaton focuses on AI-driven power monitoring and smart switchgear solutions, integrating edge analytics and digital twin models to enhance electrical system resilience. Its platforms detect AI power bursts, manage 800 VDC AI factory infrastructure, and enable predictive maintenance. By combining UPS, switchgear, and intelligent energy management, Eaton supports scalable, AI-ready industrial facilities, ensuring continuity, reliability, and efficiency across complex power networks.
-
2025: Announced edge-based analytics to detect AI power bursts and protect switchgear and grid infrastructure.
-
2025: Unveiled 800 VDC power reference architecture for AI factories, integrating intelligent power management and UPS.
-
2025: Collaborated with Autodesk to deliver AI-powered digital energy twin tools for predictive maintenance and lifecycle planning.
Siemens
Siemens integrates AI agents and digital diagnostics into its Industrial Copilot platform, enabling autonomous workflow execution, predictive maintenance, and smarter industrial infrastructure management. Modular, AI-ready medium-voltage switchgear and transformer solutions support rapid deployment in data centers and industrial facilities, enhancing operational efficiency and enabling real-time analytics across energy systems.
-
2025: Introduced AI agents in Industrial Copilot for autonomous workflow execution and advanced diagnostics at Automate 2025.
-
2024: Partnered with Compass Datacenters on modular medium-voltage smart switchgear and transformer solutions.
Hitachi Energy
Hitachi Energy leads in sustainable electrical infrastructure with SF₆-free switchgear capable of high-voltage applications. Its digital switchgear platforms integrate with smart grids, enabling energy-efficient operation, next-generation power system deployment, and sustainable grid expansion, aligning with global decarbonization and electrification goals.
-
2024: Launched the world’s highest voltage SF₆‑free switchgear, advancing sustainable grid expansion and digital integration.
Key Players
-
ABB
-
Schneider Electric
-
Mitsubishi Electric
-
Eaton
-
Hitachi Energy
-
Toshiba
-
Meidensha
-
Crompton Greaves (CG Power)
-
Fuji Electric
-
Lutron Electronics
-
Signify
-
SwitchGear Company NV
-
Lucy Electric
-
Havells India
-
Chint Group
-
Powell Industries
-
Rockwell Automation
-
WEG S.A
|
Report Attributes |
Details |
|---|---|
|
Market Size in 2025 |
USD 28.62 Billion |
|
Market Size by 2035 |
USD 76.21 Billion |
|
CAGR |
CAGR of 10.29 % From 2026 to 2035 |
|
Base Year |
2025 |
|
Forecast Period |
2026-2035 |
|
Historical Data |
2022-2024 |
|
Report Scope & Coverage |
Market Size, Segments Analysis, Competitive Landscape, Regional Analysis, DROC & SWOT Analysis, Forecast Outlook |
|
Key Segments |
• By Component (Hardware, Software, Services), |
|
Regional Analysis/Coverage |
North America (US, Canada), Europe (Germany, France, UK, Italy, Spain, Poland, Rest of Europe), Asia Pacific (China, India, Japan, South Korea, ASEAN Countries, Australia, Rest of Asia Pacific), Middle East & Africa (UAE, Saudi Arabia, Qatar,Egypt, South Africa, Rest of Middle East & Africa), Latin America (Brazil, Argentina, Mexico, Colombia, Rest of Latin America) |
|
Company Profiles |
ABB, Schneider Electric, Siemens, Mitsubishi Electric, Eaton, Hitachi Energy, Toshiba, Meidensha, Crompton Greaves (CG Power), Fuji Electric, General Electric, Lutron Electronics, Signify, SwitchGear Company NV, Lucy Electric, Havells India, Chint Group, Powell Industries, Rockwell Automation, WEG S.A. |
Get in Touch
