Energy Measurement IC Market Size & Growth:
The Energy Measurement ICs Market size was valued at USD 6.72 billion in 2025 and is expected to reach USD 14.21 billion by 2035 and grow at a CAGR of 7.77% over the forecast period of 2026-2035.
The global market is seeing a healthy momentum across the globe primarily on account of increasing implementation of smart grids, investments in industrial automation, and increasing need for accurate power measurements in modern electric vehicles and renewable energy systems. In this report, detailed Energy Measurement IC market analysis pertaining to the cause factor, high potential market segments, leading market players, growth catalysts and regional performance are provided, which indicate strong growth potential across applications, geographies in the coming years.
Energy Measurement IC Market Size and Forecast:
-
Market Size in 2025: USD 6.72 Billion
-
Market Size by 2035: USD 14.21 Billion
-
CAGR: 7.77% from 2026 to 2035
-
Base Year: 2025
-
Forecast Period: 2026–2035
-
Historical Data: 2022–2024

To Get more information on Energy Measurement ICs Market - Request Free Sample Report
Key Trends in the Energy Measurement IC Market:
-
Rising adoption of smart meters driven by grid modernization and advanced metering infrastructure (AMI) deployments.
-
Growing demand for accurate and real-time energy monitoring in residential, commercial, and industrial applications.
-
Increasing focus on energy efficiency and power management to comply with global energy regulations and sustainability goals.
-
Rapid expansion of renewable energy systems and distributed energy resources requiring precise power measurement.
-
Integration of IoT and connectivity features in energy measurement ICs for remote monitoring and data analytics.
-
Advancements in multi-phase and high-precision metering ICs supporting complex power systems.
-
Higher adoption of energy measurement ICs in electric vehicle (EV) charging infrastructure and smart appliances.
For instance, over 65% of utility companies globally have initiated smart grid deployments integrating energy measurement ICs.
The U.S. Energy Measurement IC Market size was USD 4.68 billion in 2024 and is expected to reach USD 8.42 billion by 2032, growing at a CAGR of 7.68% over the forecast period of 2025–2032.
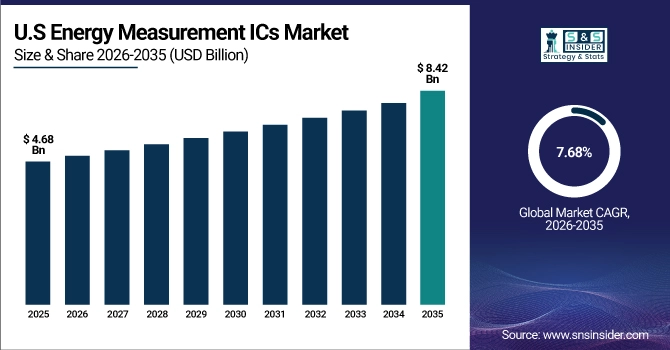
The U.S. market is thriving due to the unprecedented increase in smart meters deployments, robust grid modernization investments, and the rapid growth of the electric vehicle ecosystem. The forecast period is characterized by the increasing integration of renewable energy sources and the overall digitization of industrial operations, and as this continues, demand for energy measurement ICs will also be driven from the opposite direction by government support for energy-efficient technologies and solutions for residential, commercial, and utility-scale applications.
For instance, U.S. electric vehicle sales surpassed 1.5 million units in 2024, with each vehicle requiring multiple energy monitoring ICs.
Energy Measurement ICs Market Key Drivers:
-
Smart Grid Deployment and Government Initiatives Accelerate the Demand for Precision Power Monitoring and Energy Management Solutions Globally
The smart grid expansion in developed and emerging economies is a major driver of energy measurement IC adoption for precise energy tracking and billing. It allows real-time consumption analytics, minimizes losses, and enhances grid fidelity. Government stimuli to upgrade utility infrastructure and encourage the adoption of smart meters play an outsized role. Furthermore, incentives and regulations in favor of energy efficiency are boosting utility providers’ adoption of metering ICs in both urban and rural environments, encouraging Energy Measurement IC market growth over the forecast period.
For instance, approximately 75% of utility companies globally have adopted some form of digital metering and energy data acquisition by 2024.
Energy Measurement ICs Market Restraints:
-
High Initial Design Complexity and Integration Challenges in Smart Grid Systems Hinder Broad Deployment Across All Regions
Designing and integrating energy measurement ICs in complex smart grids can be particularly challenging. As engineers must meet extreme accuracy, temperature stability, and power frequency noise immunity requirements, the deployment cycle often takes longer. Several utility companies, especially in the developing world, are not technologically advanced enough, nor do they have the budget to implement such advanced variations. Furthermore, as device providers must also consider incumbent infrastructure interconnectivity, the development and deployment cycle may be slower, and uptake across regions may be limited despite long-term attractiveness.
Energy Measurement ICs Market Opportunities:
-
Rising Integration of Renewable Energy Systems Creates Significant Demand for High-Precision Energy Measurement Solutions
The demand for accurate power monitoring in solar and wind installations is increasing as countries shift to cleaner, decentralized energy sources. In renewable systems, energy measurement ICs help keep track of generation, load balancing, and synchronization to the grid. Granular insights are made available to solar inverters, wind turbines, and microgrids through their integration into these systems. This opportunity is growing in the utility-scale and residential spaces, particularly where renewable energy targets are aggressive and green infrastructure funding is available.
For instance, over 70% of grid operators report that high-frequency data from energy measurement ICs is essential for balancing variable renewable inputs.
Energy Measurement ICs Market Challenges:
-
Lack of Universal Standards and Protocols for Energy Data Communication Hampers Seamless Interoperability Between Devices
The key challenge in deploying energy measurement ICs at scale is the lack of industrial standardization of communication protocols and data formats. As a result, this leads to the fragmentation; the device, the utility, and the platform cannot communicate well with each other, leading to higher integration costs and complexity. One of the main challenges faced in deploying energy monitoring systems across regions is the absence of universal standards. Along with IoT ecosystem to deploy energy measurement IC solutions, this issue especially impacts multi-vendor deployments in the smart grid, and industrial plant, and multi-tenant building application spaces which serves to slow their adoption.
Energy Measurement ICs Market Segmentation Analysis
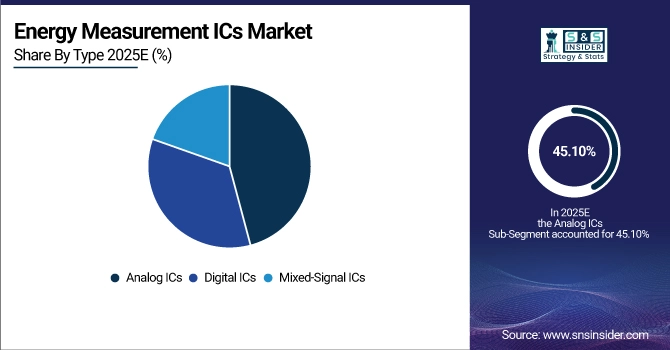
By Type, Analog ICs Segment Dominates Energy Measurement IC Market with 45.10% Share in 2025 and Records Fastest Growth with 8.64% CAGR
The Analog ICs segment accounted for the largest share of the Energy Measurement IC Market at 45.10% in 2025, reflecting its widespread adoption in precision and low-power energy metering applications. Analog ICs are extensively used in smart grids, industrial automation, and legacy infrastructure upgrades due to their high accuracy and reliability. Leading players such as Analog Devices Inc. continue to strengthen their analog front-end solutions, which are critical for efficient energy monitoring and digital transition of traditional power systems. The segment’s ability to support precise measurement with minimal power consumption has reinforced its dominant position.
The Analog ICs segment is also expected to grow at the fastest pace, registering a CAGR of 8.64% during 2026-2035. Growth is driven by increasing investments in grid modernization, demand for efficient energy utilization, and the need to upgrade aging electrical infrastructure with advanced monitoring capabilities.
By Application, Smart Meters Segment Leads with 35.06% Share in 2025, Industrial Automation to Record Fastest Growth with 8.75% CAGR
The Smart Meters segment held the largest revenue share of 35.06% in the Energy Measurement IC Market in 2025. Smart meters play a vital role in grid modernization by enabling real-time energy monitoring, accurate billing, and efficient power distribution. Specialized energy measurement ICs developed by companies such as Renesas Electronics are integral to next-generation smart metering solutions. Strong government initiatives aimed at reducing transmission losses and improving energy efficiency across North America, Europe, and Asia continue to drive adoption.
The Industrial Automation segment is expected to register the highest CAGR of 8.75% during 2026-2035. As factories increasingly adopt automation and Industry 4.0 practices, demand for embedded energy measurement ICs is rising. Companies such as Texas Instruments are delivering advanced ICs that enable real-time power analytics, helping industries reduce energy losses, minimize downtime, and comply with stringent energy efficiency regulations.
By Technology, Power Line Communication (PLC) Dominates with 50.10% Share in 2025, Wireless Communication to Grow at 8.16% CAGR
In 2025, Power Line Communication (PLC) technology accounted for 50.10% of the Energy Measurement IC Market share, driven by its cost-effectiveness and ability to leverage existing power infrastructure. PLC-based ICs are widely adopted in smart metering applications, especially in developed regions where replacing legacy wiring is impractical. Companies such as Maxim Integrated provide PLC-enabled ICs that ensure reliable data transmission and accurate billing without additional communication infrastructure.
The Wireless Communication segment is projected to grow at a CAGR of 8.16% during 2026-2035, fueled by rising demand for IoT-enabled energy monitoring and smart home solutions. Silicon Labs offers wireless energy measurement ICs supporting Zigbee and sub-GHz protocols, which are particularly suitable for remote installations and space-constrained environments. Wireless technologies enable real-time diagnostics, reduced maintenance, and enhanced flexibility in utility and renewable energy systems.
By End-User, Residential Segment Leads with 40.30% Share in 2025, Industrial Segment to Grow at 7.98% CAGR
The Residential segment accounted for the highest market share of 40.30% in 2025, driven by widespread deployment of smart meters and increasing adoption of smart home technologies. Rising consumer awareness of energy efficiency and transparent billing has accelerated demand for residential energy measurement ICs. Companies such as Infineon Technologies have developed low-power ICs specifically designed for home applications, enabling detailed load monitoring and efficient energy usage.
The Industrial segment is expected to grow at a CAGR of 7.98% during 2026-2035, supported by increasing automation, sustainability initiatives, and energy-intensive industrial operations. NXP Semiconductors offers high-reliability energy measurement ICs that support predictive maintenance and efficiency optimization in industrial environments. These solutions are critical for reducing operational costs, minimizing energy waste, and improving reliability in heavy industries.
Energy Measurement ICs Market Regional Analysis
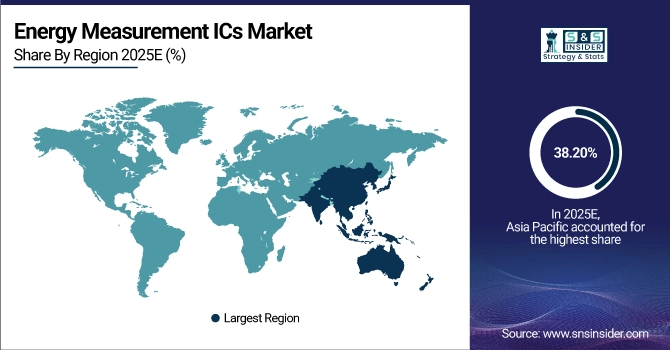
Asia Pacific Energy Measurement IC Market Insights
Asia Pacific led the Energy Measurement IC Market with a revenue share of 38.20% in 2025 and is projected to grow at the fastest CAGR of 8.46% during 2026–2035. This rapid growth is attributed to large-scale smart meter deployments, rapid urbanization, and the strong presence of manufacturing and utility sectors. Countries including China, India, and Japan are making significant investments in smart grids, renewable energy systems, and electric vehicle infrastructure, positioning Asia Pacific as the largest global consumer of energy measurement ICs.
China leads the Asia Pacific market, driven by massive infrastructure development, aggressive smart city initiatives, and extensive deployment of advanced metering infrastructure. Government mandates combined with the presence of domestic players such as Hi-Link Electronics further strengthen China’s dominance in the region.
Get Customized Report as per Your Business Requirement - Enquiry Now
North America Energy Measurement IC Market Insights
In 2025, the North America Energy Measurement IC Market is experiencing steady growth, driven by the expanding installation of smart meters, refurbishment of aging grid infrastructure, and increasing deployment of electric vehicles. Strong regulatory frameworks supporting energy efficiency and sustainability continue to boost demand across the region. Additionally, technological advancements and substantial investments in research and development by leading companies such as Texas Instruments are accelerating the adoption of advanced power monitoring solutions.
The United States dominates the North American market, supported by large-scale smart grid initiatives, strong government backing for energy efficiency programs, and widespread deployment of smart meters across residential and commercial sectors. Innovation-driven companies such as Analog Devices play a key role in advancing energy measurement IC technologies and reinforcing the country’s leadership position.
Europe Energy Measurement IC Market Insights
The Europe Energy Measurement IC Market is primarily driven by stringent energy efficiency regulations, widespread integration of renewable energy sources, and a strong regional focus on sustainability objectives. Countries such as Germany and the United Kingdom are at the forefront of adopting smart grid technologies and advanced metering solutions. Key players including STMicroelectronics are contributing to innovation through the development of smart energy ICs and efficient power management solutions.
Germany dominates the European market, supported by its advanced smart grid infrastructure, robust industrial base, and ambitious renewable energy policies. Government initiatives and the presence of leading companies such as Infineon Technologies continue to accelerate the adoption of energy-efficient monitoring and control systems across the country.
Middle East & Africa and Latin America Energy Measurement IC Market Insights
In the Middle East & Africa, the Energy Measurement IC Market is led by the United Arab Emirates, driven by aggressive smart grid deployments, digital energy transformation initiatives, and investments in modern power infrastructure. The region is increasingly adopting advanced energy monitoring solutions to improve efficiency and support long-term sustainability goals.
In Latin America, Brazil dominates the market, supported by government-backed smart meter programs, energy efficiency reforms, and widespread infrastructure upgrades. These initiatives are enhancing demand for energy measurement ICs across utilities and industrial applications, positioning the region for sustained growth in the coming years.
Key Players in the Energy Measurement IC Market:
-
Texas Instruments Incorporated
-
Analog Devices, Inc.
-
STMicroelectronics N.V.
-
Renesas Electronics Corporation
-
NXP Semiconductors N.V.
-
Microchip Technology Inc.
-
Cirrus Logic, Inc.
-
ON Semiconductor Corporation
-
Infineon Technologies AG
-
Silicon Laboratories, Inc.
-
ROHM Semiconductor
-
Toshiba Electronic Devices & Storage Corporation
-
ABB Ltd.
-
Eaton Corporation plc
-
Rockwell Automation, Inc.
-
Shanghai Belling Co., Ltd.
-
Shenzhen Heliwei Technology Co., Ltd.
-
Melexis NV
-
Monolithic Power Systems, Inc.
-
Broadcom Inc.
Competitive Landscape of Energy Measurement IC Market:
Texas Instruments Incorporated
Texas Instruments Incorporated is a U.S.-based global semiconductor leader, offering a broad portfolio of energy measurement ICs used in smart meters, industrial automation, power monitoring, and grid infrastructure applications. The company specializes in high-accuracy analog front-end ICs, metrology processors, and low-power microcontrollers that enable precise energy measurement, real-time power analytics, and enhanced system reliability. Its role in the Energy Measurement IC Market is critical, supporting large-scale smart grid modernization and industrial energy efficiency initiatives worldwide.
-
In March 2024, Texas Instruments expanded its energy measurement IC portfolio with advanced analog front-end solutions designed to improve accuracy and reduce power consumption in next-generation smart meters and industrial monitoring systems.
Analog Devices, Inc.
Analog Devices, Inc. is a U.S.-based leader in high-performance analog, mixed-signal, and digital signal processing technologies, providing precision energy measurement ICs for smart grids, renewable energy systems, and industrial automation. The company’s solutions deliver high accuracy, low noise, and robust performance for real-time power monitoring and metering applications. Its strong focus on precision measurement and signal integrity positions Analog Devices as a key innovator in the Energy Measurement IC Market.
-
In February 2024, Analog Devices introduced enhanced energy metering IC platforms targeting smart grid and industrial power monitoring applications, offering improved accuracy and advanced digital connectivity features.
STMicroelectronics N.V.
STMicroelectronics N.V. is a Europe-based global semiconductor manufacturer delivering energy measurement ICs used across smart meters, industrial energy management, and residential power monitoring systems. The company combines metrology ICs with microcontrollers, power management, and connectivity solutions to support efficient and scalable energy measurement designs. Its role in the Energy Measurement IC Market is significant, particularly in Europe, where regulatory-driven energy efficiency initiatives accelerate adoption.
-
In January 2024, STMicroelectronics launched new energy metering IC solutions optimized for smart meter designs, focusing on low power consumption, high measurement accuracy, and compliance with global metrology standards.
Renesas Electronics Corporation
Renesas Electronics Corporation is a Japan-based semiconductor company offering energy measurement ICs integrated with microcontrollers and system-on-chip solutions for smart meters, industrial automation, and energy management systems. The company emphasizes high integration, low power operation, and secure data processing to support next-generation metering infrastructure. Its role in the Energy Measurement IC Market is vital, enabling utilities and industrial users to deploy reliable and scalable energy monitoring solutions.
-
In April 2024, Renesas introduced advanced metering IC and MCU-based reference designs aimed at smart grid and industrial energy monitoring applications, enhancing measurement accuracy and system efficiency.
| Report Attributes | Details |
|---|---|
| Market Size in 2025 | USD 6.72 Billion |
| Market Size by 2035 | USD 14.21 Billion |
| CAGR | CAGR of 7.77% From 2026 to 2035 |
| Base Year | 2025 |
| Forecast Period | 2026-2035 |
| Historical Data | 2022-2024 |
| Report Scope & Coverage | Market Size, Segments Analysis, Competitive Landscape, Regional Analysis, DROC & SWOT Analysis, Forecast Outlook |
| Key Segments | • By Type (Analog ICs, Digital ICs and Mixed-Signal ICs) • By Application (Smart Meters, Industrial Automation, Electric Vehicles, Renewable Energy Systems and Home Automation) • By Technology (RFID, Power Line Communication and Wireless Communication) • By End-User (Residential, Commercial and Industrial) |
| Regional Analysis/Coverage | North America (US, Canada, Mexico), Europe (Germany, France, UK, Italy, Spain, Poland, Turkey, Rest of Europe), Asia Pacific (China, India, Japan, South Korea, Singapore, Australia,Taiwan, Rest of Asia Pacific), Middle East & Africa (UAE, Saudi Arabia, Qatar, South Africa, Rest of Middle East & Africa), Latin America (Brazil, Argentina, Rest of Latin America) |
| Company Profiles | Analog Devices, Inc., Texas Instruments Incorporated, STMicroelectronics N.V., Infineon Technologies AG, NXP Semiconductors N.V., Microchip Technology Inc., Renesas Electronics Corporation, Maxim Integrated, ON Semiconductor Corporation, Cirrus Logic, Inc., Silicon Labs, ROHM Semiconductor, Melexis NV, Monolithic Power Systems, Inc., Dialog Semiconductor, IDT (Integrated Device Technology), Lattice Semiconductor, Vicor Corporation, Holtek Semiconductor Inc. and Semtech Corporation. |
Frequently Asked Questions
Ans: Asia Pacific dominated the Energy Measurement IC Market in 2025.
Ans: The Power Line Communication segment dominated the Energy Measurement IC Market in 2025.
Ans: Rising smart grid deployment, increasing energy efficiency demands, and rapid adoption of smart meters drive Energy Measurement IC market growth.
Ans: The Energy Measurement ICs Market size was valued at USD 6.72 billion in 2025 and is expected to reach USD 14.21 billion by 2035 and grow at a CAGR of 7.77% over the forecast period of 2026-2035.
Ans: The Energy Measurement IC Market is expected to grow at a CAGR of 7.77% from 2026-2035.
Get in Touch
