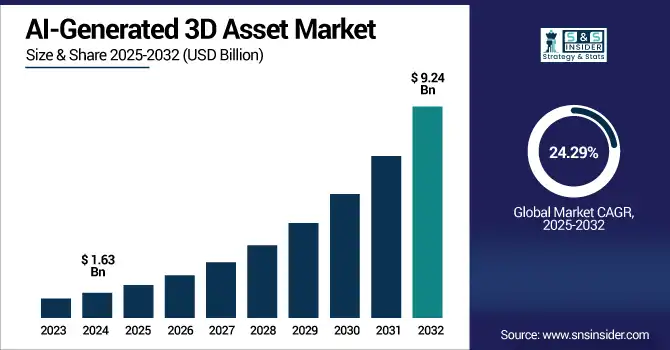
The AI-Generated 3D Asset Market size was valued at USD 1.63 billion in 2024 and is expected to reach USD 9.24 billion by 2032, growing at a CAGR of 24.29% over 2025-2032.
The AI-Generated 3D Asset Market growth due to the rising demand for high-quality and scalable 3D content across gaming, film, architecture, and e-commerce sectors. The integration of generative AI tools enables rapid asset creation, reducing production time and costs.
For instance, Stability AI’s “Stable Fast 3D” model generates high-quality, UV-unwrapped 3D assets in just 0.5 seconds from a single image, a dramatic improvement from the ~10 minutes required by its earlier SV3D model.
Additionally, automotive-grade AI technologies are building precise 3D environmental models for ADAS and autonomous driving, with over 170 patent applications supporting sensor fusion and perception systems.
Advancements in AR/VR technologies, coupled with the expansion of the metaverse and virtual experiences, are fueling adoption. Cloud deployment, increased automation, and growing investments in digital content creation further support market expansion. The surge in demand from educational platforms and virtual simulations also contributes significantly to growth, making AI-generated 3D assets a critical component of the digital ecosystem.
The U.S. AI-Generated 3D Asset Market size was valued at USD 0.46 billion in 2024 and is expected to reach USD 2.56 billion by 2032, growing at a CAGR of 23.99% over 2025-2032.
Growth in the U.S. AI-Generated 3D Asset Market is driven by high adoption of advanced design tools, rising demand in gaming and film, strong investment in generative AI, and increasing use of immersive technologies across entertainment, retail, and education sector.
Drivers
Rising Demand for Real-Time 3D Content in Gaming, Metaverse, and AR/VR Applications is Significantly Accelerating AI-Generated 3D Asset Adoption
The rapid rise of immersive digital experiences is driving demand for real-time 3D content leveraging gaming, metaverse and AR/VR platforms. Developers need large amounts of high-fidelity content but the way content is currently generated is expensive and time consuming. AI-based 3D models help automate and speed up asset production on any given renovation and development phase, while maintaining immersive, visually-rich experiences. Escalating global demand for places that are nearly identical to reality means that studios are turning to AI for optimized, textured, and rigged assets realizing that AI generated 3D content is critical in the adoption for the next gen of interactive media creation.
According to Unity, 62% of game studios reported actively using AI to improve workflows especially around content creation and animation and 71% of those said AI boosted delivery and operations. Unity’s AI tools aim to make creators up to 10× more productive, enhancing both workflows and runtime interactivity for real-time 3D experiences.
Restraints:
Lack of Standardized Formats and Interoperability Between AI-generated Models and Mainstream 3D Software Tools Slows Integration into Production Pipelines
While strides in AI created 3D content are in focus, dealing with interoperability with applications, such as Blender, Unity, and Autodesk is an issue yet-to-be-solved. Bad texture mapping, rigging, and inconsistent mesh quality, make it hard to integrate models into standard pipelines. File formats that are non-compatible and defective animation layers require a human fix leading to inefficiency. These gaps represent a roadblock to adoption for studios that depend on streamlined workflows. The automation of 3D asset generation relies on a standardized post-processing pipeline that AI-generated assets currently lack, and the outputs are often far from ideal and require substantial manual work before they can be used as assets for exports.
Opportunities
Integration of AI-generated 3D Asset Tools with Low-Code/No-Code Platforms Opens Up New User Bases Beyond Traditional 3D Designers
The rise of low-code and no-code platforms are emerging to enable even non-technical users, such as marketers, educators, even small businesses or DIY able end users to use 3D tools generated by AI. Such interfaces that are easy to use let us create 3D assets through text prompts, sketches, or even voice commands. This has opened access to a larger pool of people beyond professional designers, creating new markets and demand for models that are smart, interoperable and deployable. The strength of code-free ecosystems to boost the growth of 3D asset market driven by trends in creative workflow integration of AI, independent creator enablement and training is shown.
NVIDIA introduced NIM microservices for RTX AI PCs, enabling low-code GUIs such as AnythingLLM, ComfyUI, and Langflow to access generative AI including 3D creation via simple graphical interfaces. Yahaha Studios, a no-code 3D game development platform, now supports immersive content creation with over 100,000 developers and more than 200,000 registered users.
Challenges:
Concerns Over Copyright, Originality, and Intellectual Property Rights of AI-Generated Assets Pose Regulatory and Legal Uncertainties
The rise of 3D content generated by AI has important legal implications regarding ownership, originality, and potential copyright infringement. As AI models rely on large datasets for training, they risk unintentionally reproducing protected designs, which can lead to litigation if used commercially. However, machines are corralled by emblematic intellectual property laws that merely peripherally elucidate what should happen with outputs they generate, leaving creators, AI purveyors, and patrons out on a limb. Attribution and licensing disputes are an extra layer of complication. Without comprehensive global laws, these issues will not only remain, but prevent the widespread, commercial, and creative use of AI-generated 3D assets on a large scale.
By Component
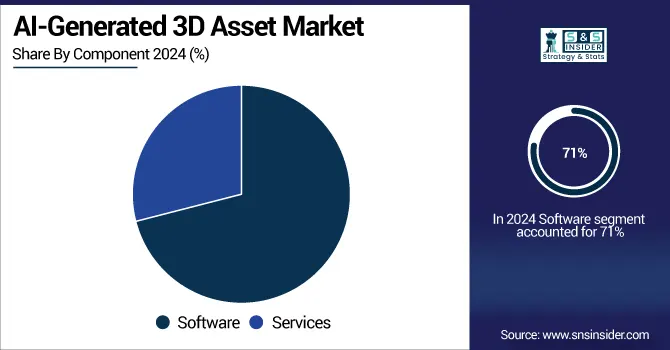
Software segment dominated the AI-Generated 3D Asset Market with the highest revenue share of about 71% in 2024 due to its essential role in asset creation, customization, and integration into design workflows. The rise of generative AI platforms and plug-ins has driven wide adoption among developers, studios, and designers, enabling scalable and automated production of high-quality 3D models across gaming, AR/VR, and animation pipelines.
Services segment is expected to grow at the fastest CAGR of about 25.68% over 2025–2032, fueled by rising demand for asset customization, integration support, and cloud-based rendering services. As more businesses adopt AI-generated 3D solutions, the need for consulting, training, and model optimization services has grown significantly. Outsourcing asset development and real-time support further accelerates the expansion of service-based offerings in this market.
By Application
Gaming segment dominated the AI-Generated 3D Asset Market with the highest revenue share of about 34% in 2024 due to its high consumption of 3D characters, props and environments. AI becomes an indispensable tool for game developers aiming to create scalable, high-quality, immersive, and cost-effective open-world and mobile game content at scale, which leads to enhanced productivity and shorter development windows within the AAA, Indie, and mobile game ecosystems.
Augmented Reality segment is expected to grow at the fastest CAGR of about 28.12% over 2025–2032, owing to the increasing adoption of AR in training, retail, healthcare, and social media. As AR devices require lightweight and real-time 3D models, AI-generated assets are indispensable. Artificial Intelligence is allowing for quick asset creation and customization, which is enabling dynamic AR content delivery on smartphones, wearables, and headsets.
By End-User
Media & Entertainment segment dominated the AI-Generated 3D Asset Market with the highest revenue share of about 32% in 2024 due to its continuous demand for animated characters, cinematic environments, and visual effects. Studios and content creators leverage AI to streamline production pipelines, reduce post-production costs, and generate hyper-realistic 3D elements, supporting films, streaming content, and virtual production workflows.
E-commerce segment is expected to grow at the fastest CAGR of about 28.52% over 2025–2032, owing to the growing employment of 3D product visualization, AR try-ons, and virtual showrooms. Still, for retailers, AI-generated assets help digitize their huge catalogues at Jet-speed, improve the online shopping experience while assisting in reducing product returns.
By Asset Type
Characters segment dominated the AI-Generated 3D Asset Market share of about 33% in 2024 owing to its extensive usage in games, films, and simulations. Characters are central to story and gameplay for games and interactive media, and AI enables the rapid generation of diverse, expressive, avatar characters that are ready for animation. The popularity of AI-character assets remains robust as demand for virtual influencers, NPCs, and digital humans continues.
Environments segment is expected to grow at the fastest CAGR of about 26.16% over 2025–2032, owing to the high demand for procedurally generated landscapes, cityscapes, and interiors across gaming, simulations, and virtual worlds. This allows for effortlessly scaling up in complex environments maintaining a consistent style and level of detail, creating an immersive experience for the user while saving on manual resources in metaverse, training, and architectural applications.
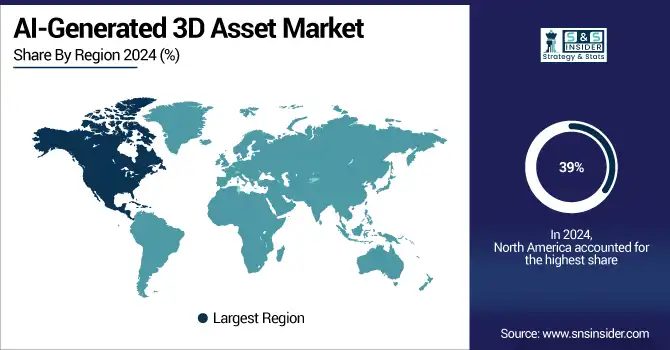
North America dominated the AI-Generated 3D Asset Market with the highest revenue share of about 39% in 2024, owing to the strong presence of several leading tech companies, gaming studios, and media producers. High investment in AI R&D, an early adopter mentality to advanced 3D tools and a matured digital infrastructure helps the region drive the rapid integration of AI-generated content across the entertainment, simulation, and virtual production industries.
The U.S. is dominating the AI-generated 3D asset market due to its advanced tech ecosystem, major industry players, and high AI investment levels.
Asia Pacific is expected to grow at the fastest CAGR of about 26.26% over 2025–2032, driven by rapid regional digitization and increasing applications of 3D technologies in education and retail. The investment in AI innovation, development of 3D content by the creation of immersive content in various countries, such as China, Japan, South Korea, and India, and a growing base of creators and mobile-first users are escalating demand for automated 3D asset generation.
China is dominating the AI-generated 3D asset market in Asia Pacific due to its massive gaming industry, strong AI innovation, and government-backed digital initiatives.
Europe is emerging as a significant player in the AI-generated 3D asset market, driven by advancements in gaming, automotive design, and virtual production. Countries such as Germany, France, and the U.K. are investing in AI to enhance creative and industrial applications.
Germany is dominating the AI-generated 3D asset market in Europe due to its strong industrial base, advanced R&D, and robust digital transformation initiatives.
AI-generated 3D asset market trends in the Middle East & Africa and Latin America show rising demand driven by digital economy growth, gaming adoption, and immersive tech investments, with local startups embracing generative AI for accessible, regionally tailored 3D content creation.
AI-Generated 3D Asset Market companies are Epic Games (Unreal Engine), Unity Technologies, Adobe (Substance 3D, Mixamo), Autodesk, NVIDIA, OpenAI, Google (Google Research, DeepMind), Meta (Facebook Reality Labs), Microsoft (Azure AI, Microsoft Mesh), Alibaba DAMO Academy, Luma AI, Kaedim, Sloyd, Scenario, Promethean AI, Reallusion, CGTrader, TurboSquid (by Shutterstock), Meshy, and Didimo.
2025: NVIDIA at COMPUTEX unveiled an Omniverse Blueprint for AI factory digital twins supporting OpenUSD schemas for simulating AI‑factory assets integrating power, cooling, networking in digital twins.
2024: Autodesk unveiled Project Bernini (May 2024), an experimental generative AI model that creates multiple functional 3D shapes from inputs such as images, text, voxels, and point clouds.
2023: Unity introduced a dedicated AI Marketplace within the Unity Asset Store, centralizing curated AI tools and assets that accelerate AI‑driven game development and real‑time 3D workflows
Report Attributes | Details |
---|---|
Market Size in 2024 | USD 1.63 Billion |
Market Size by 2032 | USD 9.24 Billion |
CAGR | CAGR of 24.29% From 2025 to 2032 |
Base Year | 2024 |
Forecast Period | 2025-2032 |
Historical Data | 2021-2023 |
Report Scope & Coverage | Market Size, Segments Analysis, Competitive Landscape, Regional Analysis, DROC & SWOT Analysis, Forecast Outlook |
Key Segments | • By Component (Software, Services) • By Asset Type (Characters, Environments, Props, Textures, Others) • By Application (Gaming, Film & Animation, Architecture, E-commerce, Virtual Reality, Augmented Reality, Others) • By Deployment Mode (Cloud, On-Premises) • By End-User (Media & Entertainment, Gaming, Architecture & Design, E-commerce, Education, Others) |
Regional Analysis/Coverage | North America (US, Canada), Europe (Germany, UK, France, Italy, Spain, Russia, Poland, Rest of Europe), Asia Pacific (China, India, Japan, South Korea, Australia, ASEAN Countries, Rest of Asia Pacific), Middle East & Africa (UAE, Saudi Arabia, Qatar, South Africa, Rest of Middle East & Africa), Latin America (Brazil, Argentina, Mexico, Colombia, Rest of Latin America). |
Company Profiles | Epic Games (Unreal Engine), Unity Technologies, Adobe (Substance 3D, Mixamo), Autodesk, NVIDIA, OpenAI, Google (Google Research, DeepMind), Meta (Facebook Reality Labs), Microsoft (Azure AI, Microsoft Mesh), Alibaba DAMO Academy, Luma AI, Kaedim, Sloyd, Scenario, Promethean AI, Reallusion, CGTrader, TurboSquid (by Shutterstock), Meshy, Didimo |
Ans: The AI-Generated 3D Asset Market is expected to grow at a CAGR of 24.29% from 2025 to 2032, driven by rising global adoption.
Ans: In 2024, the AI-Generated 3D Asset Market was valued at USD 1.63 billion, reflecting increasing demand across gaming, film, and design sectors.
Ans: The major growth driver is rising demand for real-time, high-quality 3D content across gaming, AR/VR, metaverse, and virtual simulation industries.
Ans: The Software segment dominated the market in 2024 with a 71% revenue share, due to its core role in content creation and customization.
Ans: North America dominated the market in 2024 with a 39% share, led by strong AI R&D and a thriving gaming and media industry.
Table Of Contents
1. Introduction
1.1 Market Definition & Scope
1.2 Research Assumptions & Abbreviations
1.3 Research Methodology
2. Executive Summary
2.1 Market Snapshot
2.2 Market Absolute $ Opportunity Assessment & Y-o-Y Analysis, 2021–2032
2.3 Market Size & Forecast, By Segmentation, 2021–2032
2.3.1 Market Size By Component
2.3.2 Market Size By Application
2.3.1 Market Size By Asset Type
2.3.2 Market Size By Deployment Mode
2.3.1 Market Size By End-User
2.4 Market Share & Bps Analysis By Region, 2024
2.5 Industry Growth Scenarios – Conservative, Likely & Optimistic
2.6 Industry CxO’s Perspective
3. Market Overview
3.1 Market Dynamics
3.1.1 Drivers
3.1.2 Restraints
3.1.3 Opportunities
3.1.4 Key Market Trends
3.2 Industry PESTLE Analysis
3.3 Key Industry Forces (Porter’s) Impacting Market Growth
3.4 Industry Supply Chain Analysis
3.4.1 Raw Material Suppliers
3.4.2 Manufacturers
3.4.3 Distributors/Suppliers
3.4.4 Customers/End-Users
3.5 Industry Life Cycle Assessment
3.6 Parent Market Overview
3.7 Market Risk Assessment
4. Statistical Insights & Trends Reporting
4.1 Investment & Funding Trends
4.1.1 Overview
4.1.2 Total VC/Private Equity Investment (USD Million)
4.1.3 Top Funded Startups and Their Investment Rounds
4.1.4 R&D Spending as % of Revenue by Key Players
4.2 Consumer/Studio Usage Statistics
4.2.1 Overview
4.2.2 % of Studios Using AI Tools in 3D Asset Creation
4.2.3 Average Time Saved per Asset Using AI (in Hours & %)
4.2.4 Preference Rate of AI Over Manual Asset Creation (%)
4.3 Content Type & Output Statistics
4.3.1 Overview
4.3.2 Average Number of Assets Generated by Leading Tools
4.3.3 Distribution of AI-Generated Assets by Type (%)
4.4 Productivity & Efficiency Gains
4.4.1 Overview
4.4.2 Reduction in Production Time Due to AI (%)
4.4.3 Cost Reduction per Asset (USD & %)
4.4.4 Increase in Asset Turnaround Speed (%)
4.5 Licensing & Marketplace Statistics
4.5.1 Overview
4.5.2 Number of AI-Generated Assets Sold on Top Marketplaces
4.5.3 Average Price of AI-Generated Asset (USD)
4.5.4 Revenue Share for Creators vs. Platforms (%)
5. AI-Generated 3D Asset Market Segmental Analysis & Forecast, By Component, 2021 – 2032, Value (Usd Billion) & Volume (Number of Assets)
5.1 Introduction
5.2 Software
5.2.1 Key Trends
5.2.2 Market Size & Forecast, 2021 – 2032
5.3 Services
5.3.1 Key Trends
5.3.2 Market Size & Forecast, 2021 – 2032
6. AI-Generated 3D Asset Market Segmental Analysis & Forecast, By Application, 2021 – 2032, Value (USD Billion) & Volume (Number of Assets)
6.1 Introduction
6.2 Gaming
6.2.1 Key Trends
6.2.2 Market Size & Forecast, 2021 – 2032
6.3 Film & Animation
6.3.1 Key Trends
6.3.2 Market Size & Forecast, 2021 – 2032
6.4 Architecture
6.4.1 Key Trends
6.4.2 Market Size & Forecast, 2021 – 2032
6.5 E-commerce
6.5.1 Key Trends
6.5.2 Market Size & Forecast, 2021 – 2032
6.6 Virtual Reality
6.6.1 Key Trends
6.6.2 Market Size & Forecast, 2021 – 2032
6.7 Augmented Reality
6.7.1 Key Trends
6.7.2 Market Size & Forecast, 2021 – 2032
6.8 Others
6.8.1 Key Trends
6.8.2 Market Size & Forecast, 2021 – 2032
7. AI-Generated 3D Asset Market Segmental Analysis & Forecast, By Asset Type, 2021 – 2032, Value (USD Billion) & Volume (Number of Assets)
7.1 Introduction
7.2 Characters
7.2.1 Key Trends
7.2.2 Market Size & Forecast, 2021 – 2032
7.3 Environments
7.3.1 Key Trends
7.3.2 Market Size & Forecast, 2021 – 2032
7.4 Props
7.4.1 Key Trends
7.4.2 Market Size & Forecast, 2021 – 2032
7.5 Textures
7.5.1 Key Trends
7.5.2 Market Size & Forecast, 2021 – 2032
7.6 Others
7.6.1 Key Trends
7.6.2 Market Size & Forecast, 2021 – 2032
8. AI-Generated 3D Asset Market Segmental Analysis & Forecast, By End-User, 2021 – 2032, Value (USD Billion) & Volume (Number of Assets)
8.1 Introduction
8.2 Media & Entertainment
8.2.1 Key Trends
8.2.2 Market Size & Forecast, 2021 – 2032
8.3 Gaming
8.3.1 Key Trends
8.3.2 Market Size & Forecast, 2021 – 2032
8.4 Architecture & Design
8.4.1 Key Trends
8.4.2 Market Size & Forecast, 2021 – 2032
8.5 E-commerce
8.5.1 Key Trends
8.5.2 Market Size & Forecast, 2021 – 2032
8.6 Education
8.6.1 Key Trends
8.6.2 Market Size & Forecast, 2021 – 2032
8.7 Others
8.7.1 Key Trends
8.7.2 Market Size & Forecast, 2021 – 2032
9. AI-Generated 3D Asset Market Segmental Analysis & Forecast, By Deployment Mode, 2021 – 2032, Value (USD Billion) & Volume (Number of Assets)
9.1 Introduction
9.2 Cloud
9.2.1 Key Trends
9.2.2 Market Size & Forecast, 2021 – 2032
9.3 On-Premises
9.3.1 Key Trends
9.3.2 Market Size & Forecast, 2021 – 2032
10. AI-Generated 3D Asset Market Segmental Analysis & Forecast By Region, 2021 – 2032, Value (USD Billion) & Volume (Number of Assets)
10.1 Introduction
10.2 North America
10.2.1 Key Trends
10.2.2 AI-Generated 3D Asset Market Size & Forecast, By Component, 2021 – 2032
10.2.3 AI-Generated 3D Asset Market Size & Forecast, By Application, 2021 – 2032
10.2.4 AI-Generated 3D Asset Market Size & Forecast, By Asset Type, 2021 – 2032
10.2.5 AI-Generated 3D Asset Market Size & Forecast, By End-User, 2021 – 2032
10.2.6 AI-Generated 3D Asset Market Size & Forecast, By Deployment Mode, 2021 – 2032
10.2.7 AI-Generated 3D Asset Market Size & Forecast, By Country, 2021 – 2032
10.2.7.1 USA
10.2.7.1.1 AI-Generated 3D Asset Market Size & Forecast, By Component, 2021 – 2032
10.2.7.1.2 AI-Generated 3D Asset Market Size & Forecast, By Application, 2021 – 2032
10.2.7.1.3 AI-Generated 3D Asset Market Size & Forecast, By Asset Type, 2021 – 2032
10.2.7.1.4 AI-Generated 3D Asset Market Size & Forecast, By End-User, 2021 – 2032
10.2.7.1.5 AI-Generated 3D Asset Market Size & Forecast, By Deployment Mode, 2021 – 2032
10.2.7.2 Canada
10.2.7.2.1 AI-Generated 3D Asset Market Size & Forecast, By Component, 2021 – 2032
10.2.7.2.2 AI-Generated 3D Asset Market Size & Forecast, By Application, 2021 – 2032
10.2.7.2.3 AI-Generated 3D Asset Market Size & Forecast, By Asset Type, 2021 – 2032
10.2.7.2.4 AI-Generated 3D Asset Market Size & Forecast, By End-User, 2021 – 2032
10.2.7.2.5 AI-Generated 3D Asset Market Size & Forecast, By Deployment Mode, 2021 – 2032
10.3 Europe
10.3.1 Key Trends
10.3.2 AI-Generated 3D Asset Market Size & Forecast, By Component, 2021 – 2032
10.3.3 AI-Generated 3D Asset Market Size & Forecast, By Application, 2021 – 2032
10.3.4 AI-Generated 3D Asset Market Size & Forecast, By Asset Type, 2021 – 2032
10.3.5 AI-Generated 3D Asset Market Size & Forecast, By End-User, 2021 – 2032
10.3.6 AI-Generated 3D Asset Market Size & Forecast, By Deployment Mode, 2021 – 2032
10.3.7 AI-Generated 3D Asset Market Size & Forecast, By Country, 2021 – 2032
10.3.7.1 Germany
10.3.7.1.1 AI-Generated 3D Asset Market Size & Forecast, By Component, 2021 – 2032
10.3.7.1.2 AI-Generated 3D Asset Market Size & Forecast, By Application, 2021 – 2032
10.3.7.1.3 AI-Generated 3D Asset Market Size & Forecast, By Asset Type, 2021 – 2032
10.3.7.1.4 AI-Generated 3D Asset Market Size & Forecast, By End-User, 2021 – 2032
10.3.7.1.5 AI-Generated 3D Asset Market Size & Forecast, By Deployment Mode, 2021 – 2032
10.3.7.2 UK
10.3.7.2.1 AI-Generated 3D Asset Market Size & Forecast, By Component, 2021 – 2032
10.3.7.2.2 AI-Generated 3D Asset Market Size & Forecast, By Application, 2021 – 2032
10.3.7.2.3 AI-Generated 3D Asset Market Size & Forecast, By Asset Type, 2021 – 2032
10.3.7.2.4 AI-Generated 3D Asset Market Size & Forecast, By End-User, 2021 – 2032
10.3.7.2.5 AI-Generated 3D Asset Market Size & Forecast, By Deployment Mode, 2021 – 2032
10.3.7.3 France
10.3.7.3.1 AI-Generated 3D Asset Market Size & Forecast, By Component, 2021 – 2032
10.3.7.3.2 AI-Generated 3D Asset Market Size & Forecast, By Application, 2021 – 2032
10.3.7.3.3 AI-Generated 3D Asset Market Size & Forecast, By Asset Type, 2021 – 2032
10.3.7.3.4 AI-Generated 3D Asset Market Size & Forecast, By End-User, 2021 – 2032
10.3.7.3.5 AI-Generated 3D Asset Market Size & Forecast, By Deployment Mode, 2021 – 2032
10.3.7.4 Italy
10.3.7.4.1 AI-Generated 3D Asset Market Size & Forecast, By Component, 2021 – 2032
10.3.7.4.2 AI-Generated 3D Asset Market Size & Forecast, By Application, 2021 – 2032
10.3.7.4.3 AI-Generated 3D Asset Market Size & Forecast, By Asset Type, 2021 – 2032
10.3.7.4.4 AI-Generated 3D Asset Market Size & Forecast, By End-User, 2021 – 2032
10.3.7.4.5 AI-Generated 3D Asset Market Size & Forecast, By Deployment Mode, 2021 – 2032
10.3.7.5 Spain
10.3.7.5.1 AI-Generated 3D Asset Market Size & Forecast, By Component, 2021 – 2032
10.3.7.5.2 AI-Generated 3D Asset Market Size & Forecast, By Application, 2021 – 2032
10.3.7.5.3 AI-Generated 3D Asset Market Size & Forecast, By Asset Type, 2021 – 2032
10.3.7.5.4 AI-Generated 3D Asset Market Size & Forecast, By End-User, 2021 – 2032
10.3.7.5.5 AI-Generated 3D Asset Market Size & Forecast, By Deployment Mode, 2021 – 2032
10.3.7.6 Russia
10.3.7.6.1 AI-Generated 3D Asset Market Size & Forecast, By Component, 2021 – 2032
10.3.7.6.2 AI-Generated 3D Asset Market Size & Forecast, By Application, 2021 – 2032
10.3.7.6.3 AI-Generated 3D Asset Market Size & Forecast, By Asset Type, 2021 – 2032
10.3.7.6.4 AI-Generated 3D Asset Market Size & Forecast, By End-User, 2021 – 2032
10.3.7.6.5 AI-Generated 3D Asset Market Size & Forecast, By Deployment Mode, 2021 – 2032
10.3.7.7 Poland
10.3.7.7.1 AI-Generated 3D Asset Market Size & Forecast, By Component, 2021 – 2032
10.3.7.7.2 AI-Generated 3D Asset Market Size & Forecast, By Application, 2021 – 2032
10.3.7.7.3 AI-Generated 3D Asset Market Size & Forecast, By Asset Type, 2021 – 2032
10.3.7.7.4 AI-Generated 3D Asset Market Size & Forecast, By End-User, 2021 – 2032
10.3.7.7.5 AI-Generated 3D Asset Market Size & Forecast, By Deployment Mode, 2021 – 2032
10.3.7.8 Rest of Europe
10.3.7.8.1 AI-Generated 3D Asset Market Size & Forecast, By Component, 2021 – 2032
10.3.7.8.2 AI-Generated 3D Asset Market Size & Forecast, By Application, 2021 – 2032
10.3.7.8.3 AI-Generated 3D Asset Market Size & Forecast, By Asset Type, 2021 – 2032
10.3.7.8.4 AI-Generated 3D Asset Market Size & Forecast, By End-User, 2021 – 2032
10.3.7.8.5 AI-Generated 3D Asset Market Size & Forecast, By Deployment Mode, 2021 – 2032
10.4 Asia-Pacific
10.4.1 Key Trends
10.4.2 AI-Generated 3D Asset Market Size & Forecast, By Component, 2021 – 2032
10.4.3 AI-Generated 3D Asset Market Size & Forecast, By Application, 2021 – 2032
10.4.4 AI-Generated 3D Asset Market Size & Forecast, By Asset Type, 2021 – 2032
10.4.5 AI-Generated 3D Asset Market Size & Forecast, By End-User, 2021 – 2032
10.4.6 AI-Generated 3D Asset Market Size & Forecast, By Deployment Mode, 2021 – 2032
10.4.7 AI-Generated 3D Asset Market Size & Forecast, By Country, 2021 – 2032
10.4.7.1 China
10.4.7.1.1 AI-Generated 3D Asset Market Size & Forecast, By Component, 2021 – 2032
10.4.7.1.2 AI-Generated 3D Asset Market Size & Forecast, By Application, 2021 – 2032
10.4.7.1.3 AI-Generated 3D Asset Market Size & Forecast, By Asset Type, 2021 – 2032
10.4.7.1.4 AI-Generated 3D Asset Market Size & Forecast, By End-User, 2021 – 2032
10.4.7.1.5 AI-Generated 3D Asset Market Size & Forecast, By Deployment Mode, 2021 – 2032
10.4.7.2 India
10.4.7.2.1 AI-Generated 3D Asset Market Size & Forecast, By Component, 2021 – 2032
10.4.7.2.2 AI-Generated 3D Asset Market Size & Forecast, By Application, 2021 – 2032
10.4.7.2.3 AI-Generated 3D Asset Market Size & Forecast, By Asset Type, 2021 – 2032
10.4.7.2.4 AI-Generated 3D Asset Market Size & Forecast, By End-User, 2021 – 2032
10.4.7.2.5 AI-Generated 3D Asset Market Size & Forecast, By Deployment Mode, 2021 – 2032
10.4.7.3 Japan
10.4.7.3.1 AI-Generated 3D Asset Market Size & Forecast, By Component, 2021 – 2032
10.4.7.3.2 AI-Generated 3D Asset Market Size & Forecast, By Application, 2021 – 2032
10.4.7.3.3 AI-Generated 3D Asset Market Size & Forecast, By Asset Type, 2021 – 2032
10.4.7.3.4 AI-Generated 3D Asset Market Size & Forecast, By End-User, 2021 – 2032
10.4.7.3.5 AI-Generated 3D Asset Market Size & Forecast, By Deployment Mode, 2021 – 2032
10.4.7.4 South Korea
10.4.7.4.1 AI-Generated 3D Asset Market Size & Forecast, By Component, 2021 – 2032
10.4.7.4.2 AI-Generated 3D Asset Market Size & Forecast, By Application, 2021 – 2032
10.4.7.4.3 AI-Generated 3D Asset Market Size & Forecast, By Asset Type, 2021 – 2032
10.4.7.4.4 AI-Generated 3D Asset Market Size & Forecast, By End-User, 2021 – 2032
10.4.7.4.5 AI-Generated 3D Asset Market Size & Forecast, By Deployment Mode, 2021 – 2032
10.4.7.5 Australia
10.4.7.5.1 AI-Generated 3D Asset Market Size & Forecast, By Component, 2021 – 2032
10.4.7.5.2 AI-Generated 3D Asset Market Size & Forecast, By Application, 2021 – 2032
10.4.7.5.3 AI-Generated 3D Asset Market Size & Forecast, By Asset Type, 2021 – 2032
10.4.7.5.4 AI-Generated 3D Asset Market Size & Forecast, By End-User, 2021 – 2032
10.4.7.5.5 AI-Generated 3D Asset Market Size & Forecast, By Deployment Mode, 2021 – 2032
10.4.7.6 ASEAN Countries
10.4.7.6.1 AI-Generated 3D Asset Market Size & Forecast, By Component, 2021 – 2032
10.4.7.6.2 AI-Generated 3D Asset Market Size & Forecast, By Application, 2021 – 2032
10.4.7.6.3 AI-Generated 3D Asset Market Size & Forecast, By Asset Type, 2021 – 2032
10.4.7.6.4 AI-Generated 3D Asset Market Size & Forecast, By End-User, 2021 – 2032
10.4.7.6.5 AI-Generated 3D Asset Market Size & Forecast, By Deployment Mode, 2021 – 2032
10.4.7.7 Rest of Asia-Pacific
10.4.7.7.1 AI-Generated 3D Asset Market Size & Forecast, By Component, 2021 – 2032
10.4.7.7.2 AI-Generated 3D Asset Market Size & Forecast, By Application, 2021 – 2032
10.4.7.7.3 AI-Generated 3D Asset Market Size & Forecast, By Asset Type, 2021 – 2032
10.4.7.7.4 AI-Generated 3D Asset Market Size & Forecast, By End-User, 2021 – 2032
10.4.7.7.5 AI-Generated 3D Asset Market Size & Forecast, By Deployment Mode, 2021 – 2032
10.5 Latin America
10.5.1 Key Trends
10.5.2 AI-Generated 3D Asset Market Size & Forecast, By Component, 2021 – 2032
10.5.3 AI-Generated 3D Asset Market Size & Forecast, By Application, 2021 – 2032
10.5.4 AI-Generated 3D Asset Market Size & Forecast, By Asset Type, 2021 – 2032
10.5.5 AI-Generated 3D Asset Market Size & Forecast, By End-User, 2021 – 2032
10.5.6 AI-Generated 3D Asset Market Size & Forecast, By Deployment Mode, 2021 – 2032
10.5.7 AI-Generated 3D Asset Market Size & Forecast, By Country, 2021 – 2032
10.5.7.1 Brazil
10.5.7.1.1 AI-Generated 3D Asset Market Size & Forecast, By Component, 2021 – 2032
10.5.7.1.2 AI-Generated 3D Asset Market Size & Forecast, By Application, 2021 – 2032
10.5.7.1.3 AI-Generated 3D Asset Market Size & Forecast, By Asset Type, 2021 – 2032
10.5.7.1.4 AI-Generated 3D Asset Market Size & Forecast, By End-User, 2021 – 2032
10.5.7.1.5 AI-Generated 3D Asset Market Size & Forecast, By Deployment Mode, 2021 – 2032
10.5.7.2 Argentina
10.5.7.2.1 AI-Generated 3D Asset Market Size & Forecast, By Component, 2021 – 2032
10.5.7.2.2 AI-Generated 3D Asset Market Size & Forecast, By Application, 2021 – 2032
10.5.7.2.3 AI-Generated 3D Asset Market Size & Forecast, By Asset Type, 2021 – 2032
10.5.7.2.4 AI-Generated 3D Asset Market Size & Forecast, By End-User, 2021 – 2032
10.5.7.2.5 AI-Generated 3D Asset Market Size & Forecast, By Deployment Mode, 2021 – 2032
10.5.7.3 Mexico
10.5.7.3.1 AI-Generated 3D Asset Market Size & Forecast, By Component, 2021 – 2032
10.5.7.3.2 AI-Generated 3D Asset Market Size & Forecast, By Application, 2021 – 2032
10.5.7.3.3 AI-Generated 3D Asset Market Size & Forecast, By Asset Type, 2021 – 2032
10.5.7.3.4 AI-Generated 3D Asset Market Size & Forecast, By End-User, 2021 – 2032
10.5.7.3.5 AI-Generated 3D Asset Market Size & Forecast, By Deployment Mode, 2021 – 2032
10.5.7.4 Colombia
10.5.7.4.1 AI-Generated 3D Asset Market Size & Forecast, By Component, 2021 – 2032
10.5.7.4.2 AI-Generated 3D Asset Market Size & Forecast, By Application, 2021 – 2032
10.5.7.4.3 AI-Generated 3D Asset Market Size & Forecast, By Asset Type, 2021 – 2032
10.5.7.4.4 AI-Generated 3D Asset Market Size & Forecast, By End-User, 2021 – 2032
10.5.7.4.5 AI-Generated 3D Asset Market Size & Forecast, By Deployment Mode, 2021 – 2032
10.5.7.5 Rest of Latin America
10.5.7.5.1 AI-Generated 3D Asset Market Size & Forecast, By Component, 2021 – 2032
10.5.7.5.2 AI-Generated 3D Asset Market Size & Forecast, By Application, 2021 – 2032
10.5.7.5.3 AI-Generated 3D Asset Market Size & Forecast, By Asset Type, 2021 – 2032
10.5.7.5.4 AI-Generated 3D Asset Market Size & Forecast, By End-User, 2021 – 2032
10.5.7.5.5 AI-Generated 3D Asset Market Size & Forecast, By Deployment Mode, 2021 – 2032
10.6 Middle East & Africa
10.6.1 Key Trends
10.6.2 AI-Generated 3D Asset Market Size & Forecast, By Component, 2021 – 2032
10.6.3 AI-Generated 3D Asset Market Size & Forecast, By Application, 2021 – 2032
10.6.4 AI-Generated 3D Asset Market Size & Forecast, By Asset Type, 2021 – 2032
10.6.5 AI-Generated 3D Asset Market Size & Forecast, By End-User, 2021 – 2032
10.6.6 AI-Generated 3D Asset Market Size & Forecast, By Deployment Mode, 2021 – 2032
10.6.7 AI-Generated 3D Asset Market Size & Forecast, By Country, 2021 – 2032
10.6.7.1 UAE
10.6.7.1.1 AI-Generated 3D Asset Market Size & Forecast, By Component, 2021 – 2032
10.6.7.1.2 AI-Generated 3D Asset Market Size & Forecast, By Application, 2021 – 2032
10.6.7.1.3 AI-Generated 3D Asset Market Size & Forecast, By Asset Type, 2021 – 2032
10.6.7.1.4 AI-Generated 3D Asset Market Size & Forecast, By End-User, 2021 – 2032
10.6.7.1.5 AI-Generated 3D Asset Market Size & Forecast, By Deployment Mode, 2021 – 2032
10.6.7.2 Saudi Arabia
10.6.7.2.1 AI-Generated 3D Asset Market Size & Forecast, By Component, 2021 – 2032
10.6.7.2.2 AI-Generated 3D Asset Market Size & Forecast, By Application, 2021 – 2032
10.6.7.2.3 AI-Generated 3D Asset Market Size & Forecast, By Asset Type, 2021 – 2032
10.6.7.2.4 AI-Generated 3D Asset Market Size & Forecast, By End-User, 2021 – 2032
10.6.7.2.5 AI-Generated 3D Asset Market Size & Forecast, By Deployment Mode, 2021 – 2032
10.6.7.3 Qatar
10.6.7.3.1 AI-Generated 3D Asset Market Size & Forecast, By Component, 2021 – 2032
10.6.7.3.2 AI-Generated 3D Asset Market Size & Forecast, By Application, 2021 – 2032
10.6.7.3.3 AI-Generated 3D Asset Market Size & Forecast, By Asset Type, 2021 – 2032
10.6.7.3.4 AI-Generated 3D Asset Market Size & Forecast, By End-User, 2021 – 2032
10.6.7.3.5 AI-Generated 3D Asset Market Size & Forecast, By Deployment Mode, 2021 – 2032
10.6.7.4 Egypt
10.6.7.4.1 AI-Generated 3D Asset Market Size & Forecast, By Component, 2021 – 2032
10.6.7.4.2 AI-Generated 3D Asset Market Size & Forecast, By Application, 2021 – 2032
10.6.7.4.3 AI-Generated 3D Asset Market Size & Forecast, By Asset Type, 2021 – 2032
10.6.7.4.4 AI-Generated 3D Asset Market Size & Forecast, By End-User, 2021 – 2032
10.6.7.4.5 AI-Generated 3D Asset Market Size & Forecast, By Deployment Mode, 2021 – 2032
10.6.7.5 South Africa
10.6.7.5.1 AI-Generated 3D Asset Market Size & Forecast, By Component, 2021 – 2032
10.6.7.5.2 AI-Generated 3D Asset Market Size & Forecast, By Application, 2021 – 2032
10.6.7.5.3 AI-Generated 3D Asset Market Size & Forecast, By Asset Type, 2021 – 2032
10.6.7.5.4 AI-Generated 3D Asset Market Size & Forecast, By End-User, 2021 – 2032
10.6.7.5.5 AI-Generated 3D Asset Market Size & Forecast, By Deployment Mode, 2021 – 2032
10.6.7.6 Rest of Middle East & Africa
10.6.7.6.1 AI-Generated 3D Asset Market Size & Forecast, By Component, 2021 – 2032
10.6.7.6.2 AI-Generated 3D Asset Market Size & Forecast, By Application, 2021 – 2032
10.6.7.6.3 AI-Generated 3D Asset Market Size & Forecast, By Asset Type, 2021 – 2032
10.6.7.6.4 AI-Generated 3D Asset Market Size & Forecast, By End-User, 2021 – 2032
10.6.7.6.5 AI-Generated 3D Asset Market Size & Forecast, By Deployment Mode, 2021 – 2032
11. Competitive Landscape
11.1 Key Players' Positioning
11.2 Competitive Developments
11.2.1 Key Strategies Adopted (%), By Key Players, 2024
11.2.2 Year-Wise Strategies & Development, 2021 – 2025
11.2.3 Number Of Strategies Adopted By Key Players, 2024
11.3 Market Share Analysis, 2024
11.4 Product/Service & Application Benchmarking
11.4.1 Product/Service Specifications & Features By Key Players
11.4.2 Product/Service Heatmap By Key Players
11.4.3 Application Heatmap By Key Players
11.5 Industry Start-Up & Innovation Landscape
11.6 Key Company Profiles
11.6.1 Epic Games (Unreal Engine)
11.6.1.1 Company Overview & Snapshot
11.6.1.2 Product/Service Portfolio
11.6.1.3 Key Company Financials
11.6.1.4 SWOT Analysis
11.6.2 Unity Technologies
11.6.2.1 Company Overview & Snapshot
11.6.2.2 Product/Service Portfolio
11.6.2.3 Key Company Financials
11.6.2.4 SWOT Analysis
11.6.3 Adobe (Substance 3D, Mixamo)
11.6.3.1 Company Overview & Snapshot
11.6.3.2 Product/Service Portfolio
11.6.3.3 Key Company Financials
11.6.3.4 SWOT Analysis
11.6.4 Autodesk
11.6.4.1 Company Overview & Snapshot
11.6.4.2 Product/Service Portfolio
11.6.4.3 Key Company Financials
11.6.4.4 SWOT Analysis
11.6.5 NVIDIA
11.6.5.1 Company Overview & Snapshot
11.6.5.2 Product/Service Portfolio
11.6.5.3 Key Company Financials
11.6.5.4 SWOT Analysis
11.6.6 OpenAI
11.6.6.1 Company Overview & Snapshot
11.6.6.2 Product/Service Portfolio
11.6.6.3 Key Company Financials
11.6.6.4 SWOT Analysis
11.6.7 Google (Google Research, DeepMind)
11.6.7.1 Company Overview & Snapshot
11.6.7.2 Product/Service Portfolio
11.6.7.3 Key Company Financials
11.6.7.4 SWOT Analysis
11.6.8 Meta (Facebook Reality Labs)
11.6.8.1 Company Overview & Snapshot
11.6.8.2 Product/Service Portfolio
11.6.8.3 Key Company Financials
11.6.8.4 SWOT Analysis
11.6.9 Microsoft (Azure AI, Microsoft Mesh)
11.6.9.1 Company Overview & Snapshot
11.6.9.2 Product/Service Portfolio
11.6.9.3 Key Company Financials
11.6.9.4 SWOT Analysis
11.6.10 Alibaba DAMO Academy
11.6.10.1 Company Overview & Snapshot
11.6.10.2 Product/Service Portfolio
11.6.10.3 Key Company Financials
11.6.10.4 SWOT Analysis
11.6.11 Luma AI
11.6.11.1 Company Overview & Snapshot
11.6.11.2 Product/Service Portfolio
11.6.11.3 Key Company Financials
11.6.11.4 SWOT Analysis
11.6.12 Kaedim
11.6.12.1 Company Overview & Snapshot
11.6.12.2 Product/Service Portfolio
11.6.12.3 Key Company Financials
11.6.12.4 SWOT Analysis
11.6.13 Sloyd
11.6.13.1 Company Overview & Snapshot
11.6.13.2 Product/Service Portfolio
11.6.13.3 Key Company Financials
11.6.13.4 SWOT Analysis
11.6.14 Scenario
11.6.14.1 Company Overview & Snapshot
11.6.14.2 Product/Service Portfolio
11.6.14.3 Key Company Financials
11.6.14.4 SWOT Analysis
11.6.15 Promethean AI
11.6.15.1 Company Overview & Snapshot
11.6.15.2 Product/Service Portfolio
11.6.15.3 Key Company Financials
11.6.15.4 SWOT Analysis
11.6.16 Reallusion
11.6.16.1 Company Overview & Snapshot
11.6.16.2 Product/Service Portfolio
11.6.16.3 Key Company Financials
11.6.16.4 SWOT Analysis
11.6.17 CGTrader
11.6.17.1 Company Overview & Snapshot
11.6.17.2 Product/Service Portfolio
11.6.17.3 Key Company Financials
11.6.17.4 SWOT Analysis
11.6.18 TurboSquid (by Shutterstock)
11.6.18.1 Company Overview & Snapshot
11.6.18.2 Product/Service Portfolio
11.6.18.3 Key Company Financials
11.6.18.4 SWOT Analysis
11.6.19 Meshy
11.6.19.1 Company Overview & Snapshot
11.6.19.2 Product/Service Portfolio
11.6.19.3 Key Company Financials
11.6.19.4 SWOT Analysis
11.6.20 Didimo
11.6.20.1 Company Overview & Snapshot
11.6.20.2 Product/Service Portfolio
11.6.20.3 Key Company Financials
11.6.20.4 SWOT Analysis
12. Analyst Recommendations
12.1 SNS Insider Opportunity Map
12.2 Industry Low-Hanging Fruit Assessment
12.3 Market Entry & Growth Strategy
12.4 Analyst Viewpoint & Suggestions On Market Growth
13. Assumptions
14. Disclaimer
15. Appendix
15.1 List Of Tables
15.2 List Of Figures
An accurate research report requires proper strategizing as well as implementation. There are multiple factors involved in the completion of good and accurate research report and selecting the best methodology to compete the research is the toughest part. Since the research reports we provide play a crucial role in any company’s decision-making process, therefore we at SNS Insider always believe that we should choose the best method which gives us results closer to reality. This allows us to reach at a stage wherein we can provide our clients best and accurate investment to output ratio.
Each report that we prepare takes a timeframe of 350-400 business hours for production. Starting from the selection of titles through a couple of in-depth brain storming session to the final QC process before uploading our titles on our website we dedicate around 350 working hours. The titles are selected based on their current market cap and the foreseen CAGR and growth.
The 5 steps process:
Step 1: Secondary Research:
Secondary Research or Desk Research is as the name suggests is a research process wherein, we collect data through the readily available information. In this process we use various paid and unpaid databases which our team has access to and gather data through the same. This includes examining of listed companies’ annual reports, Journals, SEC filling etc. Apart from this our team has access to various associations across the globe across different industries. Lastly, we have exchange relationships with various university as well as individual libraries.
Step 2: Primary Research
When we talk about primary research, it is a type of study in which the researchers collect relevant data samples directly, rather than relying on previously collected data. This type of research is focused on gaining content specific facts that can be sued to solve specific problems. Since the collected data is fresh and first hand therefore it makes the study more accurate and genuine.
We at SNS Insider have divided Primary Research into 2 parts.
Part 1 wherein we interview the KOLs of major players as well as the upcoming ones across various geographic regions. This allows us to have their view over the market scenario and acts as an important tool to come closer to the accurate market numbers. As many as 45 paid and unpaid primary interviews are taken from both the demand and supply side of the industry to make sure we land at an accurate judgement and analysis of the market.
This step involves the triangulation of data wherein our team analyses the interview transcripts, online survey responses and observation of on filed participants. The below mentioned chart should give a better understanding of the part 1 of the primary interview.
Part 2: In this part of primary research the data collected via secondary research and the part 1 of the primary research is validated with the interviews from individual consultants and subject matter experts.
Consultants are those set of people who have at least 12 years of experience and expertise within the industry whereas Subject Matter Experts are those with at least 15 years of experience behind their back within the same space. The data with the help of two main processes i.e., FGDs (Focused Group Discussions) and IDs (Individual Discussions). This gives us a 3rd party nonbiased primary view of the market scenario making it a more dependable one while collation of the data pointers.
Step 3: Data Bank Validation
Once all the information is collected via primary and secondary sources, we run that information for data validation. At our intelligence centre our research heads track a lot of information related to the market which includes the quarterly reports, the daily stock prices, and other relevant information. Our data bank server gets updated every fortnight and that is how the information which we collected using our primary and secondary information is revalidated in real time.
Step 4: QA/QC Process
After all the data collection and validation our team does a final level of quality check and quality assurance to get rid of any unwanted or undesired mistakes. This might include but not limited to getting rid of the any typos, duplication of numbers or missing of any important information. The people involved in this process include technical content writers, research heads and graphics people. Once this process is completed the title gets uploader on our platform for our clients to read it.
Step 5: Final QC/QA Process:
This is the last process and comes when the client has ordered the study. In this process a final QA/QC is done before the study is emailed to the client. Since we believe in giving our clients a good experience of our research studies, therefore, to make sure that we do not lack at our end in any way humanly possible we do a final round of quality check and then dispatch the study to the client.
Key Segments:
By Component
Software
Services
By Asset Type
Characters
Environments
Props
Textures
Others
By Application
Gaming
Film & Animation
Architecture
E-commerce
Virtual Reality
Augmented Reality
Others
By Deployment Mode
Cloud
On-Premises
By End-User
Media & Entertainment
Gaming
Architecture & Design
E-commerce
Education
Others
Request for Segment Customization as per your Business Requirement: Segment Customization Request
Regional Coverage:
North America
US
Canada
Europe
Germany
France
UK
Italy
Spain
Poland
Russia
Rest of Europe
Asia Pacific
China
India
Japan
South Korea
Australia
ASEAN Countries
Rest of Asia Pacific
Middle East & Africa
UAE
Saudi Arabia
Qatar
South Africa
Rest of Middle East & Africa
Latin America
Brazil
Argentina
Mexico
Colombia
Rest of Latin America
Request for Country Level Research Report: Country Level Customization Request
Available Customization
With the given market data, SNS Insider offers customization as per the company’s specific needs. The following customization options are available for the report:
Detailed Volume Analysis
Criss-Cross segment analysis (e.g. Product X Application)
Competitive Product Benchmarking
Geographic Analysis
Additional countries in any of the regions
Customized Data Representation
Detailed analysis and profiling of additional market players