AI in Insurance Market Report Scope & Overview:
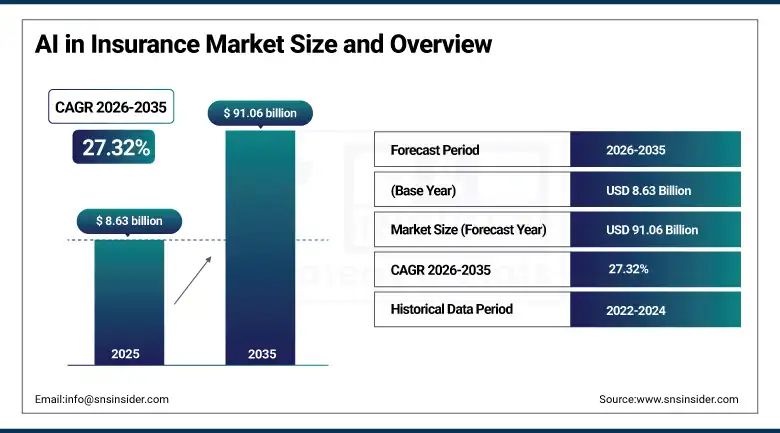
The AI in Insurance market was valued at USD 8.63 Billion in 2025 and is expected to reach USD 91.06 Billion by 2035, growing at a CAGR of 27.32% from 2026–2035.
The global AI in insurance market is at the leading edge of the financial services industry’s most consequential technology transformation, as artificial intelligence moves from experimental deployment in isolated pilot programmes toward systematic integration across the full spectrum of insurance operations from customer acquisition and policy underwriting through claims settlement, fraud investigation, and portfolio risk management. The insurance industry’s fundamental business model, which has always depended on the accurate prediction of future losses from historical data patterns and the efficient processing of the claims events that those losses generate, is structurally aligned with the capabilities that machine learning, natural language processing, computer vision, and advanced predictive analytics deliver, making insurance one of the sectors where AI adoption generates the most direct and measurable commercial value rather than requiring organizational experimentation to identify productive applications.
McKinsey’s finding that early AI adopters in the insurance industry are generating approximately six times the total shareholder returns of their AI-laggard peers over comparable periods, combined with Accenture’s survey showing 86% of insurance organizations plan to increase AI spending in 2026, defines an industry-wide commitment to AI investment that is creating a self-reinforcing competitive pressure cycle where insurers cannot afford to fall behind the pace of AI adoption that their competitors are sustaining.
Market Size and Forecast
-
Market Size in 2026E: USD 10.99 Billion
-
Market Size by 2035: USD 91.06 Billion
-
CAGR: 27.32% from 2026 to 2035
-
Fastest Growing Region: Asia Pacific
-
Largest Region: North America
To Get more information On AI in Insurance Market - Request Free Sample Report
AI in Insurance Market Trends
-
Rapid deployment of generative AI and large language models across insurance operations, including AI-powered underwriting submission summarization that compresses hours of manual document review into minutes, AI-generated claims assessment reports, AI-assisted policy wording drafting, and generative AI customer service agents that handle complex policyholder enquiries with contextual understanding and natural conversation capability that rule-based chatbot systems cannot approach.
-
Growing adoption of telematics, IoT sensor data, and real-time behavioral monitoring as inputs to AI-driven dynamic pricing models in motor, property, and health insurance that move beyond static actuarial risk categories toward continuously updated, individual-level risk assessments that more accurately reflect the actual loss exposure of each policyholder and align premium pricing with real-time behaviour and environmental risk conditions.
-
Accelerating integration of computer vision and satellite imagery analysis into property insurance underwriting and claims assessment workflows, with AI systems trained on billions of aerials and ground-level property images enabling automated roof condition scoring, property change detection, natural disaster damage assessment, and construction quality evaluation at a geographic and temporal coverage scale that human inspection programmes cannot approach.
-
Rising deployment of AI-powered parametric insurance products that automatically trigger claims payments based on objectively measurable event parameters such as weather station readings, seismic intensity measurements, and satellite-verified crop damage metrics without requiring policyholders to file traditional claims or undergo loss adjustment processes, dramatically accelerating claims settlement and eliminating the administrative friction that reduces policyholder satisfaction with conventional claims experiences.
-
Growing Insurtech ecosystem investment in AI-native specialty insurance products targeting emerging risk categories including cyber liability, climate-related business interruption, pandemic supply chain disruption, and AI-generated content liability that traditional actuarial models built on historical loss data cannot adequately price, requiring AI-powered real-time risk modelling approaches that incorporate current threat intelligence, real-time vulnerability scanning, and dynamic exposure quantification.
The U.S. AI in Insurance Market Outlook
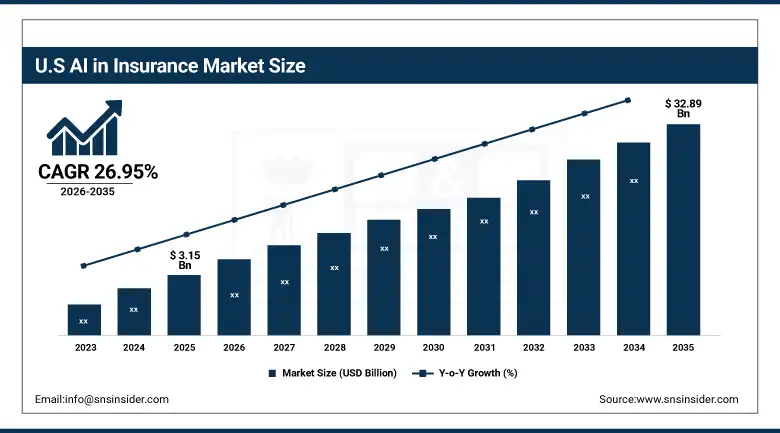
The U.S. AI in Insurance Market was valued at approximately USD 3.15 Billion in 2025 and is expected to reach approximately USD 32.89 Billion by 2035, growing at a CAGR of 26.95%.
The United States AI in insurance market is defined by the simultaneous AI transformation occurring across the full spectrum of insurance market participants from the largest multi-line commercial carriers including Chubb, AIG, Travelers, and The Hartford, which are deploying AI at enterprise scale across underwriting, claims, and fraud detection operations, through to the AI-native Insurtech challengers including Lemonade, Root, Kin, and Hippo, whose cloud-native architectures and proprietary behavioral data assets are enabling insurance product innovation and underwriting personalization that incumbent carrier legacy systems struggle to replicate.
The regulatory landscape for AI in insurance is evolving rapidly across U.S. state markets, with the National Association of Insurance Commissioners’ Artificial Intelligence/Machine Learning workgroup developing model regulatory guidance on algorithmic bias testing, adverse action explanations for AI-driven underwriting and claims decisions, and governance standards for AI model validation that state insurance departments are progressively incorporating into their market conduct examination frameworks, creating compliance programme investment requirements that are adding to overall AI deployment cost but simultaneously building the regulatory clarity that enables confident enterprise-scale AI deployment by reducing legal and reputational risk uncertainty.
AI in Insurance Market Segment Analysis
-
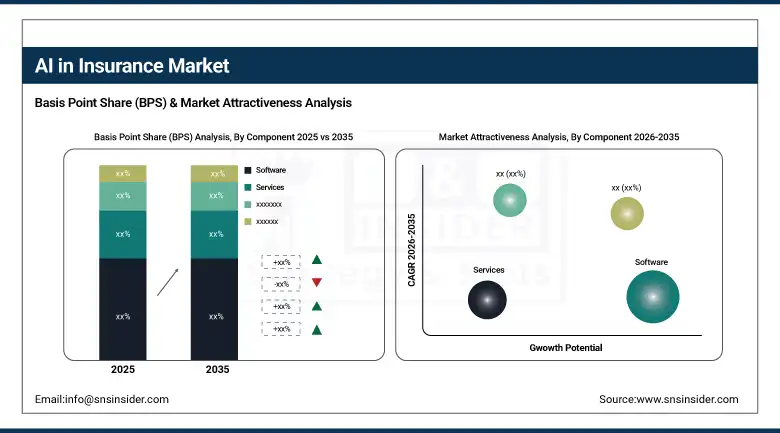
By Component, Software held the largest market share of approximately 60.25% in 2025; Services is the fastest-growing segment at a CAGR of approximately 34.76%.
-
By Technology, Machine Learning held the largest market share of approximately 44.78% in 2025; Natural Language Processing is forecasted to expand at the fastest CAGR of approximately 34.88%.
-
By Application, Fraud Detection and Risk Management held the largest share of approximately 35.46% in 2025; Customer Service and Chatbots are expected to grow at the fastest CAGR of approximately 34.92%.
By Component, Software dominates component, Services grows fastest
Software retained the dominant component position with approximately 60.25% of the AI in Insurance Market in 2025, a dominance reflecting the fundamental reality that AI capability in insurance is primarily delivered through software platforms encompassing predictive analytics engines, machine learning model deployment infrastructure, natural language processing applications, computer vision systems, and the data integration and management platforms that connect AI models to the policyholder data, claims records, and external data sources whose quality and breadth determine AI model performance quality in insurance applications.
Services is the fastest-growing component at a CAGR of approximately 34.76% through 2035, propelled by the recognition across the insurance industry that AI deployment is not merely a technology purchase but a comprehensive transformation programme requiring data strategy consulting, AI model development and validation, system integration engineering, regulatory compliance programme design, change management support, and ongoing model monitoring and governance that few insurance organizations can deliver entirely through internal capability.
By Technology, Machine Learning dominates technology, NLP grows fastest
Machine Learning retained the dominant technology position with approximately 44.78% of the AI in Insurance Market in 2025, a dominance grounded in the extraordinary breadth of insurance applications where supervised, unsupervised, and reinforcement learning techniques deliver direct commercial value: from gradient boosting and random forest models that identify fraudulent claims patterns in structured claims data through deep learning networks that detect anomalies in unstructured invoice images and medical records through reinforcement learning systems that optimize claims settlement negotiation strategies across the millions of individual claims interactions that major carriers process annually.
Natural Language Processing is the fastest-growing technology segment at a CAGR of approximately 34.88% through 2035, driven by the extraordinary volume of unstructured text, voice, and document data that insurance operations generate and process daily, spanning policyholder correspondence, claims adjuster notes, medical records, legal documents, underwriting submissions, regulatory filings, and customer service interactions whose content contains commercially valuable signals that structured data models cannot access.
By Application, Fraud Detection dominates application, Customer Service grows fastest
Fraud Detection and Risk Management retained the dominant application position with approximately 35.46% of the AI in Insurance Market in 2025, reflecting the insurance industry’s highest-priority commercial problem: the Coalition Against Insurance Fraud estimates that insurance fraud costs U.S. insurers over USD 80 billion annually, representing a direct drag on combined ratios that AI-powered detection is demonstrably improving by identifying fraudulent claims patterns, staged accident networks, medical billing inflation, and application misrepresentation at detection rates substantially above both rule-based systems and human fraud investigation teams working without AI support.
Customer Service and Chatbots is the fastest-growing application segment at a CAGR of approximately 34.92% through 2035, propelled by the insurance industry’s growing recognition that customer experience quality is a primary competitive differentiator in markets where product commoditisation makes service experience the dominant factor in retention and referral decisions, combined with the AI capability maturation in conversational interfaces that is making AI-powered customer service a genuinely superior alternative to traditional contact center interactions for the majority of standard policyholder service request categories.
Regional Analysis
|
Region |
Major Country |
Share within Region, 2025 (%) |
|---|---|---|
|
North America |
United States |
87.4% |
|
Europe |
Germany |
22.3% |
|
Asia Pacific |
China |
61.7% |
|
Middle East & Africa |
Saudi Arabia |
38.4% |
|
Latin America |
Brazil |
44.2% |
North America AI in Insurance Market Insights
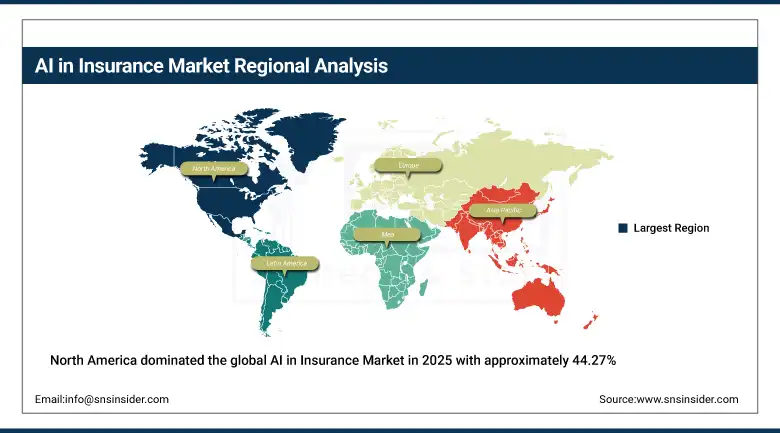
North America dominated the global AI in Insurance Market in 2025 with approximately 44.27% of global revenues, the United States accounting for approximately 87.4% of North American revenues, driven by the world’s largest insurance premium volume market whose scale creates the data assets and financial resources that make enterprise AI deployment economically compelling at a magnitude unavailable in smaller national markets. The United States had over 5,430 active AI projects across claims processing, underwriting, and customer engagement in 2025, with more than 320 insurers operating AI-powered analytics platforms and over 210 digital insurance startups with integrated AI operating commercially across personal lines, commercial lines, and specialty insurance segments. The concentration of Insurtech venture capital investment in U.S. markets, which captures the majority of global AI in insurance startup funding, is accelerating the competitive pressure on traditional carriers by continuously introducing AI-native product and operational innovation that incumbents must respond to or risk loss of technologically progressive customer segments.
Get Customized Report as per Your Business Requirement - Enquiry Now
Europe AI in Insurance Market Insights
Europe is a technically sophisticated AI in insurance market where the GDPR data privacy framework, the EU AI Act’s risk-based governance requirements for AI systems deployed in consequential decision-making including insurance underwriting and claims assessment, and strong national financial supervisory authority oversight of algorithmic insurance practices are creating a more regulated but ultimately more structured and institutionally credible AI adoption environment than the more permissive early deployment era in U.S. markets. Germany accounts for approximately 22.3% of European AI insurance revenues as the region’s largest national market, with major reinsurers Munich Re and Hannover Re investing heavily in AI-powered risk modelling capabilities that leverage their unparalleled access to global insurance loss data to build proprietary machine learning models for natural catastrophe, cyber, and mortality risk quantification that they deploy both internally and sell to primary insurers globally as risk assessment services. The European insurance sector’s AI adoption is being accelerated by the industry’s response to climate risk, as the increasing frequency and geographic expansion of severe weather events across Europe including flooding in Germany, wildfires across Mediterranean countries, and wind storm damage across Northern Europe is pushing underwriters toward AI-enhanced climate risk modelling that can update property portfolio exposure assessments in near-real time as climate model projections evolve.
Asia Pacific AI in Insurance Market Insights
Asia Pacific is the fastest-growing regional AI in insurance market at a CAGR of approximately 28.68% through 2035, driven by China’s extraordinary pace of digital insurance innovation where technology platform companies including Alibaba’s Ant Group, Tencent, and Ping An Insurance are deploying AI across insurance operations at a scale and speed that in some application categories exceeds Western market deployment maturity, India’s rapidly expanding insurance sector whose move toward digital-first distribution is creating greenfield AI deployment opportunities across a large underinsured population transitioning to formal insurance coverage, and Japan’s ageing population driving health and life insurance product innovation that AI-powered health monitoring and personalized policy management tools are enabling.
Latin America and MEA AI in Insurance Market Insights
Latin America and the Middle East and Africa are emerging AI in insurance markets where digital insurance distribution expansion, growing Insurtech investment, and the adoption of AI-powered tools to serve large previously uninsured populations through mobile and digital channels are creating structurally new AI insurance application opportunities that differ from the incremental operational improvement focus of mature market AI deployments. Brazil accounts for approximately 44.2% of Latin American AI insurance revenues through the combination of the region’s largest insurance market, a growing Insurtech ecosystem in São Paulo and Rio de Janeiro, and the progressive adoption of AI-powered motor and health insurance personalization among a young, mobile-first consumer base whose digital engagement expectations are high relative to the traditional insurance distribution model’s ability to serve them effectively.
Market Dynamics
Growth Drivers: Insurance fraud cost pressure driving AI detection investment, climate risk complexity demanding AI-powered real-time risk modelling, and operational efficiency imperatives accelerating AI claims automation and underwriting deployment
The primary structural growth drivers for the AI in Insurance Market are the convergence of severe operational efficiency pressure from rising loss costs, fraud escalation, and expense ratio competition that is making AI investment a financial necessity rather than an optional strategic enhancement for carriers seeking to maintain profitability in increasingly challenging underwriting environments, combined with the availability of increasingly capable and commercially accessible AI platforms that are reducing the technical barriers and investment thresholds for AI deployment across insurance operations of all sizes. The insurance fraud problem represents perhaps the single most commercially compelling driver of AI investment in the industry, as the Coalition Against Insurance Fraud’s estimate that fraud adds USD 400 to USD 700 to the average U.S. household’s annual insurance costs provides both the financial scale that justifies substantial AI detection investment and the consumer harm narrative that makes AI fraud detection a reputationally positive investment alongside its operational return.
Restraints: Algorithmic bias and regulatory scrutiny creating compliance burden, data quality and availability limitations constraining AI model performance, and legacy system integration complexity slowing enterprise deployment
A significant restraint on the AI in Insurance Market is the growing regulatory and political scrutiny of algorithmic insurance practices, particularly the use of non-traditional data variables and machine learning models in underwriting and claims decisions that may produce disparate outcomes across protected class characteristics even when the variables themselves are not explicitly discriminatory, creating legal exposure and reputational risk for insurers deploying AI in ways that state insurance regulators, consumer advocacy organizations, and legislative bodies are increasingly scrutinizing through market conduct examinations, legislative hearings, and proposed algorithmic accountability regulations. The data quality and availability challenge is a persistent constraint on AI model performance in insurance, as the historical loss data that machine learning models require for training is often sparse for emerging risk categories including cyber liability, pandemic business interruption, and climate-driven emerging perils whose loss history is insufficient to train reliable predictive models without supplementing actuarial data with alternative data sources whose relationship to insurance loss outcomes requires careful validation.
Opportunities: Generative AI workflow automation creating new efficiency improvement categories, climate risk AI creating new underwriting capability for previously unpriceable perils, and emerging market digital insurance expansion creating greenfield AI deployment opportunities
Generative AI represents the most immediately commercially significant opportunity in insurance AI, as the deployment of large language models for underwriting submission processing, claims document analysis, regulatory filing automation, and customer service interaction handling is delivering workflow efficiency improvements of 40 to 70 percent in the specific tasks where AI assistance is most directly applicable, creating ROI profiles that justify rapid enterprise investment and competitive pressure cycles that reward early deployment advantage. Climate risk AI represents a strategically important opportunity to create new insurance capacity for perils whose complexity and data scarcity have historically limited insurers’ ability to write adequate coverage at commercially viable prices, as AI-powered physical climate risk modelling that integrates real-time atmospheric data, satellite imagery, and climate model projections with property exposure data creates underwriting insight for wildfire, flood, and extreme heat risks that enables insurers to differentiate between high and low-risk properties within previously monolithic geographic risk zones and price coverage accordingly.
Recent Developments:
-
2025: Zurich North America integrated AI-powered aerial imagery and roof-condition scoring from Nearmap directly into its U.S. Middle Market underwriting platform, and deployed Sixfold’s AI submission summarization tool which processed over one million underwriting submissions across more than 40 lines of business by December 2025, achieving an 89% average user adoption rate that demonstrates the operational scalability of enterprise AI underwriting tools at major carrier scale.
-
2025: Ant Group launched “Yixiaobao,” an AI-powered insurance advisor for Chinese policyholders that provides personalized policy guidance, product comparison analysis, and claims assistance through a conversational AI interface, representing one of the most ambitious deployments of consumer-facing generative AI in insurance from a company with access to the scale of policyholder data that Ant’s Alipay ecosystem provides.
-
2025: Lemonade expanded its AI-driven claims automation capabilities, demonstrating its AI model’s ability to settle straightforward claims in seconds through automated damage assessment, fraud screening, and payment processing without human claims adjuster involvement, and announced expansion of its AI underwriting personalization into new insurance product categories beyond renters and homeowners’ insurance.
AI in Insurance Market Key Players are:
-
IBM Corporation
-
Microsoft Corporation
-
Google LLC (Google Cloud)
-
Amazon Web Services
-
Salesforce Inc.
-
Lemonade Inc.
-
Shift Technology
-
Tractable
-
Cape Analytics
-
Gradient AI
-
Ant Group (Alipay)
-
Ping An Insurance Group
-
Zurich Insurance Group
-
The Hartford
-
Allstate Corporation
-
Progressive Corporation
-
AXA SA
-
Munich Re
-
Swiss Re
-
Verisk Analytics
AI in Insurance Market Report Scope:
| Report Attributes | Details |
|---|---|
| Market Size in 2025 | USD 8.63 Billion |
| Market Size by 2035 | USD 91.06 Billion |
| CAGR | CAGR of 27.32% From 2026 to 2035 |
| Base Year | 2025 |
| Forecast Period | 2026-2035 |
| Historical Data | 2022-2024 |
| Report Scope & Coverage | Market Size, Segments Analysis, Competitive Landscape, Regional Analysis, DROC & SWOT Analysis, Forecast Outlook |
| Key Segments | • By Component (Software, Services) • By Technology (Machine Learning, Natural Language Processing, Computer Vision, Robotic Process Automation, Others) • By Application (Fraud Detection & Risk Management, Claims Processing, Customer Service & Chatbots, Underwriting, Others) • By Insurance Type (Property & Casualty, Health Insurance, Life Insurance, Others), By Deployment Mode (Cloud-Based, On-Premise) • By End User (Insurance Companies, Third-Party Service Providers) |
| Regional Analysis/Coverage | North America (US, Canada), Europe (Germany, UK, France, Italy, Spain, Russia, Poland, Rest of Europe), Asia Pacific (China, India, Japan, South Korea, Australia, ASEAN Countries, Rest of Asia Pacific), Middle East & Africa (UAE, Saudi Arabia, Qatar, South Africa, Rest of Middle East & Africa), Latin America (Brazil, Argentina, Mexico, Colombia, Rest of Latin America). |
| Company Profiles | IBM Corporation, Microsoft Corporation, Google LLC (Google Cloud), Amazon Web Services, Salesforce Inc., Lemonade Inc., Shift Technology, Tractable, Cape Analytics, Gradient AI, Ant Group (Alipay), Ping An Insurance Group, Zurich Insurance Group, The Hartford, Allstate Corporation, Progressive Corporation, AXA SA, Munich Re, Swiss Re, and Verisk Analytics. |
Get in Touch
