AI Smart Glasses Market Size & Trends:
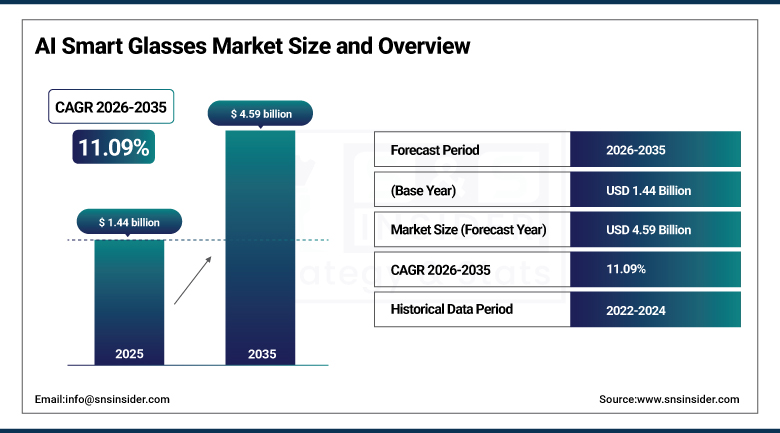
The AI Smart Glasses Market size was valued at USD 1.44 Billion in 2025 and is projected to reach USD 4.59 Billion by 2035, growing at a CAGR of 11.09% during 2026-2035.
Rising demand for hands-free operations, increasing AR/VR technologies, implementation of voice assistant technology, and increasing penetration in healthcare, industrial, and consumer electronics, improved user experience, are some of the major catalysts to drive the growth of AI smart glasses market globally in future.
The market of AI smart glasses is expected to witness the highest growth owing to high investments in wearables followed by their adoption across logistics and field services and availability of 5G network to process data in real-time. With better battery, smaller parts, and improved UI, these devices are on their way to becoming a part of our daily lives. Moreover, the increasing focus on immersive learning and training experiences, coupled with rising need for remote collaboration tools across enterprise solutions is propelling the uptake of AI-enabled smart glasses, globally.
By the end of 2024, global 5G connections reached 2.25 billion, marking a substantial leap in adoption and enabling real-time data processing capabilities essential for AI smart glasses.
AI Smart Glasses Market Size and Growth Projection:
-
Market Size in 2025: USD 1.44 Billion
-
Market Size by 2035: USD 4.59 Billion
-
CAGR: 11.09% (from 2026 to 2035)
-
Base Year: 2025
-
Forecast Period: 2026–2035
-
Historical Data: 2022–2024
To Get More Information On AI Smart Glasses Market - Request Free Sample Report
AI Smart Glasses Market Trends Highlights:
-
Display-free, voice-first AI smart glasses gained traction, enabling hands-free interaction, real-time translation, navigation, and AI assistant support without visual distraction.
-
Dual-chip and power-efficient architectures are emerging as key design trends, improving battery life while supporting advanced features such as video capture and multimodal AI processing.
-
Major technology companies are reallocating R&D focus toward AI wearables, signaling confidence in smart glasses as a long-term growth platform beyond smartphones.
-
New brands and product lines entered the market, highlighting increased competition and faster product cycles across consumer and prosumer segments.
-
Product differentiation is expanding, with smart glasses now offering combinations of camera-based AI, contextual memory, audio-centric interaction, and optional display capabilities.
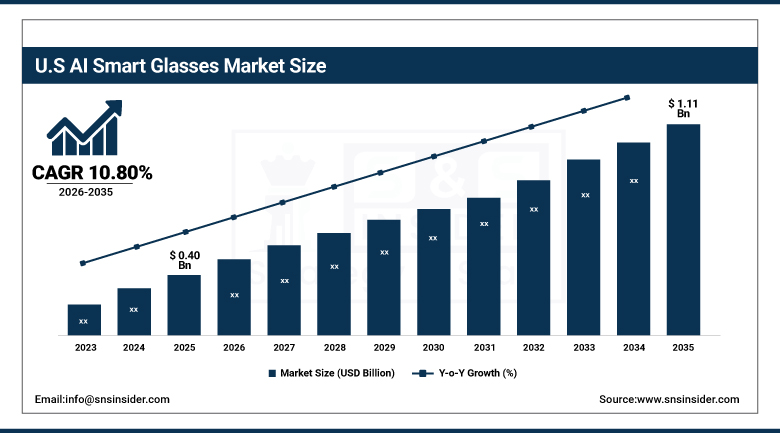
U.S. AI Smart Glasses Market Size Outlook
The U.S. AI Smart Glasses Market size is estimated to be valued at USD 0.40 billion in 2025 and is projected to grow at a CAGR of 10.80%, reaching USD 1.11 billion by 2035. The U.S. AI smart glasses market growth is driven by the investment going on in wearable technology, integration of AI in consumer devices, and development of recent AR applications. Meta and Google are pioneers of innovation in this space Meta, for instance, has seen massive interest in its upcoming Ray-Ban smart glasses, which are expected to introduce features, such as real-time translation of speech and voice assistance.
AI Smart Glasses Market Drivers:
-
AI Smart Glasses Market Booms with AR Advancements 5G Expansion and Rising Demand for Immersive Tech
Rapid advancements in augmented reality (AR) and artificial intelligence technologies are the key factors contributing toward the growth of AI smart glasses market trends by improving the device functionality and user experience. Increased investments in wearable technology and a wider 5G network allow for near real-time data processing, leading to increased adoption rate in diverse sectors. This is further driven by the growing requirement for hands-free, productive operations in various sectors, including logistics, manufacturing, and healthcare. In addition, an increase in consumer demand for immersive experiences via gaming, fitness, and communication applications also propels the growth of the market.
-
The use of AI smart glasses in gaming and fitness apps grew by 35% in 2024, with over 3 million active users globally engaging in AR-enhanced interactive experiences.
-
Remote collaboration tools powered by AI smart glasses were adopted by over 20,000 enterprises in 2024, improving productivity and reducing travel costs.
AI Smart Glasses Market Restraints:
-
AI Smart Glasses Face Challenges from Privacy Battery Limits Software Compatibility and User Comfort Issues
Privacy and security concerns are substantial restraints on the market, and these devices have microphones and cameras that can be used for unauthorized data capture and surveillance. Even with those enhancements, battery life is still limited, making all-day, no-plug continuous use possible only for light-use applications. Similarly, technical barriers include the compatibility issues with existing software ecosystems, requiring seamless integration with other devices and wearables. In addition, user comfort continues to be an obstacle, given that prolonged periods of wearing the system design can lead to discomfort or fatigue caused by design weight and design.
AI Smart Glasses Market Opportunities:
-
AI Smart Glasses Unlock Growth with Better Design Healthcare Use and Expanding Tech Ready Global Markets
The budding ecosystem of AI smart glasses will evolve with better battery longevity, miniaturized hardware and user interfaces, so the opportunities will be plentiful while they become more convenient for daily use. Firms are using these devices to boost productivity gains via remote collaboration, training, and maintenance. Healthcare is one of the sectors with great potential for surgical assistance and diagnostics. Moreover, new markets with increasing levels of digital infrastructure and a rising base of tech-savvy consumers provide an opportunity for widespread adoption and innovation of AI smart glasses.
-
In 2024, several leading AI smart glasses models, including Meta Quest Pro and TCL RayNeo XR, achieved battery lives of up to 8 hours on a single charge, marking a significant improvement over previous generation.
-
Over 20,000 companies globally adopted AI smart glasses in 2024 for remote collaboration, reducing operational costs and improving workforce productivity in sectors like manufacturing, logistics, and field service.
AI Smart Glasses Market Segment Analysis:
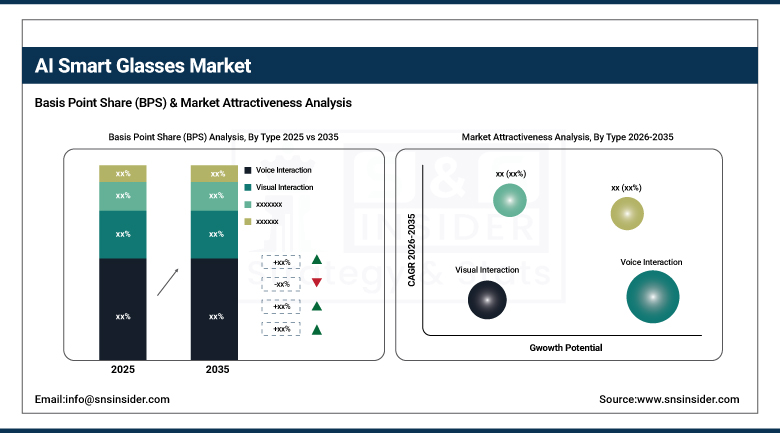
By Type
The voice interaction segment accounted for over 56.2% of the global AI smart glasses market share in 2025, owing to their adoption in retail, e-commerce, and education sectors. Such dominance is driven by the natural and hands-free way of communication offered by voice commands, which enables increased comfort and safety across users in several verticals, especially for industrial, logistics and healthcare. The ability to use voice to seamlessly access information, control applications and perform tasks without breaking concentration is why voice interaction is rapidly being adopted by enterprises and consumers alike.
Visual interaction is expected to experience the fastest CAGR over 2026-2035. AR (augmented reality) and computer vision technologies are being advanced for more intuitive visual interfaces. Providing a visual interaction component fills a gap in functionality through a set of common experiences proper real-world data overviews, object identification and recognitions, and gesture-based interaction that is important in training, remote assistance, and gaming applications. Improved hardware miniaturization and processing power will enable more seamless visual interaction, opening up new possibilities and applications, and redefining user interaction with AI smart glasses for many industries.
By Application
In 2025, the AI smart glasses market for consumer electronics segment held the largest share at 37.1%. This leadership is propelled by increasing consumer demand for immersive technologies in the areas of gaming, fitness, communications, and media consumption. The smart glasses are designed for anyone looking to enhance their user experience using AR overlays, voice commands, and hands-free connection to smart devices features that would attract the attention from tech-savvy individuals. Their popularity is also enhanced due to their smart and AI assistants and the ability to get connected with a smartphone without any mess making them more convenient and innovative for the users.
The fastest growing segment over 2026-2035 is expected to be medical. AI smart glasses use of extenders in the remote diagnosis, patients monitoring and surgical assistance spaces is highly increasing in the healthcare industry. These are devices that enhance precision, efficiency and the near real-time availability of critical data during medical procedures. Demand is also driven by increasing investments in digital health infrastructure and the growing need for solutions in the telemedicine sector. The coming of age of medical smart glasses will be instrumental in changing the way patient care and healthcare workflows are managed around the world, as technology evolves.
AI Smart Glasses Market Regional Analysis:
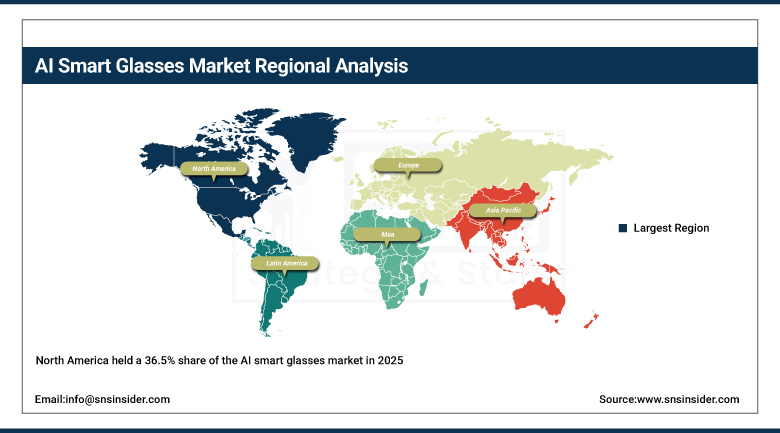
North America AI Smart Glasses Market Trends:
The North America held a 36.5% share of the AI smart glasses market in 2025 as an early adopter of advanced wearable technologies and with the support of robust technological infrastructure. The availability of high-speed networks, including extensive 5G coverage, helps to process data, in real time, which is essential to the function of AI smart glasses. Strong levels of investment by big techs and start-ups have helped in accelerating product innovation and commercialization. Moreover, the demand fuelled by various use cases in sectors including healthcare, manufacturing, logistics, and enterprise solutions. Growing consumer enthusiasm for augmented reality experiences and smart wearable devices also helps drive the market. A healthy ecosystem is being supported by favorable regulation diffusing the use of private-PHV technologies, along with the establishment of partnership agreements between tech providers and industry players.
Supported by favourable tech innovation, solid 5G infrastructure, gigantic investments, and massive penetration of healthcare, enterprise and consumer sector, US leaded the North America AI smart glasses market.
Get Customized Report as Per Your Business Requirement - Enquiry Now
Asia-Pacific AI Smart Glasses Market Trends:
The fastest CAGR of 11.86% over 2026-2035 will be seen in the Asia Pacific region. The main driving forces behind the growth are rapid development of digital infrastructures, expanding networks of 5G, and an ever-growing population of locals interested in technology. Market growth is driven by growing investment into wearable technology along with increasing adoption in sectors inclusive of manufacturing, healthcare and logistics. Furthermore, an increase in consumer interest toward AR-enabled devices, coupled with rising demand for AR-enabled devices for gaming, education, and communication, boost the market growth. AI smart glasses deployment across the region is further propelled by favorable government initiatives, supporting innovation and smart city projects.
The Asia Pacific AI smart glasses market is commanded by China due to rapid urbanization, extensive 5G deployment, robust manufacturing base, rising investments in AR technology, and increasing adoption of smart glasses in the consumer as well as industrial verticals.
Europe AI Smart Glasses Market Trends:
The European AI smart glasses market continues to grow at a stable rate owing to improvement in AR technology along with high industrial adoption. A well-developed healthcare and manufacturing industries in the region with optimal integration of smart glasses enhance their productivity and remote collaboration. Market conditions are increasingly driven by privacy regulations and data security, motivating advances in both secure and user-friendly devices. More importantly, there exist supportive government initiatives, as well as collaborative efforts between technology companies and research institutions, which are fostering technological progress and greater adoption within multiple industries.
Latin America and Middle East & Africa AI Smart Glasses Market Trends:
Latin America and the Middle East & Africa (MEA) regions are chasing to be the emerging market for AI smart glasses, as the digital infrastructure is ramped up, and increasing application in healthcare, logistics, and manufacturing industries, according to the report. With increasing technology investments and extended 5G networks, more options for information processing are becoming available in real-time. Although adoption in these regions remains moderate, government initiatives in favour of digital transformation and greater awareness among enterprises and consumers will drive higher market growth in the next few years.
AI Smart Glasses Market Competitive Landscape:
Google, established in 1998, is a leading player in the AI smart glasses ecosystem, leveraging its strengths in artificial intelligence, augmented reality, and wearable computing. Through initiatives such as Google Glass Enterprise and advanced AR research, the company focuses on enterprise productivity, real-time information access, and seamless integration with its AI and cloud platforms.
- In May 2025, Google unveiled new prototype Android XR glasses, marking its reentry into the smart glasses market. The company emphasized seamless integration of AR and AI capabilities.
Vuzix, established in 1997, is a prominent player in the AI smart glasses market, specializing in enterprise-focused augmented reality smart glasses. The company delivers wearable display solutions for industrial, medical, logistics, and field service applications, emphasizing hands-free operation, real-time data access, and AI-enabled vision technologies.
- In January 2024, Vuzix introduced the Z100 smart glasses, designed for all-day wear and seamless connection with AI optimization tools, enhancing workplace efficiency.
Top AI Smart Glasses Companies are:
-
Google
-
Microsoft
-
North (acquired by Google)
-
Magic Leap
-
Epson
-
Osterhout Design Group (ODG)
-
Snap
-
Meta Platforms
-
Apple
-
Nreal
-
Rokid
-
Lenovo
-
Huawei
-
Qualcomm
-
Bose
-
Facebook Reality Labs
-
Auvis Systems
-
XiGHT
| Report Attributes | Details |
|---|---|
| Market Size in 2025 | USD 1.44 Billion |
| Market Size by 2035 | USD 4.59 Billion |
| CAGR | CAGR of 11.09% From 2026 to 2035 |
| Base Year | 2025 |
| Forecast Period | 2026-2035 |
| Historical Data | 2022-2024 |
| Report Scope & Coverage | Market Size, Segments Analysis, Competitive Landscape, Regional Analysis, DROC & SWOT Analysis, Forecast Outlook |
| Key Segments | • By Type (Voice Interaction, and Visual Interaction) • By Application (Industrial, Medical, Consumer electronic, and Others) |
| Regional Analysis/Coverage | North America (US, Canada), Europe (Germany, UK, France, Italy, Spain, Russia, Poland, Rest of Europe), Asia Pacific (China, India, Japan, South Korea, Australia, ASEAN Countries, Rest of Asia Pacific), Middle East & Africa (UAE, Saudi Arabia, Qatar, South Africa, Rest of Middle East & Africa), Latin America (Brazil, Argentina, Mexico, Colombia, Rest of Latin America). |
| Company Profiles | Google, Microsoft, Vuzix, North (acquired by Google), Magic Leap, RealWear, Epson, Osterhout Design Group (ODG), Snap, Meta Platforms, Apple, Nreal, Rokid, Lenovo, Huawei, Qualcomm, Bose, Facebook Reality Labs, Auvis Systems, and XiGHT. |
Get in Touch
