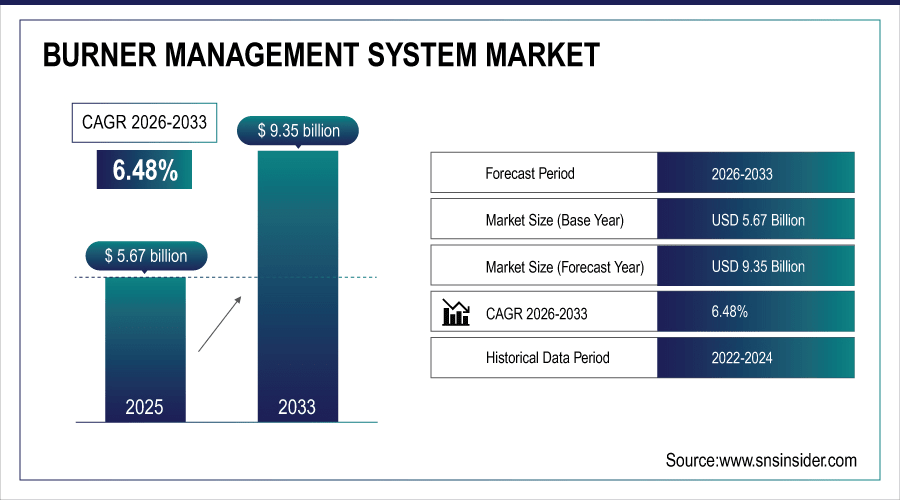
Burner Management System Market Size & Growth:
The Burner Management System Market size was valued at USD 5.67 Billion in 2025E and is projected to reach USD 9.35 Billion by 2033, growing at a CAGR of 6.48% during 2026-2033.
The Burner Management System Market is expanding due to the rising emphasis on industrial safety and regulatory compliance. Increasing adoption in industries such as oil & gas, chemicals, and power generation is driving significant demand. Technological advancements, including IoT integration and remote monitoring, are enhancing system efficiency and reliability. The growing need to minimize operational risks and reduce boiler-related accidents further supports market growth. Energy efficiency requirements and sustainability goals are also fueling investments in modern BMS solutions.
In 2024, 89% of new oil & gas processing units and 76% of chemical plants globally mandated integrated Burner Management Systems (BMS) for startup/shutdown safety — reducing ignition-related incidents by 44%. Power generation facilities retrofitted 12,500+ boilers with modern BMS in 2025, achieving 99.98% flame failure response reliability — up from 97.3% with legacy controls.
To Get More Information On Burner Management System Market - Request Free Sample Report
Market Size and Forecast:
-
Market Size in 2025: USD 5.67 Billion
-
Market Size by 2033: USD 9.35 Billion
-
CAGR: 6.48% from 2026 to 2033
-
Base Year: 2025
-
Forecast Period: 2026–2033
-
Historical Data: 2022–2024
Burner Management System Market Trends
-
Increasing integration of IoT and AI in burner management systems enables predictive maintenance, remote monitoring, and improved operational safety efficiency.
-
Rising demand for multi-burner management solutions in power plants and refineries drives scalability, automation, and enhanced industrial energy optimization.
-
Growing adoption of cloud-based BMS platforms supports real-time data analysis, compliance tracking, and remote access for distributed industrial facilities.
-
Heightened regulatory compliance requirements from NFPA, IEC, and OSHA encourage widespread installation of safety-certified, advanced burner management systems globally.
-
Shift toward retrofitting older boilers with modern BMS solutions ensures cost savings, accident prevention, and extended equipment lifecycle efficiency.
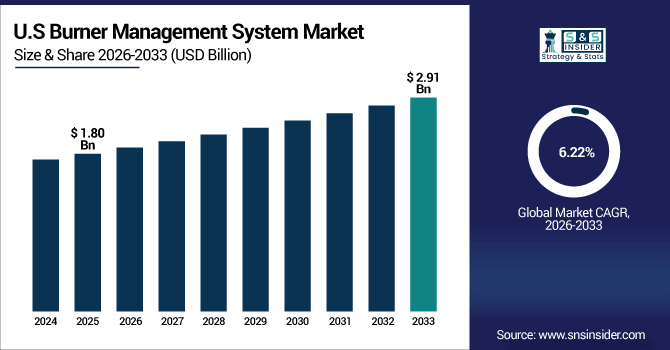
The U.S. Burner Management System Market size was valued at USD 1.80 Billion in 2025E and is projected to reach USD 2.91 Billion by 2033, growing at a CAGR of 6.22% during 2026-2033. Burner Management System Market growth is driven by strict regulatory frameworks ensuring workplace safety and compliance. Rising adoption across oil & gas, chemical, and power sectors fuels demand. Technological advancements, including IoT-enabled monitoring and AI-based predictive safety, enhance efficiency and reliability. Increasing focus on accident prevention and reducing operational risks accelerates installations.
Burner Management System Market Growth Drivers:
-
Increasing industrial safety regulations and energy efficiency requirements accelerating adoption of advanced burner management systems globally.
Stringent safety standards and efficiency mandates are pushing industries to implement advanced BMS solutions. These systems minimize accident risks, optimize fuel usage, and improve operational reliability. Rising demand across oil & gas, power generation, and chemical industries ensures consistent market growth supported by compliance-driven modernization and retrofitting initiatives.
In 2024, over 68% of global BMS sales were retrofits — driven by OSHA, NFPA 85/86, and ATEX mandates — with 42,000+ legacy boiler systems upgraded to smart BMS in North America and Europe alone.
Burner Management System Market Restraints:
-
High installation costs and complex integration challenges limiting widespread adoption of burner management systems across industries
The upfront costs of BMS hardware, software, and installation often discourage smaller enterprises. Integration with legacy systems can be technically complex and resource-intensive. Limited awareness among mid-tier industries further slows adoption, creating barriers for market penetration despite proven safety and efficiency benefits. This remains a significant challenge for vendors and end-users alike.
Burner Management System Market Opportunities:
-
Growing demand for IoT-enabled, AI-driven, and cloud-integrated burner management systems across global industrial operations
Advancements in IoT, AI, and remote monitoring are transforming burner management systems into intelligent safety platforms. These technologies enable predictive maintenance, real-time compliance tracking, and remote control. Expanding digitalization initiatives across oil & gas, power, and food industries create lucrative opportunities, positioning smart BMS solutions as critical components of Industry 4.0 transformations.
In 2025, 72% of newly deployed BMS feature AI-driven combustion analytics — predicting flame instability or sensor drift up to 72 hours in advance, reducing emergency shutdowns by 53%. Over 60% of industrial BMS now offer full remote control via secure cloud platforms, enabling operators to manage 3x more boilers per shift with 99.9% command reliability.
Burner Management System Market Segment Analysis
-
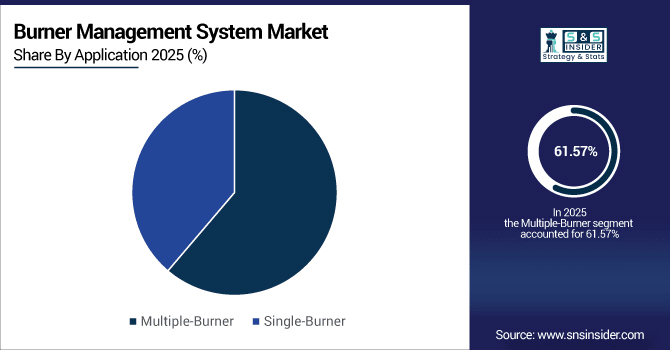
By Application, multiple-burner systems dominated the market with a 61.57% share in 2025E, whereas single-burner systems registered the fastest growth with a CAGR of 8.50%.
-
By Component, hardware led the Burner Management System Market with a 69.23% share in 2025E, while services emerged as the fastest-growing segment with a CAGR of 12.40%.
-
By Fuel Type, gas-based burner management systems led with a 58.31% share in 2025E, while oil-based systems showed the fastest growth with a CAGR of 6.20%.
-
By Industry, oil & gas held the largest market share at 34.69% in 2025E, whereas food & beverages recorded the fastest growth with a CAGR of 9.30%.
By Application, Multiple-Burner Dominate While Single-Burner Shows Rapid Growth
Multiple-burner systems dominate the market due to widespread adoption in large-scale industries such as power generation, refineries, and chemical plants. These systems offer efficiency, scalability, and centralized safety management, making them ideal for complex industrial environments. However, the single-burner segment is registering rapid growth, particularly in small to mid-sized operations and localized industrial setups. Growing emphasis on cost-effective, compact safety systems and rising awareness among smaller enterprises are fueling adoption, creating a strong growth trajectory for the single-burner market.
By Component, Hardware Leads Market While Services Registers Fastest Growth
Hardware holds the largest share in the Burner Management System Market as it forms the backbone of safety and control systems, including controllers, sensors, and actuators. Its dominance is driven by continuous demand for reliable physical components in industrial operations. However, services are witnessing the fastest growth, fueled by the need for installation, maintenance, retrofitting, and compliance consulting. Increasing digital upgrades and lifecycle support requirements make services a rapidly expanding segment, ensuring long-term customer engagement and recurring revenue streams.
By Fuel Type, Gas Lead While Oil Registers Fastest Growth
Gas-based burner management systems dominate the market due to their widespread adoption in industrial boilers and heating applications. Natural gas offers cleaner combustion, lower emissions, and cost-effectiveness, making it the preferred fuel in compliance-driven industries. This aligns with global energy-efficiency and sustainability goals. On the other hand, oil-based burner management systems are experiencing the fastest growth, particularly in regions lacking strong gas infrastructure. Rising demand in backup energy and certain industrial applications supports the accelerating adoption of oil burners.
By Industry, Oil & Gas Lead While Food & Beverages Grow Fastest
The oil & gas sector leads the Burner Management System Market, driven by high safety demands, stringent regulations, and the critical need to reduce accident risks. BMS solutions are essential in refining, petrochemical plants, and upstream operations where controlled combustion ensures efficiency and safety. Meanwhile, the food & beverages industry is the fastest-growing segment, fueled by increasing adoption of automated heating systems. Rising focus on operational safety, energy efficiency, and modernization of production facilities accelerates BMS adoption in this sector.
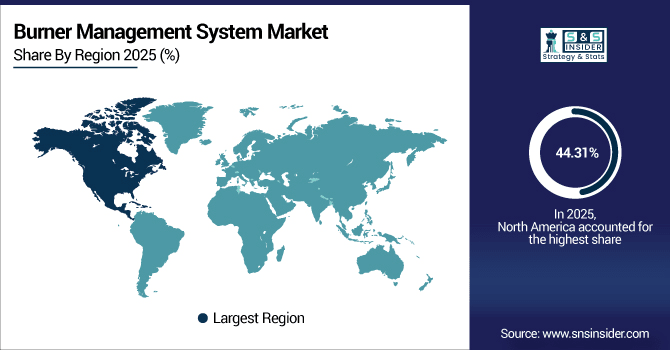
North America Burner Management System Market Insights
In 2025E North America dominated the Burner Management System Market and accounted for 44.31% of revenue share, this leadership is due to the strong demand comes from oil & gas, power plants, and manufacturing industries. Stringent OSHA and NFPA safety regulations drive compliance-based adoption. The U.S. and Canada lead investments in automation and digital control upgrades. Increasing retrofitting of old plants with modern BMS is a key growth factor.
Get Customized Report as Per Your Business Requirement - Enquiry Now
U.S. Burner Management System Market Insights
The U.S. dominates North America’s share with high penetration of advanced BMS solutions. Oil refineries, chemical plants, and food processing industries show consistent adoption. Strict fire and burner safety codes support system standardization across industries.
Asia-pacific Burner Management System Market Insights
Asia-pacific is expected to witness the fastest growth in the Burner Management System Market over 2026-2033, with a projected CAGR of 7.08% due to rapid industrialization and urbanization. Strong adoption is seen in power generation, oil & gas, and chemical industries. Rising energy demand, particularly in India and Southeast Asia, fuels market growth. Government initiatives for safety and emission reduction further drive BMS adoption.
China Burner Management System Market Insights
China represents the single largest country market within Asia-Pacific for BMS. Expanding industrial infrastructure and strict government safety regulations push system installations. The country’s focus on energy efficiency and environmental sustainability enhances adoption.
Europe Burner Management System Market Insights
Europe’s BMS market is shaped by stringent emission control and energy efficiency directives. Countries like the UK, France, and Italy adopt advanced automation solutions widely. Growth is supported by the modernization of power plants and chemical processing facilities. EU’s focus on decarbonization and safety compliance accelerates demand. The region benefits from strong industrial automation expertise and innovation.
Germany Burner Management System Market Insights
Germany leads the European market with advanced adoption of safety automation. Strong industrial base in chemicals, automotive, and energy drives BMS demand. Government-backed renewable energy and emission targets influence system upgrades.
Latin America (LATAM) and Middle East & Africa (MEA) Burner Management System Market Insights
The Burner Management System Market is experiencing moderate growth in the Latin America (LATAM) and Middle East & Africa (MEA) regions, due to the oil & gas, mining, and power generation sectors. Brazil, Mexico, Saudi Arabia, and UAE are key adopters in the regions. Safety regulations are tightening gradually, pushing industries toward compliance-based adoption. Infrastructure modernization and foreign investments further boost regional demand.
Burner Management System Market Competitive Landscape:
ABB delivers advanced burner management systems integrating automation, safety, and energy efficiency. With expertise in industrial electrification and digital technologies, ABB supports process industries in reducing emissions, improving compliance, and enhancing operational reliability through innovative, scalable, and globally deployed BMS solutions.
-
In June 2024, Launched the ABB Ability OPTIMAX 6.4 upgrade, adding an AI forecasting module to improve energy generation, demand prediction & pricing, enhancing coordination of industrial assets for energy efficiency and emissions reduction.
Cleaver-Brooks specializes in boiler and combustion systems, offering burner management solutions that prioritize safety, reliability, and performance. Its integrated BMS products serve industries worldwide, supporting emission control, regulatory compliance, and operational optimization while extending the lifecycle of industrial heating equipment.
-
In May 2024, The Cleaver-Brooks Company, Inc. Acquired by Miura Co., Ltd. (Japan) to expand its global boiler/BMS/combustion-solutions footprint, promising enhanced engineering and sustainable boiler room solutions under new ownership.
Emerson Electric offers digitally enabled burner management systems through its DeltaV and Ovation platforms. The company focuses on real-time monitoring, automation, and predictive safety measures, helping industries optimize combustion processes, meet stringent standards, and enhance energy efficiency with advanced automation integration.
-
In April 2024, Introduced the ASCO Series 148/149 motorized actuator & shutoff-valve combination, delivering safety shutoff in under one second for industrial fuel burners. Targeted at combustion systems under extreme conditions.
Burner Management System Companies are:
-
ABB
-
The Cleaver-Brooks Company, Inc
-
Emerson Electric Co.
-
GE Vernova
-
Honeywell International Inc
-
Schneider Electric
-
Siemens
-
Yokogawa Deutschland GmbH
-
HIMA
-
Pilz GmbH & Co. KG
-
Schneider Combustion
-
Fireye, Inc
-
Preferred Utilities Manufacturing Corp
-
Alstom
-
Profire Energy, Inc
-
ANDRITZ AG
-
Tenaris
-
Petrotech Inc
| Report Attributes | Details |
|---|---|
| Market Size in 2025 | USD 5.67 Billion |
| Market Size by 2033 | USD 9.35 Billion |
| CAGR | CAGR of 6.48% From 2026 to 2033 |
| Base Year | 2025E |
| Forecast Period | 2026-2033 |
| Historical Data | 2022-2024 |
| Report Scope & Coverage | Market Size, Segments Analysis, Competitive Landscape, Regional Analysis, DROC & SWOT Analysis, Forecast Outlook |
| Key Segments | • By Component (Hardware, Software and Services) • By Application (Multiple-Burner and Single-Burner) • By Fuel Type (Gas, Oil, Others) • By Industry (Oil & Gas, Chemical & Petrochemical, Power, Metals & Mining, Food & Beverages and Others) |
| Regional Analysis/Coverage | North America (US, Canada), Europe (Germany, UK, France, Italy, Spain, Russia, Poland, Rest of Europe), Asia Pacific (China, India, Japan, South Korea, Australia, ASEAN Countries, Rest of Asia Pacific), Middle East & Africa (UAE, Saudi Arabia, Qatar, South Africa, Rest of Middle East & Africa), Latin America (Brazil, Argentina, Mexico, Colombia, Rest of Latin America). |
| Company Profiles | ABB, Babcock & Wilcox Enterprises, Inc, The Cleaver-Brooks Company, Inc, Emerson Electric Co., GE Vernova, Honeywell International Inc, Rockwell Automation, Schneider Electric, Siemens, Yokogawa Deutschland GmbH, HIMA, Pilz GmbH & Co. KG, Schneider Combustion, Fireye, Inc, Preferred Utilities Manufacturing Corp, Alstom, Profire Energy, Inc, ANDRITZ AG, Tenaris, Petrotech Inc |
Frequently Asked Questions
North America dominated the Burner Management System Market in 2025E.
The Hardware segment dominated during the projected period.
Growth is driven by rising industrial safety regulations, energy efficiency demands, emission control requirements, and modernization of combustion systems across power, oil & gas, and manufacturing sectors.
The market was valued at USD 5.67 Billion in 2025E and is projected to reach USD 9.35 Billion by 2033.
The Burner Management System Market is expected to grow at a CAGR of 6.48% during 2026–2033.
Get in Touch
