Alcohol Sensor Market Report Scope & Overview:
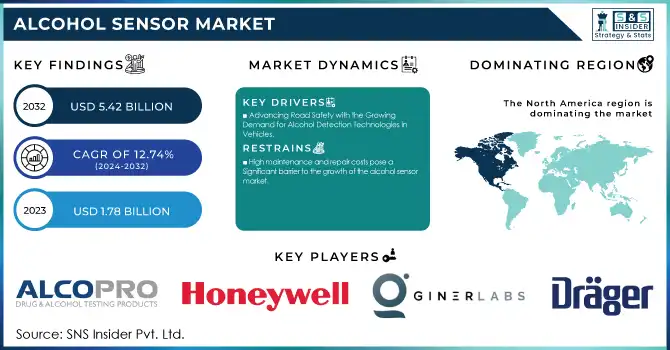
The Alcohol Sensor Market size was valued at USD 1.78 billion in 2023 and is expected to grow to USD 5.42 billion by 2032, expanding at a robust CAGR of 12.74% over the forecast period of 2024-2032.
Get more information on Alcohol Sensor Market - Request Sample Report
The alcohol sensor market is poised for substantial growth due to increasing awareness of the dangers of drunk driving and stronger regulatory measures aimed at reducing alcohol-impaired driving. With nearly 30 fatalities per day in the U.S. attributed to drunk driving (NHTSA, 2023), the need for effective alcohol detection technology is urgent. The implementation of the Driver Alcohol Detection System for Safety (DADSS) has gained momentum, with both public and private sectors supporting its development. The Bipartisan Infrastructure Law mandates the inclusion of alcohol detection technology in new vehicles by 2024, further accelerating market growth. In states like Florida, drunk driving fatalities remain a significant concern, prompting organizations such as MADD to advocate for stricter regulations. The DADSS system, which detects ethanol and carbon dioxide in the driver’s breath, offers a promising solution to prevent impaired driving, and its integration into future vehicle models will drive demand for such technology. The National Highway Traffic Safety Administration (NHTSA) highlighted that 43% of drivers aged 65 and older who died in crashes were alcohol-impaired, and with this age group now accounting for 20% of drivers on the road, the risk of accidents continues to rise. The Substance Abuse and Mental Health Services Administration (SAMHSA) warns that the number of older adults with alcohol use disorders is expected to double by 2050, exacerbating the risks. Older adults are more sensitive to alcohol’s effects, which, combined with age-related issues such as slower reaction times and cognitive decline, increases the likelihood of impaired driving. Drunk driving remains the leading cause of fatalities on U.S. roads, claiming over 10,000 lives annually and costing USD 194 billion, making the alcohol sensor market an essential growth sector for both safety and technology advancements.
Market Dynamics
Drivers
-
Advancing Road Safety with the Growing Demand for Alcohol Detection Technologies in Vehicles
Alcohol detection technologies are emerging as vital tools in preventing impaired driving, addressing a significant cause of road accidents and fatalities. Integrating alcohol detection systems into all new vehicles could save up to 9,000 lives annually. The National Transportation Safety Board (NTSB) advocates for blood alcohol concentration (BAC) monitoring systems in vehicles to prevent individuals from driving under the influence. According to the National Highway Traffic Safety Administration (NHTSA), 31% of all traffic fatalities involve impaired drivers with a BAC level of 0.08 or higher. As these figures highlight the urgency of addressing drunk driving, the automotive industry is witnessing a rising demand for alcohol detection systems. The Bipartisan Infrastructure Law mandates that new vehicles be equipped with alcohol detection technologies by 2024, accelerating the market growth for these sensors. With innovations such as the Driver Alcohol Detection System for Safety (DADSS), which is supported by both public and private sector investments, the focus is shifting towards passive alcohol detection systems. These systems are expected to become standard in all new vehicles, contributing to enhanced road safety. Furthermore, the growing regulatory support from organizations like NHTSA and NTSB is paving the way for widespread adoption of alcohol detection technologies, creating a significant opportunity for the alcohol sensor market to expand and make a lasting impact on reducing traffic fatalities.
Restraints
-
High maintenance and repair costs pose a significant barrier to the growth of the alcohol sensor market.
Alcohol detection systems embedded in vehicles require regular upkeep to maintain their functionality, including recalibration, servicing, and occasional replacements. The cost of maintaining such sensors can be substantial, with repairs for sensors, such as dashboard sensors, ranging from USD 250 to USD 1,000, depending on the type of sensor and vehicle model. Additionally, alcohol interlock devices—often mandated for impaired driving prevention—incur further costs, as they too require consistent servicing and recalibration. This continuous maintenance process may discourage cost-conscious consumers from adopting alcohol sensors in their vehicles. Moreover, the increasing complexity of automotive sensors, particularly digital sensors, has resulted in higher repair costs and a greater dependence on specialized professionals for maintenance, driving up expenses. As these added costs accumulate over time, vehicle owners may become reluctant to invest in alcohol detection technologies, especially in regions where affordability is a concern. This financial burden, coupled with the perceived long-term costs of sensor upkeep, slows the adoption of alcohol sensors in vehicles. To overcome this challenge, the alcohol sensor market must focus on developing more affordable sensor technologies and streamlined maintenance solutions to ensure broader consumer acceptance and integration. This will help make alcohol detection systems more accessible and reduce the financial deterrents that currently limit their adoption.
Segment Analysis
By Technology
Semiconductor oxide sensors dominates the alcohol sensor market in 2023, accounting for 36% of the market share. These sensors operate by detecting alcohol vapors using a semiconductor material that reacts with the alcohol molecules, creating a change in resistance. They are widely preferred due to their high reliability, precision, and cost-efficiency, making them ideal for applications such as breathalyzers, alcohol interlock systems, and vehicle safety features. The ability to deliver real-time, accurate measurements at affordable manufacturing costs has fueled their adoption, especially in the automotive and law enforcement sectors.
Fuel technology is the fastest-growing segment in the alcohol sensor market, with significant expansion anticipated from 2024 to 2032. This technology integrates alcohol sensors into automotive systems to detect alcohol levels in fuel mixtures, playing a key role in ensuring driver safety. Growth is being driven by regulations like the Bipartisan Infrastructure Law, which mandates alcohol detection in all new vehicles. Fuel-based alcohol sensors are crucial in preventing impaired driving by detecting blood alcohol content (BAC) in fuel samples. Advances in sensor miniaturization, improved precision, and better system integration are expected to boost the demand for fuel-based alcohol detection systems, as vehicle manufacturers increasingly adopt these technologies to meet evolving safety standards.
By Application
The vehicle controlling application segment dominates the alcohol sensor market in 2023, accounting for 59% in 2023. This dominance is primarily driven by the growing demand for safety features in vehicles, including alcohol detection systems aimed at preventing impaired driving. Alcohol sensors in vehicles are crucial for enforcing safety measures, particularly in systems like alcohol interlock devices, which prevent the vehicle from starting if the driver’s blood alcohol content (BAC) exceeds a set limit. The integration of these sensors is becoming mandatory in some regions due to regulations focused on reducing alcohol-related road accidents. With stricter laws and growing safety awareness, the vehicle controlling segment is expected to continue leading the market during the forecast period.
The healthcare application segment is expected to be the fastest growing in the Alcohol Sensor Market between 2024 and 2032. Alcohol sensors are increasingly being adopted for medical applications, such as monitoring alcohol consumption in patients, particularly those undergoing treatment for alcohol dependence or in rehabilitation centers. These sensors are used in medical devices like breath analyzers and wearable alcohol monitoring devices, helping healthcare professionals track patients’ progress in real-time. With rising concerns about alcohol abuse and its health implications, the demand for alcohol sensors in healthcare settings is anticipated to increase rapidly
Regional Analysis
North America dominates the alcohol sensor market, holding around 45% of the share in 2023, primarily due to robust regulatory frameworks, rising demand for automotive safety features, and an increasing emphasis on public health and safety. The United States is particularly influential in driving the adoption of alcohol detection systems in vehicles, supported by regulations such as the Bipartisan Infrastructure Law. Additionally, the healthcare sector in North America is increasingly incorporating alcohol sensors for medical applications, including addiction treatment and rehabilitation monitoring. This combination of regulatory support, automotive innovation, and healthcare advancements ensures that North America leads the market not only in revenue but also in product development and technological progress.
The Asia-Pacific region is the fastest-growing market for alcohol sensors, projected to experience significant growth between 2024 and 2032. This expansion is driven by the increasing demand for safety features in automotive industries, particularly in countries like China, India, Japan, and South Korea. Governments in the region are increasingly focusing on improving public safety standards, with regulations encouraging the integration of alcohol detection systems in vehicles. Additionally, the rise in alcohol-related accidents and the growing awareness of impaired driving risks are propelling market growth. Furthermore, the region's burgeoning healthcare sector is also adopting alcohol sensors for medical applications, such as addiction monitoring and treatment, contributing to the market's rapid expansion.

Need any customization research on Alcohol Sensor Market - Enquiry Now
Key Players
Some of the major Key Players in Alcohol Sensor Market along with their product:
-
Drägerwerk AG & Co. KGaA – (Dräger Alcotest series, Interlock devices)
-
Giner Labs – (Fuel Cell Alcohol Sensors, Breath Analyzers)
-
Honeywell International Inc. – (Semiconductor Alcohol Sensors, Portable Analyzers)
-
AlcoPro Inc. – (Evidential Breath Testers, AlcoMate AlcoBlow)
-
Intoximeters Inc. – (Alco-Sensor series, Intox EC/IR II)
-
BACtrack Inc. – (BACtrack Mobile Pro, BACtrack S80 Professional)
-
Lifeloc Technologies – (Phoenix 6.0, LifeGuard Interlock)
-
Abbott Laboratories – (Fuel Cell Breathalyzers, Rapid Diagnostic Alcohol Tests)
-
Alcohol Countermeasure System (International) Inc. – (ACS Alco-Screen, Interlock XT)
-
Asahi Kasei Corporation – (Semiconductor Gas Sensors, Breath Alcohol Detectors)
-
EnviteC – (Alcohol Sensors for Medical and Industrial Applications)
-
Quest Products – (Breathalyzer Disposable Tests, Keychain Testers)
-
AK GlobalTech – (ALCOSCAN Breathalyzers, Personal Alcohol Testers)
-
Zaphir Technologies – (Advanced Fuel Cell-Based Alcohol Detection Systems)
-
Pro-Tec Breathalyzers – (Professional and Portable Breathalyzers for Law Enforcement)
List of Suppliers for raw materials and components in the alcohol sensor market:
-
DuPont
-
Asahi Glass Co., Ltd.
-
NGK Insulators, Ltd.
-
BASF SE
-
Mitsubishi Chemical Corporation
-
3M
-
Johnson Matthey
-
Henkel AG & Co.
-
Hitachi Metals, Ltd.
-
Kyocera Corporation
Recent Trends
-
On August 15, 2024, a study introduced a chemiresistive ammonia gas sensor based on polyaniline/poly(vinyl alcohol) (PANI/PVA) hydrogel, offering high sensitivity and rapid response times. This innovative sensor, using micro girder printing technology and freeze-thaw cycles, demonstrates a promising solution for real-time environmental and healthcare monitoring applications.
-
On August 14, 2024, a study introduced a new antifreeze conductive organohydrogel (PGOPPy) made from carboxyl-modified polyvinyl alcohol, graphene oxide, and polypyrrole nanowires. The hydrogel maintains flexibility at temperatures as low as −75°C, offering high electrical conductivity and mechanical strength, making it suitable for use in flexible sensors in cold environments.
-
On October 4, 2024, Connecticut began testing a new alcohol detection system in vehicles aimed at preventing impaired driving. The system uses a steering wheel-mounted sensor to detect elevated carbon dioxide and ethanol levels to prevent a vehicle from starting if the driver is impaired.
| Report Attributes | Details |
| Market Size in 2023 | USD 1.78 Billion |
| Market Size by 2032 | USD 5.42 Billion |
| CAGR | CAGR of 12.74% From 2024 to 2032 |
| Base Year | 2023 |
| Forecast Period | 2024-2032 |
| Historical Data | 2020-2022 |
| Report Scope & Coverage | Market Size, Segments Analysis, Competitive Landscape, Regional Analysis, DROC & SWOT Analysis, Forecast Outlook |
| Key Segments | • By Technology (Fuel Cell Technology, Semiconductor Oxide Sensor Technology, Others) • By Application (Vehicle Controlling, Healthcare Application) • By End-users (Law Enforcement Agencies, Commercial, Individuals) |
| Regional Analysis/Coverage | North America (US, Canada, Mexico), Europe (Eastern Europe [Poland, Romania, Hungary, Turkey, Rest of Eastern Europe] Western Europe] Germany, France, UK, Italy, Spain, Netherlands, Switzerland, Austria, Rest of Western Europe]), Asia Pacific (China, India, Japan, South Korea, Vietnam, Singapore, Australia, Rest of Asia Pacific), Middle East & Africa (Middle East [UAE, Egypt, Saudi Arabia, Qatar, Rest of Middle East], Africa [Nigeria, South Africa, Rest of Africa], Latin America (Brazil, Argentina, Colombia, Rest of Latin America) |
| Company Profiles | Drägerwerk AG & Co. KGaA, Giner Labs, Honeywell International Inc., AlcoPro Inc., Intoximeters Inc., BACtrack Inc., Lifeloc Technologies, Abbott Laboratories, Alcohol Countermeasure System (International) Inc., Asahi Kasei Corporation, EnviteC, Quest Products, AK GlobalTech, Zaphir Technologies, Pro-Tec Breathalyzers. |
| Key Drivers | • Advancing Road Safety with the Growing Demand for Alcohol Detection Technologies in Vehicles |
| Restraints | • High maintenance and repair costs pose a significant barrier to the growth of the alcohol sensor market. |
Frequently Asked Questions
Ans: North America is dominating the Alcohol Sensor Market
Ans: The Alcohol Sensor Market is driven by increasing regulatory mandates for automotive safety, rising public awareness of impaired driving risks, and advancements in sensor technology.
Ans: The Alcohol Sensor Market size was valued at USD 1.78 billion in 2023.
Ans: The Alcohol Sensor market is estimated to reach USD 5.24 billion by 2032.
Ans: Alcohol Sensor Market is anticipated to expand by 12.74 % from 2024 to 2032.
Get in Touch
