Android STB and TV Market Size:
Get more information on the Android STB and TV Market - Request Sample Report
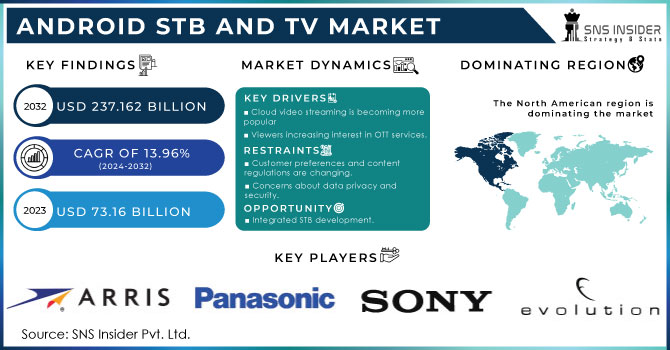
The Android STB and TV Market Size was valued at USD 73.16 billion in 2023 and is expected to reach USD 237.162 billion by 2032 and grow at a CAGR of 13.96% over the forecast period 2024-2032.
An Android STB is essentially a device that allows a television set to serve as a user interface for content delivered via the Internet, satellites, or television channels. A TV set equipped with an Android STB can also receive and decode digital television (DTV) broadcasts. The STB comes with an Android version pre-installed, allowing you to convert your regular TV into a smart TV. Aside from the growing availability of Android and Smart TVs, the prevalence of HD channels, and the increasing demand for over-the-top (OTT) services, a number of other factors may contribute to the increased adoption of Android STBs.
The rising demand for high-resolution television and the increasing prevalence of television in developing countries are key factors driving market growth. Users can use Android TV as their use of online content and high-speed internet increases. The changing lifestyle trend and rising disposable income are two factors driving market growth. Another driving factor in the market is the rising demand for IPTV and HD videos. Furthermore, technological advancements and rising consumer purchasing power are expected to drive the use of Android TV during the forecast period. However, concerns about privacy and security are impeding market growth. Over the forecast period, rising consumer awareness and demand from emerging economies are expected to provide numerous growth opportunities.
MARKET DYNAMICS:
KEY DRIVERS:
-
Cloud video streaming is becoming more popular.
-
HD channel proliferation.
-
Viewers increasing interest in OTT services.
RESTRAINTS:
-
Customer preferences and content regulations are changing.
-
Concerns about data privacy and security.
OPPORTUNITIES:
-
Integrated STB development.
-
Increased the number of viewers for high-definition channels.
-
Rising consumer demand for hybrid content will drive growth in the Android set-top box (STB) and television (TV) markets.
CHALLENGES:
-
Confusion, anxiety, and skepticism about the product among customers.
IMPACT OF COVID-19:
COVID-19 has had a severe impact on the global economy as well as all industries. To stop the plague from spreading, governments in several countries have established borders. The initial phase of the epidemic's global shutdown in many countries has had a significant influence on people's lives and quality of life. As a direct result of lockdowns imposed in many countries around the world to limit the spread of the deadly coronavirus, media demand is expected to skyrocket. Consumers are turning to popular over-the-top (OTT) service providers such as Netflix, Amazon Prime, and others, as well as renewing or upgrading their current pay-TV packages, purchasing IPTV subscriptions, and other means of meeting their desired needs, as they are forced to stay at home. As a result, online video streaming providers have benefited, and Android set-top box manufacturers have capitalized on the situation.
IMPACT OF RUSSIAN-UKRAINE WAR
Supply chain disruptions resulting from the Russia-Ukraine crisis pose significant challenges for the Android STB and TV market. Both countries are vital sources of raw materials and components used in electronics manufacturing, potentially leading to material shortages and increased production costs. Sanctions imposed on Russia may further exacerbate component shortages, particularly semiconductors, while logistical hurdles such as airspace closures could impede product distribution to key regions like Europe and Asia. Economic uncertainty stemming from the crisis may prompt consumers to reduce discretionary spending, dampening demand for Android STBs and TVs. Additionally, currency fluctuations, notably the weakening of the ruble, could raise prices for consumers in Russia, a substantial market for these products. Although the full impact remains uncertain, the combined effects of supply chain disruptions, component shortages, logistical challenges, and economic instability could adversely affect the Android STB and TV industry.
IMPACT OF ECONOMIC SLOWDOWN
During an economic slowdown, decreased consumer spending habits significantly impacted the Android STB and TV market. Consumers prioritize essential expenditures over discretionary purchases, leading to a decline in demand for these electronics, particularly high-end models. Price sensitivity increases as disposable income diminishes, favoring lower-cost options while dampening sales of premium devices. There's a shift towards subscription-based streaming services, potentially reducing the need for new hardware, especially among cord-cutters seeking cost-effective entertainment solutions. Affordability concerns drive interest in refurbished devices, potentially boosting the market for pre-owned Android STBs and TVs. The low-end market may suffer disproportionately, with budget-conscious consumers delaying or avoiding purchases altogether. To stimulate demand, manufacturers and retailers may introduce promotions, discounts, and bundled deals, while emphasizing the value proposition of their products, including affordability, content access, and integration with streaming services.
MARKET SEGMENT:
BY TYPE
The Android STB and TV market is segmented into Android STB and Android TV. An Android set-top box is a streaming device that can be plugged into a television to watch streaming services such as Netflix, Amazon Prime, and others that are typically only available on portable devices such as laptops, mobile phones, or smart TVs (STB). Android TV allows users to personalize their TV entertainment experience by utilizing software installed on mobile phones. Android TV is an Android operating system that runs on televisions and associated devices, such as video panels and media players. It can be used in standalone applications like digital video recorders (DVRs) and game consoles, as well as in products like smart TVs. Android TV is capable of streaming videos, playing games, and running other applications. There is a high demand of both Android STBs and TVs in the market. The market encompasses both Android STB and Android TV. Android STBs notably held the majority share of market revenue. These devices are experiencing rapid evolution and are increasingly favored by customers due to their diverse content offerings, immersive user experience, and extensive range of available apps. Compared to traditional STBs, Android STBs offer a more personalized experience, appealing to a broader audience base.
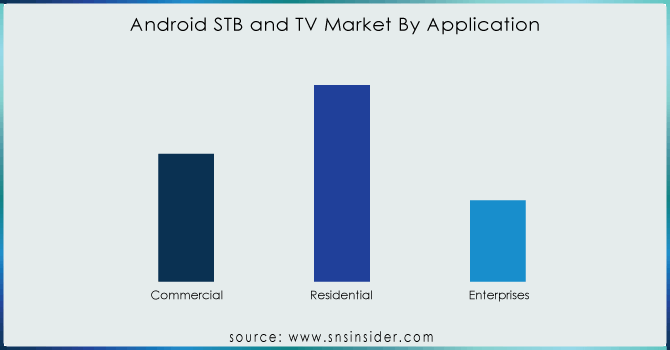
BY APPLICATION
The Android STB and TV market is segmented into Commercial, Residential, and Enterprises. Commercial segment will grow at a very high CAGR in the forecasted timeframe. The segmentation of the Android STB and TV Market by Application comprises Residential and Commercial/enterprise segments. The Residential segment notably led the market revenue. This dominance can be attributed to the substantial contribution from residential consumers, driven by increasing penetration rates and rising levels of disposable income across various regions.
Get Customized Report as per your Business Requirement - Request For Customized Report
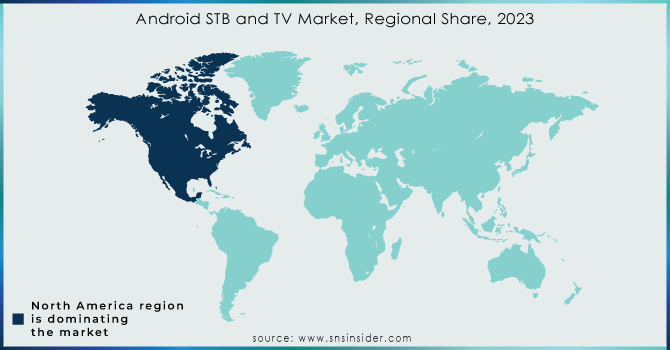
REGIONAL ANALYSIS:
The North American market for Android STB and TV is poised to lead, driven by several factors. Apart from the surging demand for Ultra-High-Definition devices and the expansion of UHD content availability, increasing consumer preferences for accessing data through premium over-the-top (OTT) platforms like Netflix and HBO Now are expected to fuel market growth in the North American region. In the European region, the Android STB and TV market holds the second-largest market share, fueled by a significant surge in television viewing transitioning from traditional formats to advanced digital media. Notably, the German Android STB and TV market leads with the largest market share, while the UK Android STB and TV market is poised for substantial growth within the European region during the projected period.
Meanwhile, in the Asia-Pacific region, the Android STB and TV Market are forecasted to experience rapid growth. This is attributed to the escalating adoption of web and smart television technologies, resulting in increased online data usage. Additionally, heightened consumer awareness regarding content digitalization in emerging markets further contributes to this growth trajectory.
KEY PLAYERS:
The key players in the android STB and TV market are Arris International, Evolution Digital, Sony Corporation, Panasonic Corporation, TCL Corporation, Haier, Hitachi, Coship, Xiaomi, Toshiba Corporation & Other Players.
RECENT DEVELOPMENT
In June 2020: Evolution Digital introduced the Evolution Device Manager (eDM), an online software-as-a-service solution designed to facilitate the deployment of their eSTREAM 4K devices by operators. This platform provides operators with a hosted environment for efficiently managing, administering, and controlling their eSTREAM 4K equipment remotely, allowing them to focus on additional responsibilities.
| Report Attributes | Details |
|---|---|
| Market Size in 2023 | USD 73.16 Billion |
| Market Size by 2031 | USD 237.162 Billion |
| CAGR | CAGR of 13.96% From 2024 to 2031 |
| Base Year | 2023 |
| Forecast Period | 2024-2031 |
| Historical Data | 2020-2022 |
| Report Scope & Coverage | Market Size, Segments Analysis, Competitive Landscape, Regional Analysis, DROC & SWOT Analysis, Forecast Outlook |
| Key Segments | • By Type (Android STB, Android TV) • By Distribution Channel (Online, Offline) • By Application (Commercial, Residential, Enterprises) |
| Regional Analysis/Coverage | North America (US, Canada, Mexico), Europe (Eastern Europe [Poland, Romania, Hungary, Turkey, Rest of Eastern Europe] Western Europe] Germany, France, UK, Italy, Spain, Netherlands, Switzerland, Austria, Rest of Western Europe]), Asia-Pacific (China, India, Japan, South Korea, Vietnam, Singapore, Australia, Rest of Asia-Pacific), Middle East & Africa (Middle East [UAE, Egypt, Saudi Arabia, Qatar, Rest of Middle East], Africa [Nigeria, South Africa, Rest of Africa], Latin America (Brazil, Argentina, Colombia, Rest of Latin America) |
| Company Profiles | Arris International, Evolution Digital, Sony Corporation, Panasonic Corporation, TCL Corporation, Haier, Hitachi, Coship, Xiaomi and Toshiba Corporation. |
| Key Drivers | • Cloud video streaming is becoming more popular. • HD channel proliferation. |
| RESTRAINTS | • Customer preferences and content regulations are changing. • Concerns about data privacy and security. |
Frequently Asked Questions
The Android STB and TV Market was valued at USD 73.16 billion in 2023.
The expected CAGR of the global Android STB and TV Market during the forecast period is 13.96%.
The Asia-Pacific region is anticipated to record the Fastest Growing in the Android STB and TV Market.
The Android STB segment is leading in the market revenue share in 2023.
The North America region with the Highest Revenue share in 2023.
Get in Touch
