Smart Set-Top Box Market Size & Overview:
Get more information on Smart Set-Top Box Market - Request Sample Report
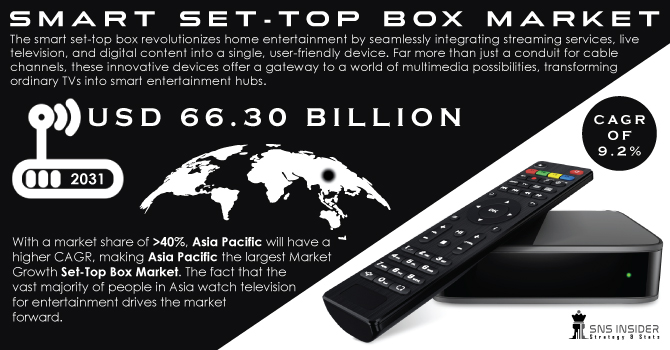
The Smart Set-Top Box Market Size was valued at USD 32.69 Billion in 2023 and is expected to reach USD 66.30 billion by 2032, and grow at a CAGR of 9.2% over the forecast period 2024-2032.
The Smart Set-Top Box market growth is associated with several demographic’s trends. While a growing global appetite for on-demand video content projected to reach an 86.3% of viewers by 2027 and the rise of smart homes anticipated to reach 310.6 million households by 2025 bode well for its future, the market must contend with opposing forces. Government initiatives promoting digital TV transitions, particularly in developing economies with high television penetration rates India, for instance, boasts over 200 million TV households, will likely create a surge in demand for STBs in the near future.
However, this growth might be dampened by the increasing popularity of Smart TVs, which offer similar functionalities without the need for an external device. With global Smart TV shipments expected to reach 205.6 million units in 2025 alone, the market needs to focus on innovation and value addition. Integration of advanced features like voice search, support for higher resolutions (8K and beyond), and seamless integration with smart home ecosystems will be crucial to differentiate Smart Set-Top Boxes and secure their place in the living rooms of tomorrow.
MARKET DYNAMICS:
KEY DRIVERS:
-
Digital broadcasting industry
-
The rise of the smart home and its interconnected devices is fuelling the smart set-top box market.
Consumers are increasingly ditching cable subscriptions for an excess of Over-the-Top (OTT) streaming services offering vast libraries of content on-demand. Smart set-top boxes bridge the gap between traditional TVs and this new wave of entertainment, transforming any television into a portal to these services. These devices go beyond simply delivering content, boasting features like voice search powered by Artificial Intelligence for effortless navigation, and integration with smart home ecosystems, allowing control of lights or thermostats right from the couch. The affordability of smart set-top boxes compared to smart TVs makes them an attractive option for budget-conscious consumers seeking an upgrade in their viewing experience. This confluence of factors - the shift towards OTT, the allure of smart home integration, and competitive pricing - is promoting the smart set-top box market forward.
RESTRAINTS:
-
Easy subscription
-
Ott services providing advance services
-
Video quality
OPPORTUNITIES:
-
Collaboration with the OTT platforms
-
New smart Set-Top Box features
-
High-quality video
This integrated approach not only strengthens the position of STBs in the face of smart TV dominance but also fuels subscriber growth for OTT platforms by providing a wider reach and a user-friendly gateway to their content. This collaboration between STB manufacturers and OTT platforms is poised to revolutionize the home entertainment landscape, offering viewers unparalleled flexibility and control over their content consumption
CHALLENGES:
-
OTT platforms
-
Online streaming services
-
New features in the Smart set-box devices
IMPACT OF RUSSIA UKRAINE WAR:
The conflict has led to disruptions in global supply chains affecting the availability of components essential for smart set-top boxes, such as semiconductors and microchips. Delays in manufacturing and increased lead times for components due to sanctions on Russia and logistical challenges. The crisis has contributed to rising costs of raw materials and components, driven by scarcity and increased shipping costs. Manufacturers may face higher production costs, which could be passed on to consumers, leading to increased retail prices. Economic sanctions imposed on Russia by Western countries, including technology export restrictions, affect market strategies of global set-top box manufacturers. Companies might need to reevaluate their market strategies based on the geopolitical landscape and realign their business strategies to mitigate risks associated with the conflict. Potential increased interest in diversifying supply sources and manufacturing locations to reduce future risks.
IMPACT OF ECONOMIC SLOWDOWN:
Economic uncertainty often leads to decreased consumer spending on non-essential goods, including entertainment devices like smart set-top boxes. Potential decline in new subscriptions and upgrades as consumers prioritize essential expenses over entertainment. Increased competition as companies strive to capture or maintain their market share by offering promotions, discounts, or value-added services. A possible shift towards more cost-effective models or brands by consumers looking to economize. Economic policies and government stimulus measures could indirectly affect the market, either by boosting consumer spending through direct support or by imposing new regulations and tariffs that could increase costs. Stricter energy efficiency standards and e-waste regulations could affect product designs and compliance costs. Smaller companies or those heavily impacted by the economic downturn may face exit barriers, leading to consolidation in the market with larger players acquiring smaller competitors. Consolidation can lead to less competition, potentially affecting consumer choice and pricing.
MARKET ESTIMATION:
By PRODUCT:
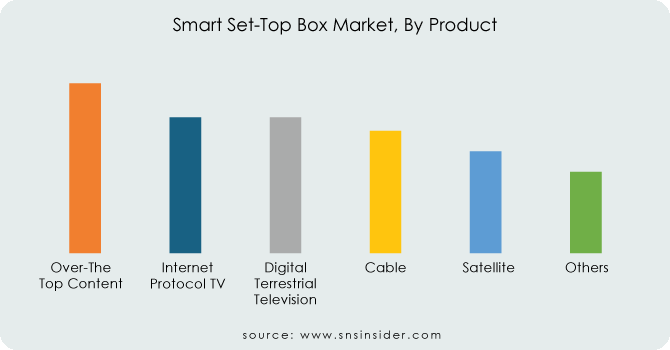
Over-the-top (OTT) content delivery, driven by giants like Netflix and Disney+, is projected to be the fastest-growing segment, capturing around 25% of the market share by 2030 due to its affordability and on-demand content. Internet Protocol TV (IPTV), offered by internet service providers, holds a sizeable chunk at roughly 20%, appealing to users with bundled packages. Traditional options like Cable and Satellite, while still significant, are anticipated to see a decline, settling around 18% and 15% respectively, as cord-cutting becomes more prevalent. Digital Terrestrial Television (DTT) provides to specific regions and is expected to maintain a steady 10% share. Finally, a niche segment of "Others" holding the share of 12% includes specialty boxes for gaming, virtual reality, and emerging technologies. This breakdown highlights the evolving consumer preference for flexible and user-centric content delivery methods in the smart set-top box market.
BY QUALITY:
Segmenting the smart set-top box market by quality reveals distinct consumer preferences. 4K resolution dominates the segment, likely capturing around 50% of the market share. This dominance can be attributed to the exceptional viewing experience it offers, with its sharp picture and vibrant colors. Following closely behind is High Definition (HD), estimated to hold around 35% of the market. HD remains a popular choice due to its affordability and still providing a significant step up from standard definition. Finally, Standard Definition (SD) makes up the remaining 15% of the market share. While its picture quality falls short compared to its higher-resolution counterparts, SD caters to budget-conscious consumers and may still be found in older television sets.
By END-USER:
The market is segmented into commercial and residential segments based on the end user segment. Residents make the most of their set-top box and television. The residential sector had a market value of 15%, and it is projected that half of the dwellings will outnumber the commercial segment over time.
MARKET SEGMENTATION:
By Product
-
Over-The-Top Content
-
Internet Protocol TV
-
Digital Terrestrial Television
-
Cable
-
Satellite
-
Others
Get Customized Report as per your Business Requirement - Request For Customized Report
By Service
-
High-Speed Internet Television
-
Video on Demand
-
Managed Service
-
Repairing
-
Screening
-
Interaction Services
-
Video Conferencing
-
Testing
By Quality
-
4k
-
High Definition
-
Standard Definition
By End - User
-
Commercial
-
Residential
REGIONAL ANALYSIS:
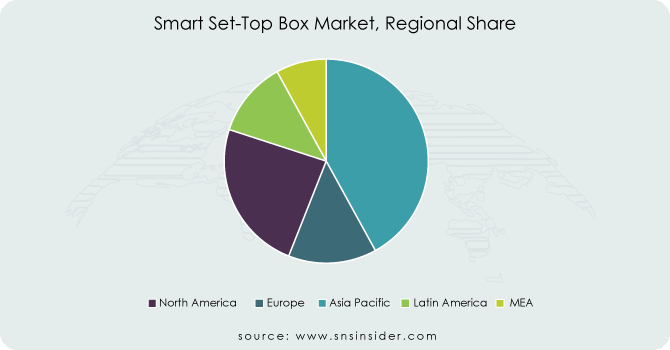
The market for smart set-top boxes is being researched in Europe, Asia Pacific, North America, and other regions. With a market share of 40%, Asia Pacific will have a higher CAGR, making Asia Pacific the largest Market Growth Set-Top Box Market. The fact that the vast majority of people in Asia watch television for entertainment drives the market forward. Top boxes for entertainment are common in countries like India and China. The box office market is being boosted by high-end clear viewing and smart and digital-enabled TVs. The existence of various smart box firms in India, as well as the use of smart televisions in the region, as well as the population of the country, are driving up market demand. Other regions contribute to the market as well.
REGIONAL COVERAGE:
North America
-
US
-
Canada
-
Mexico
Europe
-
Eastern Europe
-
Poland
-
Romania
-
Hungary
-
Turkey
-
Rest of Eastern Europe
-
-
Western Europe
-
Germany
-
France
-
UK
-
Italy
-
Spain
-
Netherlands
-
Switzerland
-
Austria
-
Rest of Western Europe
-
Asia Pacific
-
China
-
India
-
Japan
-
South Korea
-
Vietnam
-
Singapore
-
Australia
-
Rest of Asia Pacific
Middle East & Africa
-
Middle East
-
UAE
-
Egypt
-
Saudi Arabia
-
Qatar
-
Rest of the Middle East
-
-
Africa
-
Nigeria
-
South Africa
-
Rest of Africa
-
Latin America
-
Brazil
-
Argentina
-
Colombia
-
Rest of Latin America
KEY PLAYERS:
The Key players in Smart Set-Top Box Market are EchoStar Corporation, Samsung group, Apple Inc., ARRIS International PLC., Sagemcom SAS, Kaonmedia Co.Ltd, Vishay Intertechnology Inc., Google LLC, Commscope,, Coship Electronics Co. Ltd., Huawei, Sagemcom SAS, Technicolor SA, Advanced Digital Broadcast (ADB) and Other.
RECENT DEVELOPMENTS:
-
Samsung: Expanded their 2022 TV line-up with the launch of Samsung OLED in Australia, potentially impacting the need for standalone set-top boxes.
-
SK Broadband: Introduced AI Sound Max set-top box featuring AI-powered voice control and improved audio technology.
-
Commscope: Provided Evoca with the latest generation of Android TV-powered set-top boxes with built-in tuners, providing to the growing demand for hybrid broadcast and streaming experiences.
EchoStar Corporation-Company Financial Analysis
| Report Attributes | Details |
|---|---|
| Market Size in 2023 | US$ 32.69 Billion |
| Market Size by 2032 | US$ 66.30 Billion |
| CAGR | CAGR of 9.2% From 2024 to 2032 |
| Base Year | 2023 |
| Forecast Period | 2024-2032 |
| Historical Data | 2020-2022 |
| Report Scope & Coverage | Market Size, Segments Analysis, Competitive Landscape, Regional Analysis, DROC & SWOT Analysis, Forecast Outlook |
| Key Segments | • By Product (Over- The- Top Content, Internet Protocol TV, Digital Terrestrial Television, Cable, Satellite, Others) • By Service (High-Speed Internet Television, Video On Demand, Managed Service, Repairing, Screening, Interaction Services, Video Conferencing, Testing) By Quality (4k, High Definition, Standard Definition) • By End-User (Commercial, Residential) |
| Regional Analysis/Coverage | North America (US, Canada, Mexico), Europe (Eastern Europe [Poland, Romania, Hungary, Turkey, Rest of Eastern Europe] Western Europe] Germany, France, UK, Italy, Spain, Netherlands, Switzerland, Austria, Rest of Western Europe]), Asia Pacific (China, India, Japan, South Korea, Vietnam, Singapore, Australia, Rest of Asia Pacific), Middle East & Africa (Middle East [UAE, Egypt, Saudi Arabia, Qatar, Rest of Middle East], Africa [Nigeria, South Africa, Rest of Africa], Latin America (Brazil, Argentina, Colombia, Rest of Latin America) |
| Company Profiles | EchoStar Corporation, Samsung group, Apple Inc., ARRIS International PLC., Sagemcom SAS, Kaonmedia Co.Ltd, Vishay Intertechnology Inc., Google LLC, Commscope |
| Key Drivers | • Smart television • Digital broadcasting industry |
| RESTRAINTS | • Easy subscription • Ott services providing advance services |
Get in Touch
