Articulated Robot Market Report Scope & Overview:
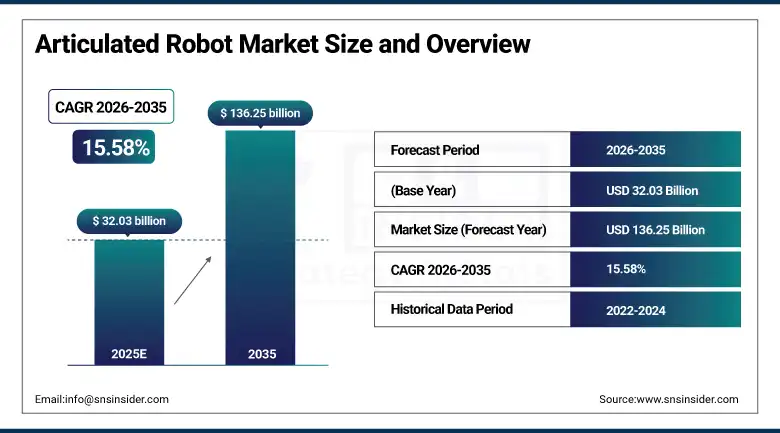
The Articulated Robot Market Size was valued at USD 32.03 billion in 2025 and is expected to reach USD 136.25 billion by 2035, growing at a CAGR of 15.58% from 2026–2035.
The global articulated robot’s industry is currently seeing strong and increasing growth trends due to the combination of increasing labor costs, labor shortages, requirements for high product quality and the gradual introduction of artificial intelligence and IoT in robot systems that make articulated robot automation the de facto manufacturing approach in an ever-increasing number of industries.
Market Size and Forecast
-
Market Size in 2025: USD 32.03 Billion
-
Market Size by 2035: USD 136.25 Billion
-
CAGR: 15.58% from 2026 to 2035
-
Base Year: 2025
-
Forecast Period: 2026–2035
-
Historical Data: 2022–2024
To Get more information On Articulated Robot Market - Request Free Sample Report
Articulated Robot Market Trends
-
Rapid integration of AI-powered vision systems and machine learning-based adaptive control into articulated robots, enabling bin picking, random part recognition, weld seam tracking, and quality inspection capabilities that extend robot application to unstructured manufacturing environments where part position and orientation variability previously prevented robot deployment.
-
Growing adoption of collaborative articulated robots with ISO 10218 and ISO/TS 15066 safety-certified force and speed limiting systems that allow safe operation alongside human workers without physical safety guarding, expanding robot deployment to small batch production, flexible assembly, and quality inspection tasks in facilities where dedicated robot cells are impractical.
-
Accelerating EV manufacturing automation investment driving strong demand for articulated robots in battery cell handling, module assembly, pack sealing, and final vehicle assembly operations where the higher precision and repeatability requirements of EV production relative to conventional vehicle assembly demand advanced robot solutions.
-
Rising adoption of mobile manipulation platforms combining articulated robot arms with autonomous mobile robot bases, enabling flexible manufacturing cells that can be repositioned to serve different production stations or product configurations without fixed infrastructure investment.
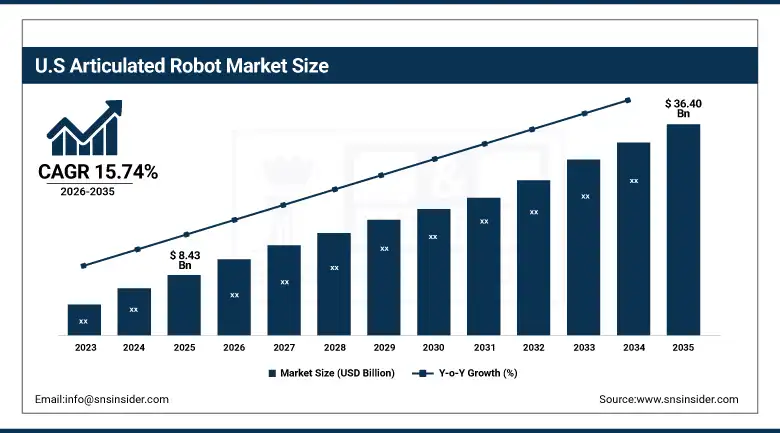
U.S. Articulated Robot Market Size Outlook:
The U.S. Articulated Robot Market was valued at USD 8.43 billion in 2025 and is expected to reach USD 36.40 billion by 2035, growing at a CAGR of 15.74% during 2026–2035. The U.S. is one of the most dynamic articulated robot markets in the world after Asia because of reshoring manufacturing operations driven by tariffs, needs for supply chain resilience post-COVID-19 disruption, and manufacturing incentives provided by the Inflation Reduction Act.
In May 2024, ABB launched the IRB 7710 and IRB 7720 robots adding 16 variants to its modular large robot portfolio with up to 30% lower energy consumption, designed for payloads of 70 to 620 kg targeting automotive, EV, logistics, and high-precision manufacturing applications.
Articulated Robot Market Segmentation Analysis
-
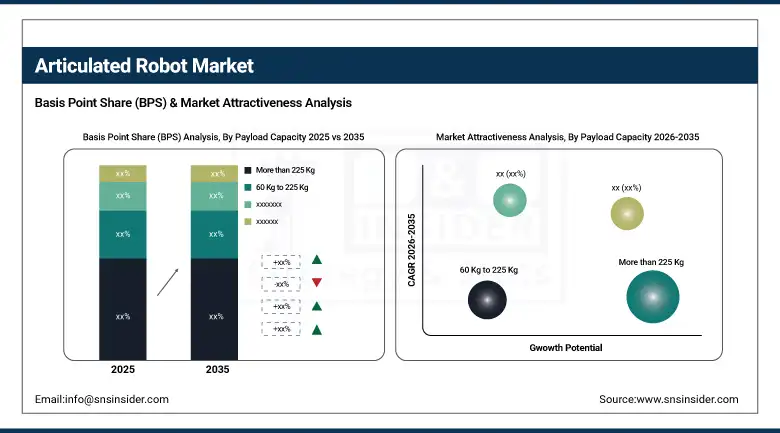
According to Payload Capacity, the More than 225 Kg segment dominated with substantial market share in 2025 due to its essential role in heavy-duty automotive, metal, and machinery applications; Up to 16 Kg is the fastest-growing payload segment driven by rising demand from electronics, food and beverage, and pharmaceuticals sectors.
-
In terms of Function, Welding dominated with approximately 31.5% market share in 2025; Dispensing is the fastest-growing function driven by demand in electronics, pharmaceuticals, and packaging where precise adhesive, sealant, and coating application is critical.
-
By Component, Robot Arm dominated with approximately 36.4% market share in 2025 as the core structural and kinematic framework of every articulated robot system; End Effector is the fastest-growing component driven by demand for advanced, task-specific tooling across high-precision applications.
-
By End-Use Industry, Automotive dominated with approximately 39.4% market share in 2025; Pharmaceuticals and Cosmetics is the fastest-growing industry vertical driven by cleanroom automation, sterile handling, and regulatory compliance requirements.
By Payload Capacity: More than 225 Kg dominates, Up to 16 Kg grows fastest
The More than 225 kg payload category accounted for the largest revenue share in addition to the highest global market share, owing to the critical importance of large frame, high payload articulated robots in the automotive, metal and machinery, and heavy industrial manufacturing segments, which entail lifting, positioning, and welding the largest parts in production lines. Welding automotive body-in-white, handling engine blocks and cylinder heads, press tending for large metal stampings, and handling of structural aerospace parts are some applications that demand high payload robots with positional accuracy under dynamic loading conditions.
The Up to 16 Kg payload segment is projected to grow at the fastest CAGR through 2035, driven by rapidly expanding adoption of lightweight, compact, and flexible articulated robots in electronics assembly, food and beverage handling, pharmaceutical packaging, and laboratory automation applications. Light-payload articulated robots in the 3 to 16 kg range are particularly attractive to SME manufacturers because their lower capital cost, smaller footprint, simplified safety compliance, and ease of redeployment between tasks provide robot automation economics that work for batch production environments where large-frame dedicated robot cells are impractical.
By Function: Welding dominates, Dispensing grows fastest
The Welding function segment dominated the Articulated Robot Market in 2025 with approximately 31.5% of global revenues, driven by its indispensable role in automotive and metalworking manufacturing where robotic welding provides the combination of speed, consistency, and quality that makes modern vehicle and metal goods production economically viable. Automotive body-in-white resistance spot welding, exhaust system MIG welding, and structural frame arc welding are each characterised by weld cycles numbering in the millions per production year, where the consistency of robot welding produces measurably better quality outcomes than human welders while operating at throughput rates that no human workforce can sustain.
The Dispensing function is projected to grow at the fastest CAGR through 2035, driven by expanding adoption in electronics manufacturing, pharmaceutical production, and industrial packaging where precise application of adhesives, sealants, potting compounds, and coatings is a quality-critical process that benefits enormously from robot dispensing's consistency relative to manual application. In electronics manufacturing, robots dispense thermal interface materials, underfill adhesives, and conformal coatings on printed circuit boards with micrometer-level positional accuracy that ensures every component receives precisely the correct material volume at the correct location, eliminating the yield losses that process variability in manual dispensing creates.
By Component: Robot Arm dominates, End Effector grows fastest
The Robot Arm segment dominated the Articulated Robot Market component segment in 2025 with approximately 36.4% of revenues, reflecting the robot arm's status as the core structural and kinematic asset of every articulated robot system, integrating the joint actuators, encoders, wiring, and structural members that determine the robot's reach envelope, payload capacity, speed, and fundamental positional accuracy. Robot arm procurement represents the primary capital investment decision in any robot system acquisition, and the continuous improvement of robot arm mechanical performance, energy efficiency, and maintenance lifetime across successive product generations sustains premium pricing that generates the segment's dominant revenue contribution.
End Effectors are projected to grow at the fastest component CAGR through 2035, driven by the expanding application diversity of articulated robots into new manufacturing sectors where standard grippers are insufficient and application-specific tooling must be designed to handle the unique geometric, material, and process requirements of each new application.
By End-Use Industry: Automotive dominates, Pharmaceuticals and Cosmetics grows fastest
The Automotive end-use industry dominated the Articulated Robot Market in 202 with approximately 39.4% of global revenues, reflecting the automotive industry's multi-decade position as the world's most intensive industrial robot user and the fundamental structural dependence of modern vehicle manufacturing on articulated robot automation across welding, painting, assembly, and material handling. A typical automotive body manufacturing plant deploys hundreds to thousands of articulated robots per facility, with global automotive production at approximately 90 million vehicles per year representing an enormous and continuously renewing base demand for robot systems.
Pharmaceuticals and Cosmetics is projected to grow at the fastest end-use industry CAGR through 2035, driven by the pharmaceutical industry's combination of regulatory requirements mandating contamination-controlled automated manufacturing processes and the rapid expansion of biological drug production, gene therapy manufacturing, and advanced drug delivery system assembly that demands robotic automation at scales and precision levels that human operators cannot achieve within validated pharmaceutical quality systems.
Articulated Robot Market Regional Insights
|
Region |
Major Country |
Share within Region (%) |
|---|---|---|
|
North America |
United States |
78% |
|
Europe |
Germany |
38% |
|
Asia Pacific |
China |
52% |
|
Middle East & Africa |
UAE |
28% |
|
Latin America |
Brazil |
44% |
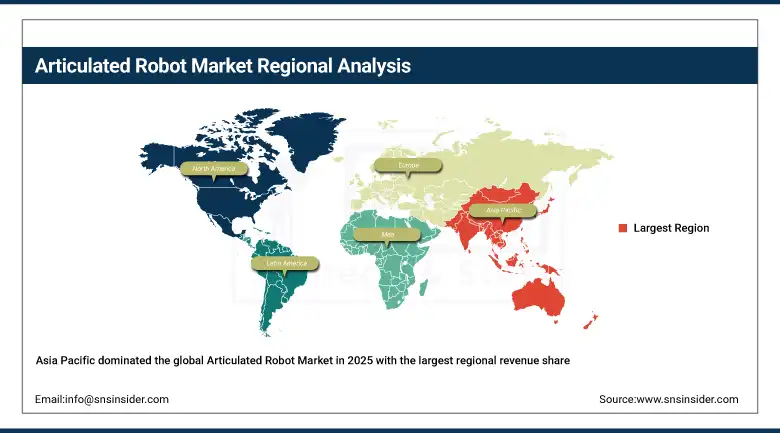
Asia Pacific Articulated Robot Market Insights
Asia Pacific dominated the global Articulated Robot Market in 2025 with the largest regional revenue share and is projected to grow at the fastest regional CAGR of approximately 16.45% through 2035, driven by rapid industrialisation, persistent labour shortages in manufacturing sectors, and government-backed Industry 4.0 smart manufacturing initiatives across China, Japan, South Korea, and increasingly across Southeast Asian manufacturing hubs. China dominates Asia Pacific robot consumption through its world-leading manufacturing scale across electronics, automotive, metal goods, and appliance production, and its government-mandated smart manufacturing programme that is driving robot density increases across Chinese factories toward international best-practice levels. Japan is a world leader in robot technology development, with FANUC, Yaskawa, and Kawasaki among the world's most technically advanced articulated robot manufacturers.
Get Customized Report as per Your Business Requirement - Enquiry Now
North America Articulated Robot Market Insights
North America represents a significant and rapidly growing articulated robot market anchored by the United States, which accounted for approximately 78% of North American revenues in 2025. The U.S. market is driven by reshoring manufacturing investment stimulated by tariff policies and IRA incentives, EV production expansion requiring advanced robot automation, semiconductor fab construction under the CHIPS Act, and aerospace and defence manufacturing growth. Rising U.S. labour costs relative to robot economics and the structural improvement in robot ease-of-use and programming accessibility are making robot automation viable for an expanding range of U.S. manufacturing sectors.
Europe Articulated Robot Market Insights
Europe represents a technically sophisticated articulated robot market anchored by Germany's world-class automotive and mechanical engineering manufacturing sectors, combined with Italy's machine tool and food processing industries, France's aerospace and defence manufacturing, and Sweden's precision engineering sector. Germany leads European robot density with some of the world's highest industrial robot installations per manufacturing employee, and the EU's focus on sustainable manufacturing and digital factory programmes is sustaining robot investment across European manufacturing. KUKA's German engineering leadership and ABB's European headquarters in Switzerland provide the region with world-class robot technology development anchored domestically.
Latin America and MEA Articulated Robot Market Insights
Latin America and MEA are growing articulated robot markets, driven by manufacturing sector modernisation and foreign direct investment in automated production facilities. Brazil leads Latin American robot adoption at approximately 44% of regional revenues through its large automotive and food and beverage manufacturing sectors, with growing adoption in Brazil's rapidly expanding EV manufacturing investment under the government's Mover programme. MEA robot adoption is growing through UAE's advanced manufacturing investment under Vision 2030 and Saudi Arabia's manufacturing sector development programme aiming to diversify the economy beyond petroleum through industrial automation.
Market Dynamics:
Growth Drivers: Rising labour costs and labour shortages combined with AI and vision integration expanding robot application breadth across new industry verticals
The primary structural growth drivers for the Articulated Robot Market are the permanently elevated labour costs in manufacturing sectors across developed and developing markets combined with demographic labour supply constraints that cannot be resolved without automation substitution, and the progressive integration of AI vision systems, adaptive control, and collaborative safety features that is continuously expanding the range of manufacturing tasks and industry sectors where articulated robot automation is technically viable and economically superior to human-operated alternatives. The EV manufacturing transition, semiconductor fab construction, and pharmaceutical manufacturing compliance investment are simultaneously creating new, high-value robot demand categories that supplement the automotive welding and handling applications that have historically anchored the market.
Yaskawa Electric Corporation's January 2025 unveiling of a new articulated robot model optimised for multi-axis operations in precision industries, combined with ABB's May 2024 launch of the IRB 7710 and IRB 7720 with up to 30% lower energy consumption for automotive, EV, and high-precision manufacturing applications, demonstrate the extraordinary innovation velocity across the articulated robot market where every annual product generation delivers measurably improved performance specifications that expand the robot's competitive advantage over human labour in an ever-wider range of manufacturing applications through the 2026 to 2035 forecast period.
Restraints: High upfront capital cost, programming and integration complexity, and safety certification requirements limiting adoption among SMEs and in new application areas
A significant restraint on the Articulated Robot Market is the substantial upfront capital investment required for complete articulated robot system procurement and integration, encompassing robot hardware, end effector tooling, safety guarding, integration engineering, programming, and commissioning that collectively can represent USD 100,000 to USD 500,000 per robot work cell for complex applications. For SME manufacturers with limited capital budgets and conservative investment approval processes, the payback period calculations for robot automation must be clearly positive within 2 to 3 years for investment to be approved, which limits adoption to high-volume, consistent applications where robot utilisation will be sufficient to justify the fixed capital cost. Safety certification and workspace risk assessment for collaborative robot deployments adds complexity and timeline to installation programmes, slowing deployment velocity particularly in regulated industries including food, pharmaceutical, and medical device manufacturing.
Opportunities: SME market expansion through collaborative robots and robot-as-a-service, EV manufacturing automation investment, and pharmaceutical cleanroom robot deployment
The vast global SME manufacturing population represents the largest underpenetrated articulated robot market segment, where collaborative robot models in the 3 to 16 kg payload class and robot-as-a-service subscription models are progressively making robot automation accessible to manufacturers without large capital budgets or specialised robot engineering teams. EV manufacturing is creating the most concentrated near-term growth opportunity in the articulated robot market, as battery module assembly, pack sealing, thermal management component handling, and motor winding operations all require advanced robot automation at the scale of global EV production programmes that are simultaneously investing hundreds of billions of dollars in new manufacturing capacity. Pharmaceutical cleanroom robot deployment is a premium growth opportunity where the contamination control and regulatory validation advantages of robot automation over human operators command meaningful per-application ROI premiums that justify investment even at modest production volumes.
Recent Developments:
-
May 2024: ABB launched the IRB 7710 and IRB 7720 robots adding 16 variants to its modular large robot portfolio, achieving up to 30% lower energy consumption and targeting payloads of 70 to 620 kg for automotive, EV, logistics, and high-precision manufacturing applications.
-
January 2025: Yaskawa Electric Corporation unveiled a new articulated robot model optimised for multi-axis operations in precision industries, advancing competitive capabilities in high-precision assembly, inspection, and handling applications across electronics and semiconductor manufacturing.
-
2025: FANUC Corporation expanded its CRX collaborative robot series with enhanced AI vision capabilities and extended payload range, addressing growing demand from food and beverage, pharmaceutical, and SME manufacturers seeking safe human-robot collaboration without dedicated safety guarding infrastructure.
Articulated Robot Companies are:
-
ABB Ltd.
-
KUKA AG (Midea Group)
-
Yaskawa Electric Corporation
-
Kawasaki Heavy Industries Ltd.
-
Mitsubishi Electric Corporation
-
Nachi-Fujikoshi Corporation
-
Epson Robots (Seiko Epson)
-
Stäubli International AG
-
Universal Robots A/S (Teradyne)
-
Comau S.p.A. (Stellantis)
-
Omron Corporation
-
Yamaha Motor Co. Ltd.
-
OTC Daihen Corporation
-
KION Group AG (STILL)
-
Techman Robot Inc.
-
AUBO Robotics Co. Ltd.
-
Doosan Robotics Inc.
-
Kassow Robots ApS
Articulated Robot Market Report Scope:
| Report Attributes | Details |
|---|---|
| Market Size in 2025 | USD 32.03 Billion |
| Market Size by 2035 | USD 136.25 Billion |
| CAGR | CAGR of 15.58% From 2026 to 2035 |
| Base Year | 2025 |
| Forecast Period | 2026-2035 |
| Historical Data | 2022-2024 |
| Report Scope & Coverage | Market Size, Segments Analysis, Competitive Landscape, Regional Analysis, DROC & SWOT Analysis, Forecast Outlook |
| Key Segments | • By Payload Capacity (Up to 16 Kg, 16 Kg to 60 Kg, 60 Kg to 225 Kg, More than 225 Kg) • By Function (Welding, Material Handling, Assembly, Dispensing, Painting and Coating, Others) • By Component (Robot Arm, End Effector, Controller, Drive, Sensor, Others) • By End-Use Industry (Automotive, Electronics and Semiconductor, Food and Beverage, Pharmaceuticals and Cosmetics, Metal and Machinery, Others) |
| Regional Analysis/Coverage | North America (US, Canada), Europe (Germany, UK, France, Italy, Spain, Russia, Poland, Rest of Europe), Asia Pacific (China, India, Japan, South Korea, Australia, ASEAN Countries, Rest of Asia Pacific), Middle East & Africa (UAE, Saudi Arabia, Qatar, South Africa, Rest of Middle East & Africa), Latin America (Brazil, Argentina, Mexico, Colombia, Rest of Latin America). |
| Company Profiles | FANUC Corporation; ABB Ltd.; KUKA AG (Midea Group); Yaskawa Electric Corporation; Kawasaki Heavy Industries Ltd.; Mitsubishi Electric Corporation; Denso Corporation; Nachi-Fujikoshi Corporation; Epson Robots (Seiko Epson); Stäubli International AG; Universal Robots A/S (Teradyne); Comau S.p.A. (Stellantis); Omron Corporation; Yamaha Motor Co. Ltd.; OTC Daihen Corporation; KION Group AG (STILL); Techman Robot Inc.; AUBO Robotics Co. Ltd.; Doosan Robotics Inc. |
Frequently Asked Questions
Ans: Asia Pacific dominated the Articulated Robot Market in 2025 with the largest revenue share and is also projected to grow at the fastest regional CAGR of approximately 16.45% through 2035, anchored by China's world-leading manufacturing scale and government Industry 4.0 mandates, Japan's world-class robot technology development, and rapidly industrialising Southeast Asian manufacturing hubs adopting automation to compete on quality and cost.
Ans: Pharmaceuticals and Cosmetics is expected to grow at the fastest end-use industry CAGR through 2035.
Ans: Welding dominated the Articulated Robot Market in 2025 with approximately 31.5% of global revenues.
Ans: The Articulated Robot Market was valued at USD 32.03 billion in 2025.
Ans: The Articulated Robot Market is expected to grow at a CAGR of 15.58% from 2026 to 2035.
Get in Touch
