Asphalt Additive Market Size Analysis:
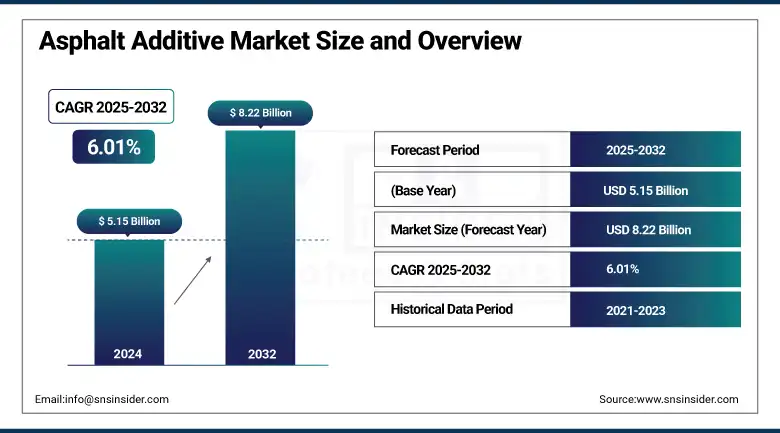
The Asphalt Additive Market size was valued at USD 5.15 billion in 2024 and is expected to reach USD 8.22 billion by 2032, growing at a CAGR of 6.01% over the forecast period of 2025-2032.
The asphalt additive market is gaining momentum due to the increasing demand for durable, sustainable infrastructure. Trends in the asphalt modifiers market show a growing focus on sustainable solutions, which drive the development of environmentally benign binder innovations, including bio-based rejuvenators and polymer blends, to enhance performance and longevity while minimizing required maintenance. Road construction chemicals are boosted by warm mix asphalt, facilitated by asphalt binder additives that are being promoted by asphalt additive companies. Additionally, key players in the industry are capitalizing on digital quality tools and lifecycle analysis to optimize the growth of the asphalt additive market share, and to improve project performance.
To Get more information On Asphalt Additive Market - Request Free Sample Report
According to the National Asphalt Pavement Association, reclaimed asphalt pavement constituted 21.9% of the asphalt mixture in 2021. This temperature reduction in the average warm mix asphalt mixture (23.5 °F) will lead to a decrease in fuel consumption by 20%–35% (Federal Highway Administration [FHWA]). These evolving trends have played a prominent role in the market analysis of asphalt additives, which is poised to gain popularity worldwide in regions concentrating on sustainable and innovative development and innovation.

Asphalt Additive Market Drivers:
-
Surge in Federal Infrastructure Funding Under the Infrastructure Investment and Jobs Act Enhances Demand for Asphalt Additives
The Infrastructure Investment and Jobs Act provides more than USD 350 billion in the 2022-2026 timeframe for highways, generating demand for leading asphalt technology. There are now asphalt additive companies that have developed polymer modifiers, anti-strip agents, and rejuvenators that have demonstrated an ability to increase the longevity of pavement. These products contribute to green design, decreasing maintenance, and replacement costs. Key industry participants are entering into strategic partnerships with the state DOTs to use advanced road construction chemicals. This policy backing plays a vital role in boosting the growth of the asphalt additive market due to continued investments in long-lasting and eco-friendly materials. Public–private partnerships are driving the asphalt modifier market share in the U.S. federally funded projects.
-
Adoption of Warm Mix Asphalt Technologies Accelerates Sustainable Road Construction Practices
Asphalt mixtures have been developed as the use of warm-mixing technologies rises, because they can decrease emissions and energy consumption. Warm mix asphalt reduces production temperatures by 23.5°F and decreases fuel consumption by 20%–35%, according to the Federal Highway Administration. This not only creates safer work areas but also supports the green building movement. Trends in the asphalt modifiers industry are witnessing an increasing demand for chemical foaming agents and bio-based additives to improve mix performance. Asphalt additive companies are developing asphalt binder additives specifically for warm mix applications. The dynamics also reflect solid growth in the asphalt additives market, driven by sustainability targets and an expanding demand for low-temperature paving in public infrastructure.
Asphalt Additive Market Restraints:
-
Volatile Crude Oil Prices Impose Cost Uncertainties on Asphalt Additive Production
Asphalt modifiers feedstock is petrochemical-based and viscous elastic, thus susceptible to crude oil price changes. Such price fluctuations can elevate the price of rubber and polymer-modified asphalt binders, thereby undermining price stability for manufacturers and developers. However, in a higher oil price scenario, asphalt additive companies could cut investment, or even raise prices, which in turn affects procurement budgets for infrastructure projects. This volatility can be problematic for planning purposes, especially for method processes where the heating and/or cooling admixtures used are not typical mixtures. Asphalt additives, fluctuating prices of oil are volatile and unpredictable, which can affect the growth of the asphalt additive market in the case of public projects, where cost predictability is very important for approval and allocation of funding for the project.
Asphalt Additive Market Segmentation Analysis:
By Type
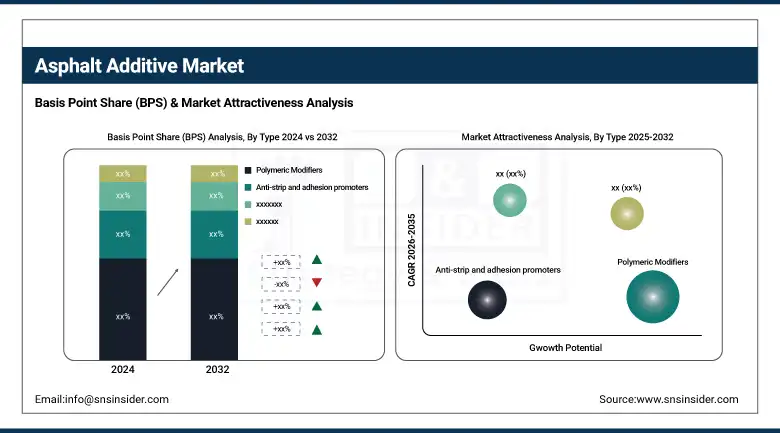
In 2024, polymeric modifiers accounted for a dominant share of the asphalt additive market, with around 29.4% of the total market. The dominance is driven by the demand for performance additives that will enhance the durability and resistance of pavements against environmental stress. According to the National Asphalt Pavement Association, some state DOTs in the U.S. already mandate the use of polymer-modified asphalt in highway projects for durability purposes. High traffic roadways require substantial usage of these additives, thus playing an essential role in the formulation of the asphalt additive market growth and impacting strategies adopted by public procurement, owing to infrastructure modernization programs.
On the other hand, rejuvenators were the fastest-growing type of asphalt additive with an estimated CAGR of 7.85%. Rapid expansion in the use of reclaimed asphalt pavement (RAP) also drives this growth, as rejuvenators are needed to restore lost properties of aged binder. With over 99% of RAP reused in the U.S. asphalt mixes and reported by the National Asphalt Pavement Association, the trend in sustainability continues. With great emphasis on recycling and the bottom-line impact from the contractor/franchise perspective, rejuvenators are starting to get traction as they find their place in the asphalt additive market analysis and long-term material planning.
By Technology
The hot mix technology dominated the asphalt additive market and accounted for a 55.6% share in 2024. The dominance is attributed to the use in government-funded road construction, with the Federal Highway Administration encouraging it. Hot mix has a track record of long-term performance and can be used in almost any climate and traffic load. Alliances on Public sector investments for infrastructure, particularly in the U.S. Infrastructure Investment and Jobs Act, have acted as a key driver for the uptake of hot mix, taking market share from cementing asphalt additives and positioning hot mix to be part of the road construction strategy.
Warm mix asphalt was the largest segment in 2024, and that will grow at a CAGR of 6.73%. The growth is fueled by benefits, such as reduced production temperatures and fuel savings linked to environmental and operational advantages. Warm mix, as we know from the Federal Highway Administration, also minimizes fuel consumption by within 35% and increases workability. These efficiencies pertain to federal emission targets and green building initiatives and may even drive uptake. Therefore, warm mix has become an important part of the asphalt additive market trends and sustainable infrastructure.
By Application
Road construction & paving dominated in 2024, accounting for 50.6% of the overall market volume. This dominance is due to the increasing investment in public road networks in the U.S., especially with the passage of the Infrastructure Investment and Jobs Act. The U.S. Department of Transportation identifies substantial funding distribution for the reconstruction and expansion of highways as propelling the market for durable asphalt product demand. This policy-driven rally is aiding asphalt additive producers in positioning road construction as a vital segment driving the growth of the asphalt additive market.
The roofing application emerged as the fastest-growing segment with the highest CAGR of 6.67%. The rising need for weather-resistant and energy-efficient roofing materials has influenced the use of asphalt additives across residential and commercial spaces. The use of asphalt-based roofing products continues to grow in the urban roofing sector because of their performance and cost benefits, the group says. This movement is being underpinned by energy code changes and green building certification programs, turning roofing into one of the principal growth factors of the asphalt additive market industry trends.
Asphalt Additive Market Regional Outlook:
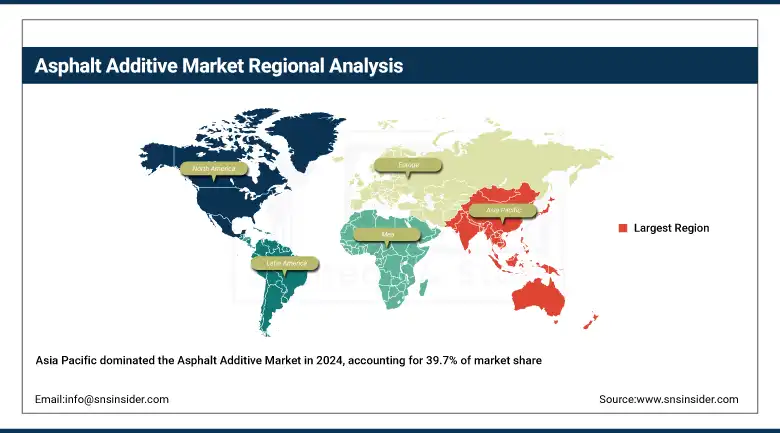
In 2024, Asia Pacific dominated the asphalt additive market, accounting for 39.7% market share due to rampant urbanization and highway construction in India and China. China's Five-Year Plan is seeing the rapid development of smart transport corridors, notes the Asian Development Bank. List of Asphalt Additive manufacturers in Asia, who can produce monsoon-proof Road Construction Chemical products, with associations with agencies for road construction. In Japan and South Korea, the use of warm mix asphalt offers environmentally friendly infrastructure options. China is the global market leader, spending over 150 billion dollars a year on roads and high-speed rail, requiring asphalt binder additives and polymeric modifiers, hence, APAC continues to dominate the asphalt additive market.
Get Customized Report as per Your Business Requirement - Enquiry Now
North America emerged as the fastest-growing region with the highest CAGR of 6.83% in the forecast period of 2025-2032. The U.S. is the leading country in the region in terms of market revenues, with USD 875.53 million and a CAGR of 6.71%, spending over USD 100 billion on roads and bridges on an annual basis under the Infrastructure Investment and Jobs Act. The National Asphalt Pavement Association boasts a 99% recycle rate for the reclaimed asphalt pavement product, and the Federal Highway Administration highlights warm mix asphalt’s environmental benefits. Rehabilitation programs override demand for polymeric modifiers in Canada. Asphalt additive producers are committing to a range of road construction chemicals focused on climate resilience and pavement durability, underscoring North America’s toward sustainable infrastructure and asphalt binder additive innovation.
Europe accounted for 19.4%, following Asia Pacific and North America. Strong investment in cross-border highway projects, supported by the European Union’s (EU) Connecting Europe Facility, and increased road rehabilitation budgets in Germany and France, as per Eurostat, have led to demand for polymeric modifiers and anti-strip agents. The Eurovia Group (EAPA) has strong focuses on sustainable road constructions products, which also forces the important asphalt additives companies to produce low-VOC emulsifiers, meeting EU elaborated directives. Both the UK. and Italy are using WMA systems with special asphalt binder additives to cut GHG and to extend pavement life.
Asphalt Additive Market Companies are:
The major asphalt additive market competitors include Dow, BASF SE, Evonik Industries AG, Kraton Corporation, Honeywell International Inc., Arkema SA, Huntsman Corporation, Ingevity Corporation, Nouryon, and Sasol Ltd.
Recent Developments:
-
In May 2025, the Advanced Carbon Council reported that biochar used as an asphalt additive generated its first carbon credit under a U.S.-recognized offset program, validating its environmental benefits in pavement applications.
-
In February 2024, Shrieve Chemical announced the launch of its organic asphalt additives in the European market, focusing on bio-based solutions to support sustainable and environmentally responsible road construction practices.
| Report Attributes | Details |
|---|---|
| Market Size in 2024 | USD 5.15 billion |
| Market Size by 2032 | USD 8.22 billion |
| CAGR | CAGR of 6.01% From 2025 to 2032 |
| Base Year | 2024 |
| Forecast Period | 2025-2032 |
| Historical Data | 2021-2023 |
| Report Scope & Coverage | Market Size, Segments Analysis, Competitive Landscape, Regional Analysis, DROC & SWOT Analysis, Forecast Outlook |
| Key Segments | •By Type (Polymeric Modifiers, Anti-strip and adhesion promoters, Emulsifiers, Chemical Modifiers, Rejuvenators, Fibers, Flux Oil, Colored Asphalt, Others) •By Technology (Hot Mix, Cold Mix, Warm Mix) •By Application (Road Construction & Paving, Roofing, Airport Construction, Others) |
| Regional Analysis/Coverage | North America (US, Canada, Mexico), Europe (Germany, France, UK, Italy, Spain, Poland, Turkey, Rest of Europe), Asia Pacific (China, India, Japan, South Korea, Singapore, Australia, Rest of Asia Pacific), Middle East & Africa (UAE, Saudi Arabia, Qatar, South Africa, Rest of Middle East & Africa), Latin America (Brazil, Argentina, Rest of Latin America) |
| Company Profiles | Dow, BASF SE, Evonik Industries AG, Kraton Corporation, Honeywell International Inc., Arkema SA, Huntsman Corporation, Ingevity Corporation, Nouryon, Sasol Ltd. |
Frequently Asked Questions
North America was the fastest-growing region in the asphalt additive market, supported by 99% RAP reuse and U.S. warm mix asphalt initiatives.
Major asphalt additive market companies include Dow, BASF, Kraton, Evonik, Honeywell, Ingevity, Arkema, Nouryon, Huntsman, and Sasol, all driving innovation.
Warm mix asphalt led growth in the asphalt additive market with a 6.73% CAGR, supported by FHWA data showing a 20–35% reduction in fuel consumption.
Polymeric modifiers dominated the asphalt additive market with a 29.4% share in 2024 due to their superior flexibility and rut resistance in harsh climates.
The asphalt additive market is projected to reach USD 8.22 billion by 2032, driven by rising demand for eco-friendly road construction chemicals and modifiers.
Get in Touch
